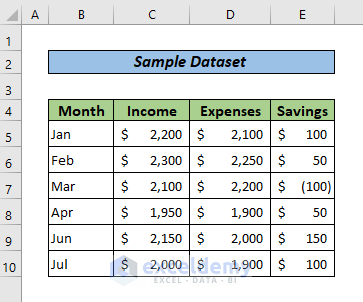
This is the sample dataset.
Step 1 – Create a Table Using the PivotTable Feature
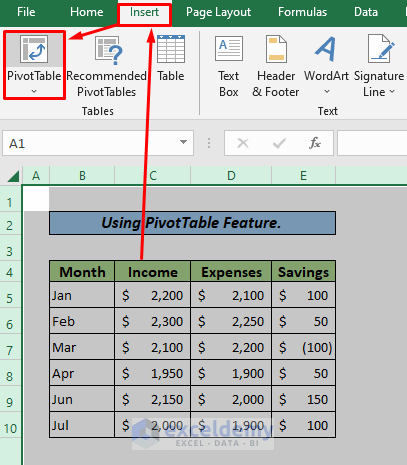
- Select the whole worksheet.
- Go to Insert > PivotTable.
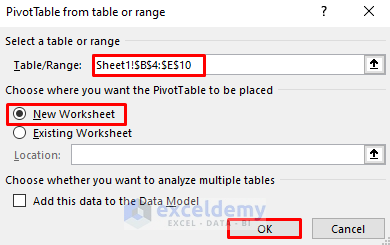
- In Table/Range, enter B4:E10 – Sheet1.
- Select a location for the pivot table.
- Click OK.
You can:
Choose New Worksheet to set a table in a new sheet.
Choose Existing Worksheet to set the table in the existing sheet.
- In Location, enter the first cell of the sheet.
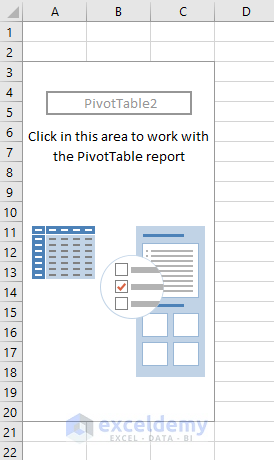
- A blank pivot table will be created.
Step 2 – Manage the Layout of the Pivot Table
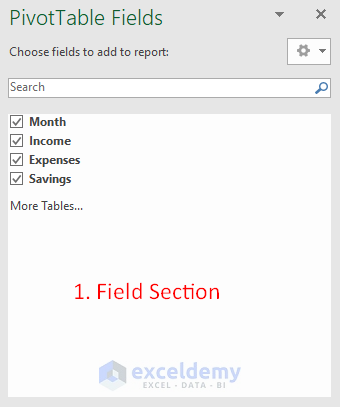
The Pivot Table Field List is divided into:
The Field Section – the names of the fields/columns in the source dataset.
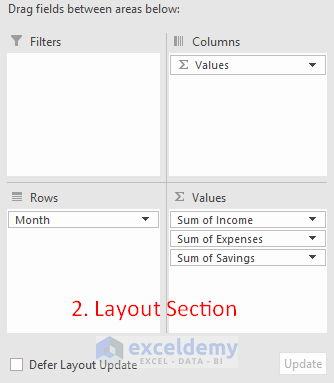
The Layout section – Report Filter, Row Labels, Column Labels, and the Values area. You can modify the fields of the table here.
Read More: How to Create an Expense Report in Excel
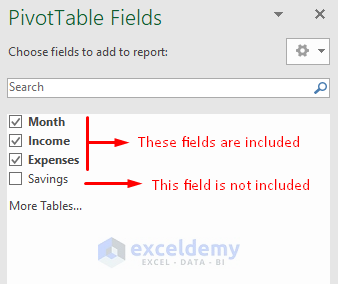
Step 3 – Add or Remove a Field
- To add a field in Layout, check the field name. You can remove a field by unchecking it.
Notes:
The fields in the Layout section are:
- Numeric fields (included in the Values area).
- Text fields (included in the Row Labels area).
- Date or time hierarchies (added to the Column Labels area).
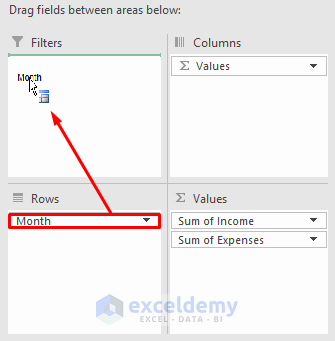
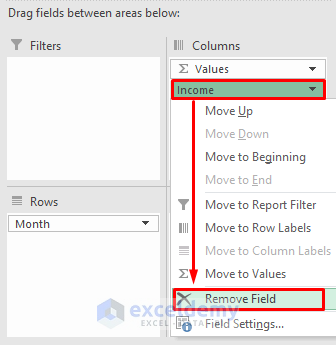
Step 4 – Arrange Pivot Table Fields
- Drag and Drop fields in the four areas in the Layout section. Change the order of the fields by dragging and dropping.
- In Field, right-click the field name, and click the area where you need to add it.
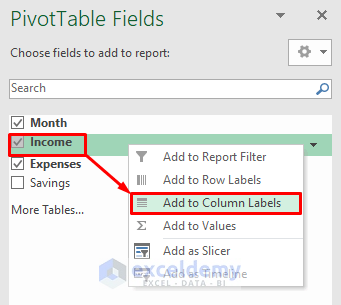
- Click the down arrow next to the field name to get a drop-down list that includes all available options for that specific field.
Download Practice Workbook
Download the practice workbook.
Related Article
- How to Make Report Card in Excel
- How to Automate Excel Reports Using Macros
- How to Generate Report in Excel using VBA pdf
- How to Generate Reports in Excel Using Macros
- How to Create a Summary Report in Excel
- How to Generate PDF Reports from Excel Data
- How to Generate Reports from Excel Data
<< Go Back to Report in Excel | Learn Excel
Get FREE Advanced Excel Exercises with Solutions!
