How to Generate Reports from Excel Data (2 Easy Methods)

We store important information in our Excel worksheet. We also perform necessary operations on our data to analyze different things from time to time. Now, generating a report on a regular time from these Excel data is essential for a company or other institutions. They can understand the improvements or can get proper knowledge on the area that needs to be improved through these reports. In this article, we’ll show you the effective yet simple methods to Generate Reports from Excel Data.

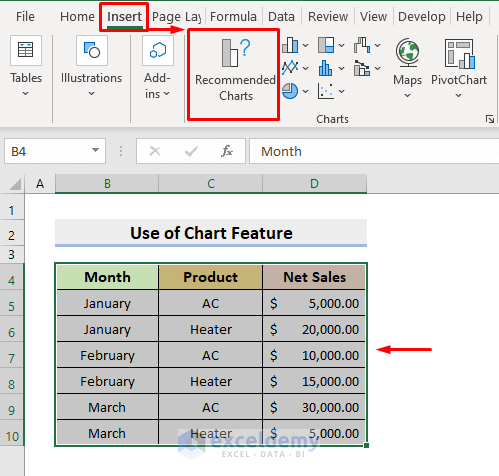
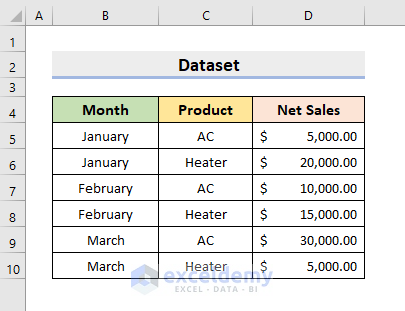
To illustrate, we’ll use a sample dataset as an example. For instance, the below dataset represents 3 Months (JanuaryMarch), 2 Products (AC and Heater), and the Net Sales of a company. In this article, we’ll generate reports on the Sum of Net Sales by Month and also by Products.
Generate Reports from Excel Data


1. Inserting Chart to Generate Reports from Excel Data

1.1 Adding Recommended Charts

We’ll make use of the Excel Chart feature in our first method. So, follow the steps given below to generate reports from Excel data.

STEPS:

  • First, select the range B4:C10.
  • Then, go to Insert ➤ Recommended Charts.

Insert Chart to Generate Reports from Excel Data

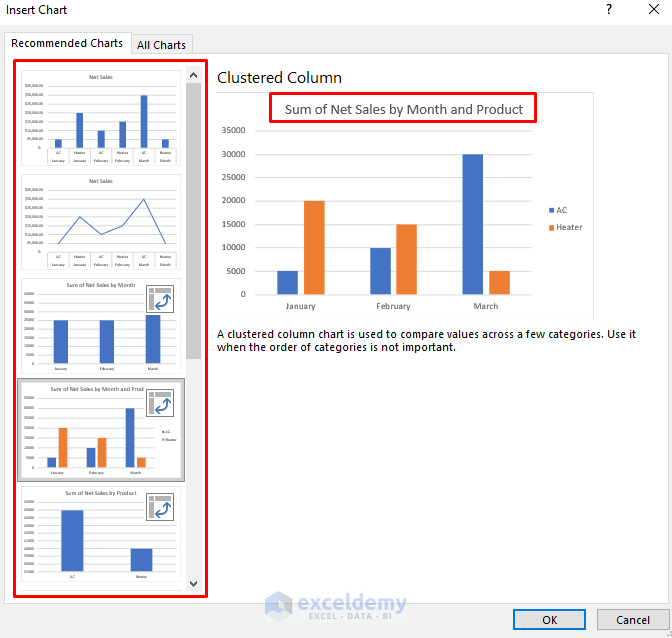
  • As a result, the Insert Chart dialog box will pop out.
  • There, select your desired chart type from the left pane.
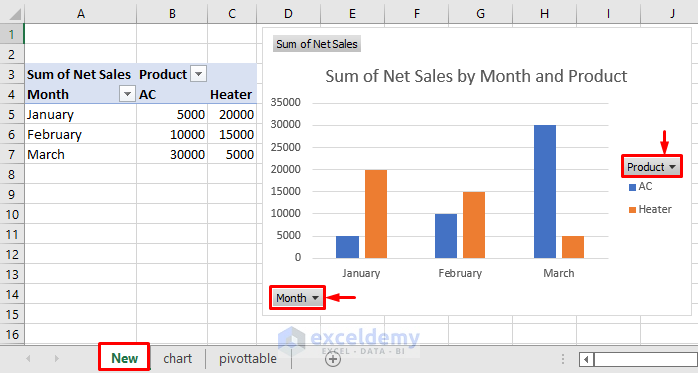
  • For this example, select Clustered Column. It’ll return a chart showing the Net Sales of each product in each month in 2 Different Colors. Hence, it’s easy to distinguish.
Insert Chart to Generate Reports from Excel Data

  • After that, press OK.
  • Consequently, you’ll get your desired chart in a new worksheet as shown below.
  • Moreover, you can click the Month and Product drop-down icons to sort out your required fields.

Insert Chart to Generate Reports from Excel Data

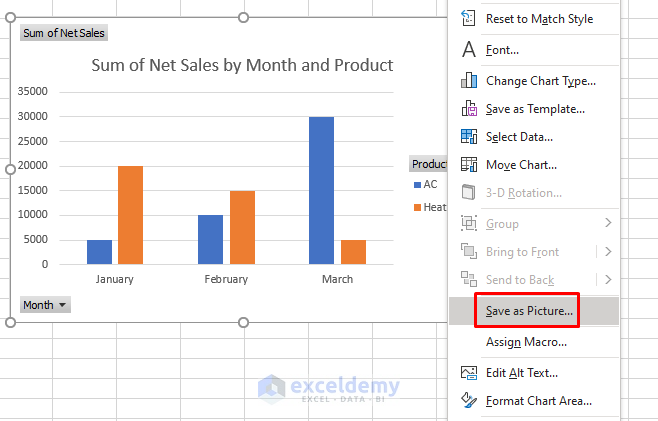
  • Additionally, you can save the chart as a separate picture if you wish.
  • For that purpose, select the chart and right-click on the mouse.
  • Lastly, choose Save as Picture.

Insert Chart to Generate Reports from Excel Data


1.2 Creating Chart Manually

However, if you wish to create your chart instead of the Excel recommendations, follow the below steps.

STEPS:

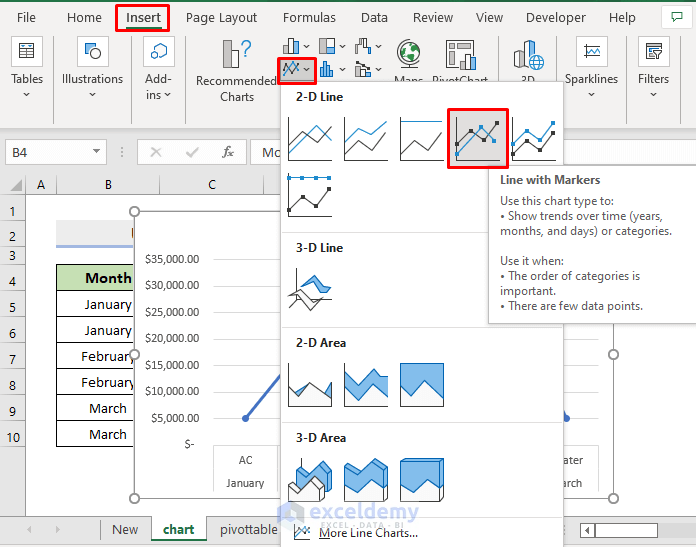
  • Firstly, choose B4:C10 and select the Insert tab.
  • Next, choose your desired chart. In this example, press the 2-D Line graph with Markers.

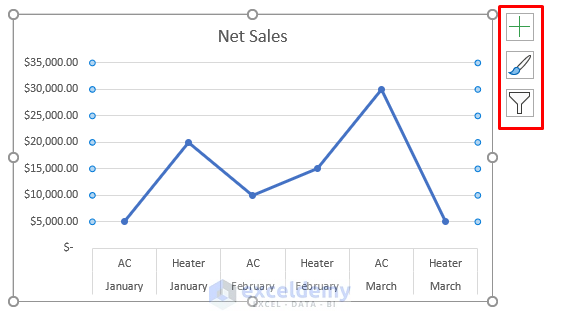
  • Thus, you’ll get a line graph as demonstrated below.
  • Here, you can modify your chart by pressing the 3 different icons shown in the red-colored box beside the chart.

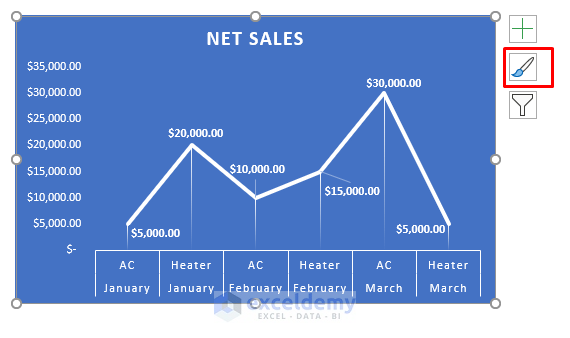
  • For instance, we change the chart style by clicking the middle icon and choosing the desired style. See the figure below.

Read More: How to Make Sales Report in Excel


2. Generating Reports Through Excel PivotTable Feature

PivotTable is a very useful feature in Excel. In this method, we’ll apply this feature to generate our reports. Therefore, learn the following steps for performing the task.

STEPS:

  • Select B4:C10 at first.
  • Now, click the Insert tab and choose PivotTable ➤ From Table/Range.
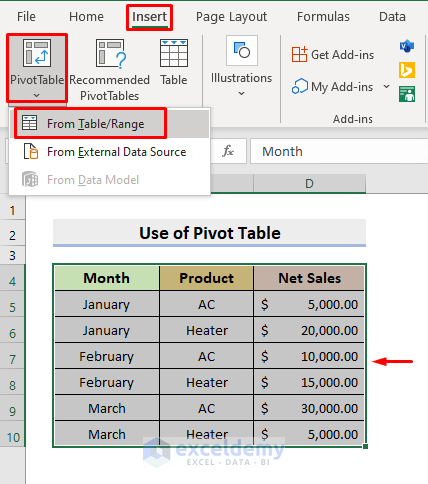
Apply Excel PivotTable Feature for Generating Reports

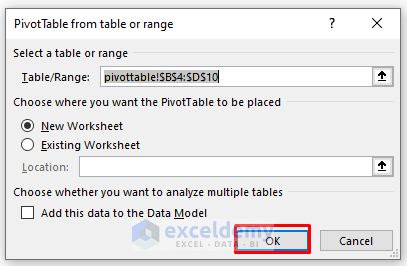
  • Next, a dialog box will appear. There, press OK.

Apply Excel PivotTable Feature for Generating Reports

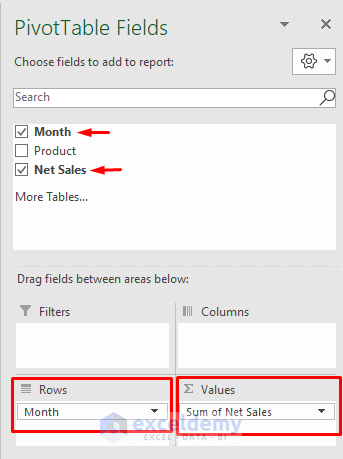
  • As a result, a new worksheet will emerge. On the right side pane, you’ll get to see PivotTable Fields.
  • Subsequently, check the Month and Net Sales.
  • Place Month in Rows and Net Sales in the Values section.

Apply Excel PivotTable Feature for Generating Reports

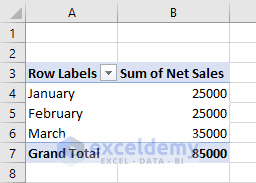
  • Hence, it’ll return the report as shown below where the Sum of Net Sales is on the basis of Months.

Apply Excel PivotTable Feature for Generating Reports

  • Again, clear the checkmark for the Month and place the Product in the Rows section.
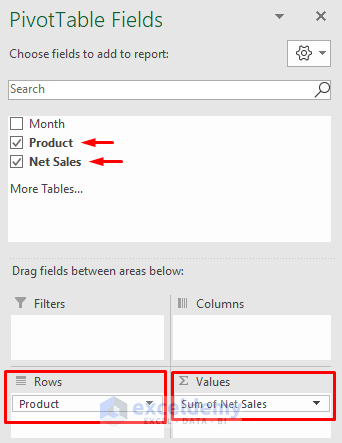
Apply Excel PivotTable Feature for Generating Reports

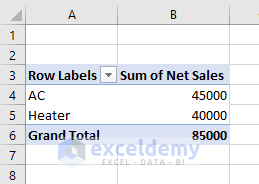
  • At last, it’ll return the report based on the products.

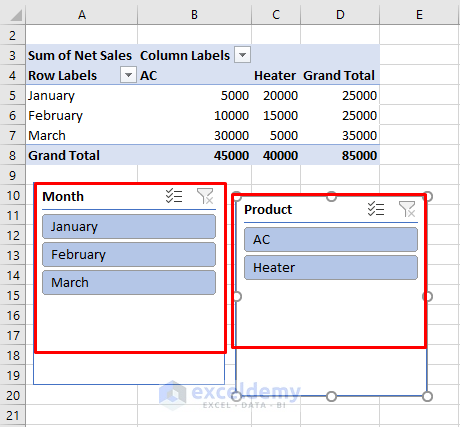
  • Now, to add Slicer, go to PivotTable Analyze.
  • Press Insert Slicer from the Filter section.

  • Finally, you’ll get the slicers and make the required changes through the slicers to see your desired results.

Read More: Create a Report in Excel as a Table


How to Print Reports Generated from Excel Data

In the end, we may also need to print the reports instead of just keeping them in the Excel workbook. Hence, learn the process to carry out the operation.

STEPS:

  • First of all, go to the Insert tab.
  • Press Header & Footer from the Text drop-down.
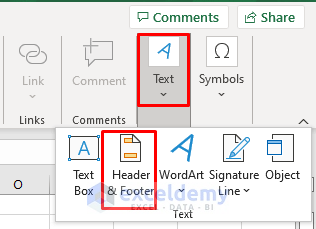
Print Generated Reports from Excel Data

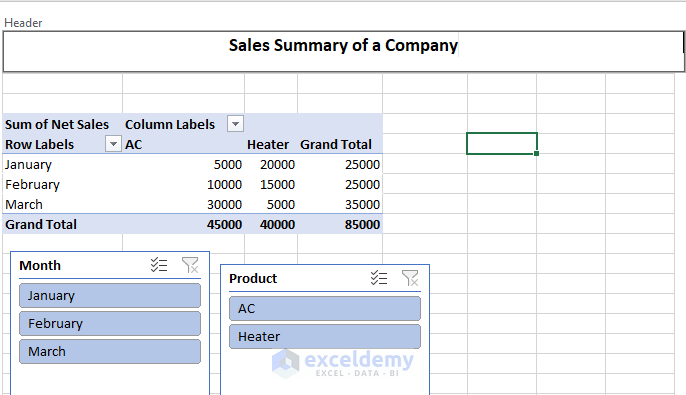
  • Then, type the Header as given below.

Print Generated Reports from Excel Data

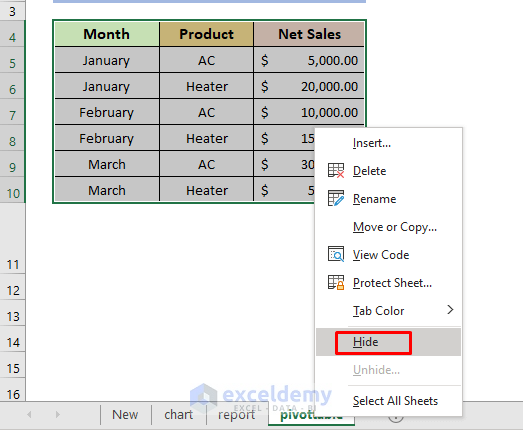
  • Afterward, hide the sheets that you don’t want on the report.
  • For that, select the sheet and right-click on the mouse.
  • Choose Hide.

Print Generated Reports from Excel Data

  • Next, go to the File tab.
  • In the File window, select Print.
  • Choose Print Entire Workbook, Landscape Orientation, Fit All Columns on One Page.
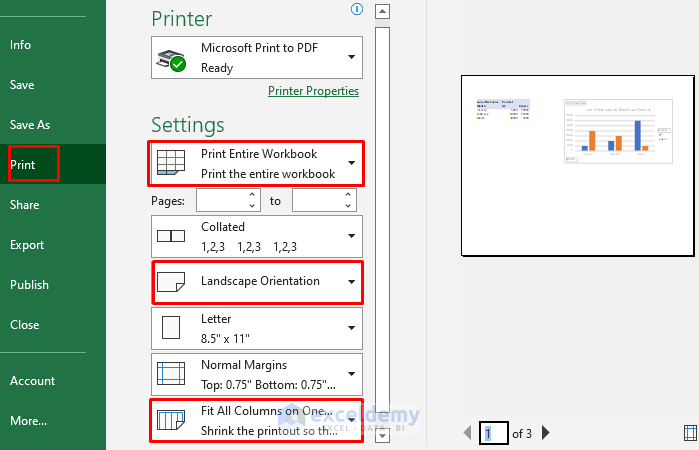
  • In the end, select Print and it’ll generate a PDF file of the report.

Read More: How to Create a Summary Report in Excel


Download Practice Workbook

Download the following workbooks to practice by yourself.


Conclusion

Henceforth, you will be able to generate reports from Excel data following the above-described methods. Keep using them, and let us know if you have more ways to do the task. Don’t forget to drop comments, suggestions, or queries if you have any in the comment section below.


Related Articles


<< Go Back to Report in Excel | Learn Excel

Get FREE Advanced Excel Exercises with Solutions!
Aung Shine
Aung Shine

Aung Shine completed his bachelor’s in Electrical and Electronics Engineering from Bangladesh University of Engineering and Technology. It has been almost 2 years since he joined SOFTEKO and actively working on the ExcelDemy project. Currently he works as a Team Leader where he guides his team members to create technical content. He has published 150+ articles and reviewed 50+ articles. He has also solved various user problems before. He has interests in Data Analysis, Power Query, Advanced Excel,... Read Full Bio

We will be happy to hear your thoughts

Leave a reply

Advanced Excel Exercises with Solutions PDF


ExcelDemy
Logo