In this article, I’ll show you how you can automate your Excel reports in the office using Macros.
Automate Excel Reports Using Macros (Quick View)
Sub Profit_Loss_Report()
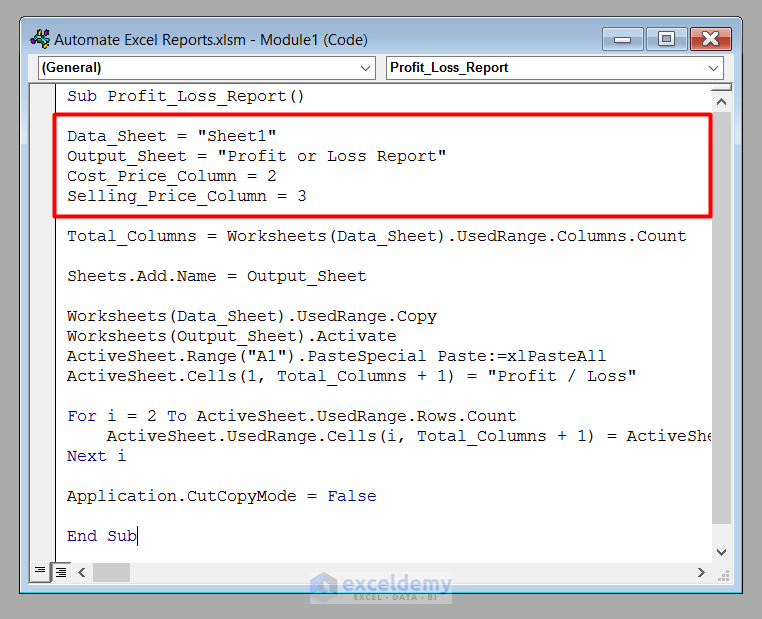
Data_Sheet = "Sheet1"
Output_Sheet = "Profit or Loss Report"
Cost_Price_Column = 2
Selling_Price_Column = 3
Total_Columns = Worksheets(Data_Sheet).UsedRange.Columns.Count
Sheets.Add.Name = Output_Sheet
Worksheets(Data_Sheet).UsedRange.Copy
Worksheets(Output_Sheet).Activate
ActiveSheet.Range("A1").PasteSpecial Paste:=xlPasteAll
ActiveSheet.Cells(1, Total_Columns + 1) = "Profit / Loss"
For i = 2 To ActiveSheet.UsedRange.Rows.Count
ActiveSheet.UsedRange.Cells(i, Total_Columns + 1) = ActiveSheet.UsedRange.Cells(i, Selling_Price_Column) - ActiveSheet.UsedRange.Cells(i, Cost_Price_Column)
Next i
Application.CutCopyMode = False
End Sub
Without further delay, we’ll start our proceedings here. But before starting, I would like to remind you of a few things. You can accomplish a bunch of things using Excel macros. Regarding automating your business reports, from the balance sheet and income statement to the closing journal, you can prepare everything in Excel using Macros.
But I’ll not go so deep here. In fact, one single article is not enough to cover everything. Today I’ll show you how to generate a simple profit or loss report using Excel macros.
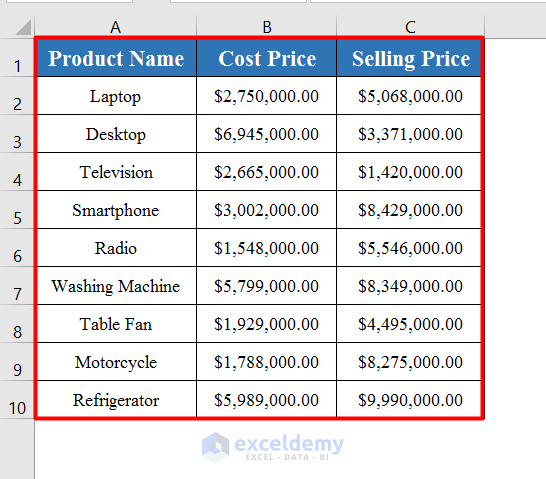
Here we’ve got a worksheet called Sheet1 with a data set that contains the buying and selling prices of some products of a company.
First of all, we’ll generate a profit/loss report from this data set.
Then we’ll generate a report of profit/loss percentage.
Finally, we’ll generate a report showing the total profit or loss and its percentage.
1. Automating Profit/Loss Reports Using Excel Macros
To generate the profit/loss report, we’ll use the following VBA code.
⧭ VBA Code:
Sub Profit_Loss_Report()

Data_Sheet = "Sheet1"
Output_Sheet = "Profit or Loss Report"
Cost_Price_Column = 2
Selling_Price_Column = 3

Total_Columns = Worksheets(Data_Sheet).UsedRange.Columns.Count

Sheets.Add.Name = Output_Sheet
Worksheets(Data_Sheet).UsedRange.Copy
Worksheets(Output_Sheet).Activate
ActiveSheet.Range("A1").PasteSpecial Paste:=xlPasteAll
ActiveSheet.Cells(1, Total_Columns + 1) = "Profit / Loss"

For i = 2 To ActiveSheet.UsedRange.Rows.Count
    ActiveSheet.UsedRange.Cells(i, Total_Columns + 1) = ActiveSheet.UsedRange.Cells(i, Selling_Price_Column) - ActiveSheet.UsedRange.Cells(i, Cost_Price_Column)
Next i

Application.CutCopyMode = False

End Sub
⧭ Output:
Run this code. It’ll generate a new worksheet called the Profit or Loss Report and calculate the profit or loss of each product there.

⧭ Notes:
The first 4 lines of the code contain the inputs to the code (Data Sheet Name, Output Sheet Name, Cost Price Column, and Selling Price Column). Don’t forget to change them according to your needs.
2. Using Excel Macros to Automate Profit/Loss Percentage Reports
Next, we’ll generate a report containing the percentages of the profits/losses and the numerical values.
The VBA code will be:
⧭ VBA Code:
Sub Profit_Loss_Percentage_Report()
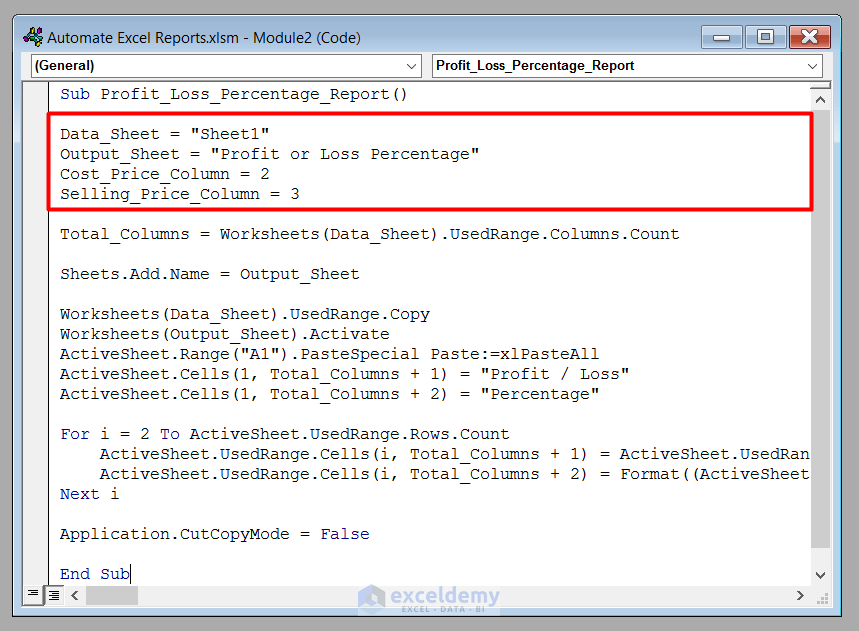
Data_Sheet = "Sheet1"
Output_Sheet = "Profit or Loss Percentage"
Cost_Price_Column = 2
Selling_Price_Column = 3
Total_Columns = Worksheets(Data_Sheet).UsedRange.Columns.Count
Sheets.Add.Name = Output_Sheet
Worksheets(Data_Sheet).UsedRange.Copy
Worksheets(Output_Sheet).Activate
ActiveSheet.Range("A1").PasteSpecial Paste:=xlPasteAll
ActiveSheet.Cells(1, Total_Columns + 1) = "Profit / Loss"
ActiveSheet.Cells(1, Total_Columns + 2) = "Percentage"
For i = 2 To ActiveSheet.UsedRange.Rows.Count
ActiveSheet.UsedRange.Cells(i, Total_Columns + 1) = ActiveSheet.UsedRange.Cells(i, Selling_Price_Column) - ActiveSheet.UsedRange.Cells(i, Cost_Price_Column)
ActiveSheet.UsedRange.Cells(i, Total_Columns + 2) = Format((ActiveSheet.UsedRange.Cells(i, Total_Columns + 1) / ActiveSheet.UsedRange.Cells(i, Cost_Price_Column)), "#.00%")
Next i
Application.CutCopyMode = False
End Sub
⧭ Output:
Run this code. It’ll generate a new worksheet called Profit or Loss Percentage and first calculate the profit or loss of each product, then the percentage.

⧭ Notes:
Again, the first 4 lines of the code contain the inputs to the code (Data Sheet Name, Output Sheet Name, Cost Price Column, and Selling Price Column). Don’t forget to change them according to your needs.
3. Automating a Report Containing the Total Profit/Loss and the Percentage
Finally, we’ll generate a report that contains the profit/loss of each product, the percentage, and the total profit/loss.
We’ll use the following VBA code for this purpose.
⧭ VBA Code:
Sub Total_Profit_Loss_Report()

Data_Sheet = "Sheet1"
Output_Sheet = "Total Profit or Loss"
Cost_Price_Column = 2
Selling_Price_Column = 3

Total_Rows = Worksheets(Data_Sheet).UsedRange.Rows.Count
Total_Columns = Worksheets(Data_Sheet).UsedRange.Columns.Count

Sheets.Add.Name = Output_Sheet
Worksheets(Data_Sheet).UsedRange.Copy
Worksheets(Output_Sheet).Activate
ActiveSheet.Range("A1").PasteSpecial Paste:=xlPasteAll
ActiveSheet.Cells(1, Total_Columns + 1) = "Profit / Loss"
ActiveSheet.Cells(1, Total_Columns + 2) = "Percentage"

Total_Cost_Price = 0
Total_Selling_Price = 0

For i = 2 To ActiveSheet.UsedRange.Rows.Count
    Total_Cost_Price = Total_Cost_Price + ActiveSheet.UsedRange.Cells(i, Cost_Price_Column)
    Total_Selling_Price = Total_Selling_Price + ActiveSheet.UsedRange.Cells(i, Selling_Price_Column)
Next i

ActiveSheet.UsedRange.Cells(Total_Rows + 1, 1) = "Total"
ActiveSheet.UsedRange.Cells(Total_Rows + 1, Cost_Price_Column) = Total_Cost_Price
ActiveSheet.UsedRange.Cells(Total_Rows + 1, Selling_Price_Column) = Total_Selling_Price

For i = 2 To ActiveSheet.UsedRange.Rows.Count
    ActiveSheet.UsedRange.Cells(i, Total_Columns + 1) = ActiveSheet.UsedRange.Cells(i, Selling_Price_Column) - ActiveSheet.UsedRange.Cells(i, Cost_Price_Column)
    ActiveSheet.UsedRange.Cells(i, Total_Columns + 2) = Format((ActiveSheet.UsedRange.Cells(i, Total_Columns + 1) / ActiveSheet.UsedRange.Cells(i, Cost_Price_Column)), "#.00%")
Next i

Application.CutCopyMode = False

End Sub
⧭ Output:
Run this code. It’ll generate a new worksheet called Total Profit or Loss. Then it’ll calculate the profit/loss of each product, its percentage, the total profit/loss, and the percentage.

⧭ Notes:
Again, the first 4 lines of the code contain the inputs to the code (Data Sheet Name, Output Sheet Name, Cost Price Column, and Selling Price Column). Don’t forget to change them according to your needs.

Things to Remember
Once you run any of the above 3 codes, a new worksheet is created with the respective name. If you want to run the code again, don’t forget to delete this worksheet. Otherwise, Excel can’t generate two worksheets of the same name and will show an error.
Download Practice Workbook
Download this practice workbook to exercise while you are reading this article.
Conclusion
So, these are the ways to automate some simple reports using Excel macros. You are most welcome to feel free to comment if you have any questions or queries.
Related Articles
- How to Generate Report in PDF Format Using Excel VBA
- How to Generate Reports Using Macros in Excel
- Create a Report in Excel as a Table
- How to Generate PDF Reports from Excel Data
- How to Generate Reports from Excel Data
- How to Create a Summary Report in Exce
- How to Make Report Card in Excel
<< Go Back to Report in Excel | Learn Excel
Get FREE Advanced Excel Exercises with Solutions!
