1. Making of Daily Production Report in Excel
Steps:
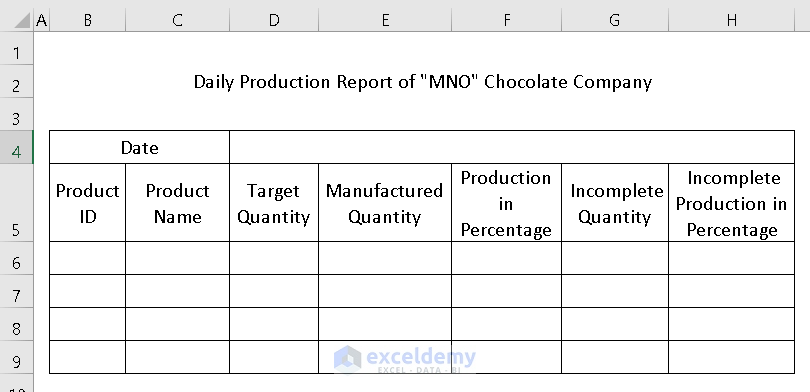
- Create a table. I have created a table to record Production in Percentage, Incomplete Quantity, and Incomplete Production in Percentage according to a particular product.
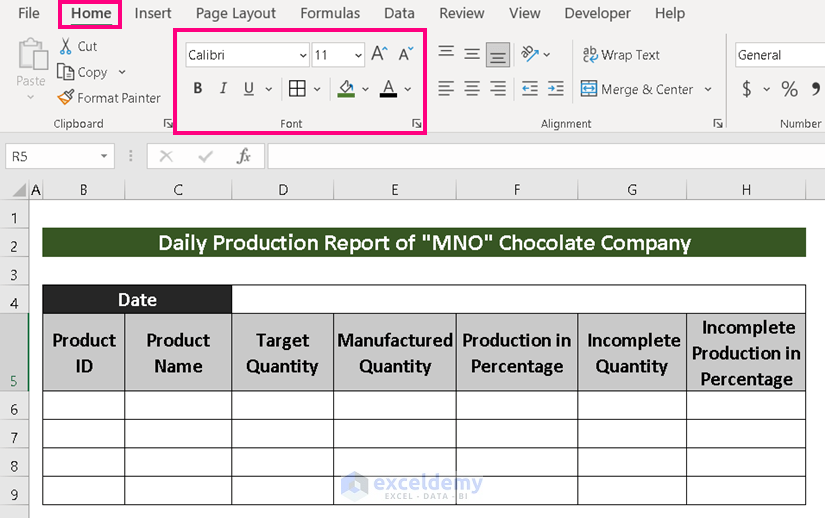
- Use Font groups in the Home tab to modify your dataset according to your choice.
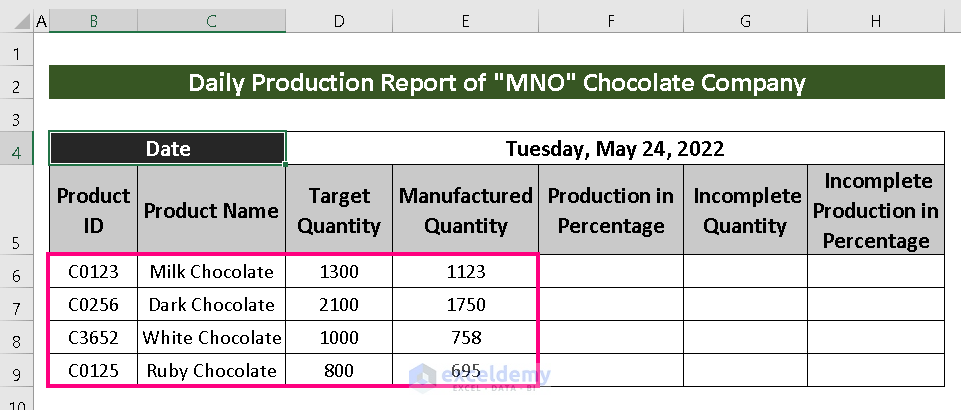
- Input your data of a particular date.
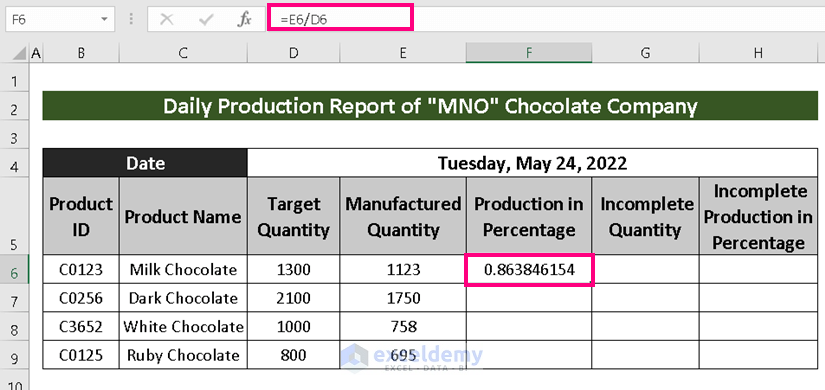
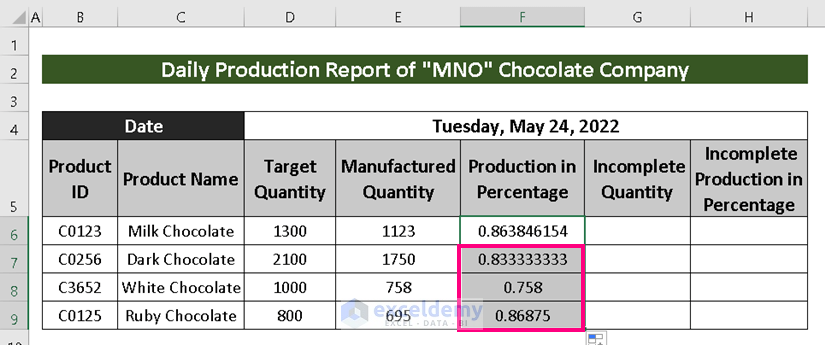
- Find out Production in Percentage, use the following formula:
=E6/D6Where Manufactured Quantity is divided by Target Quantity.
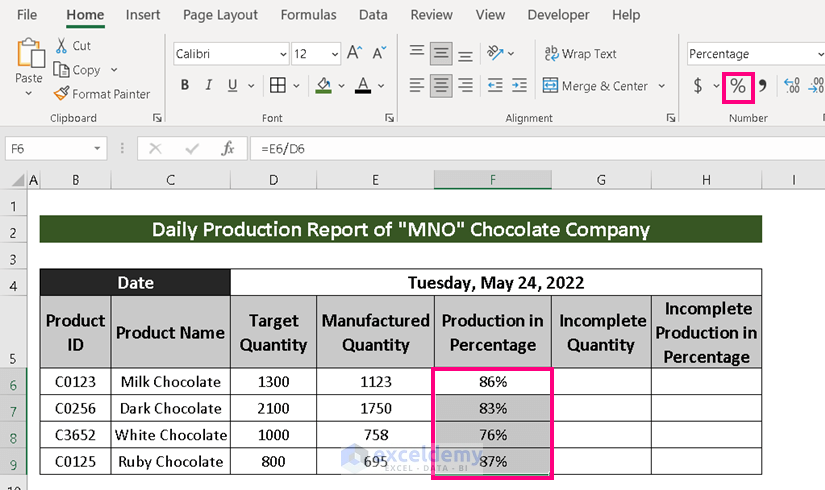
- AutoFill the rests.
- Select Percentage from the Number group under the Home tab.
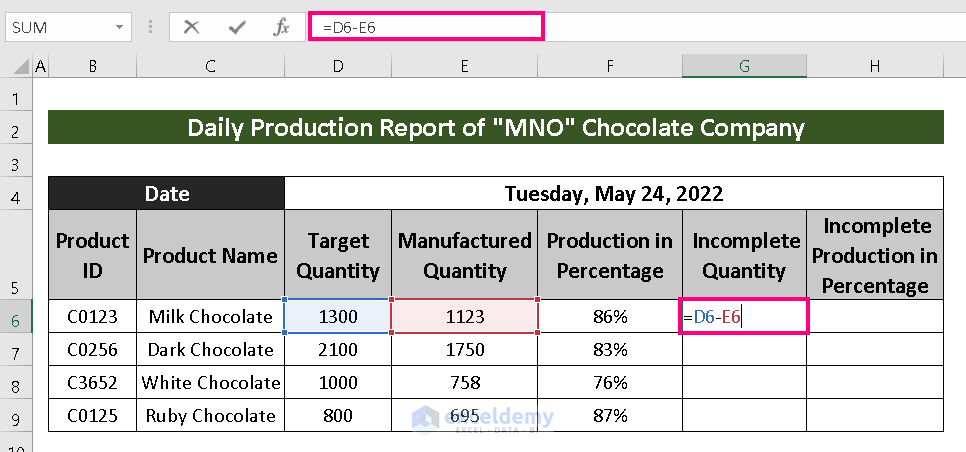
- To Calculate the Incomplete Quantity, use the following formula:
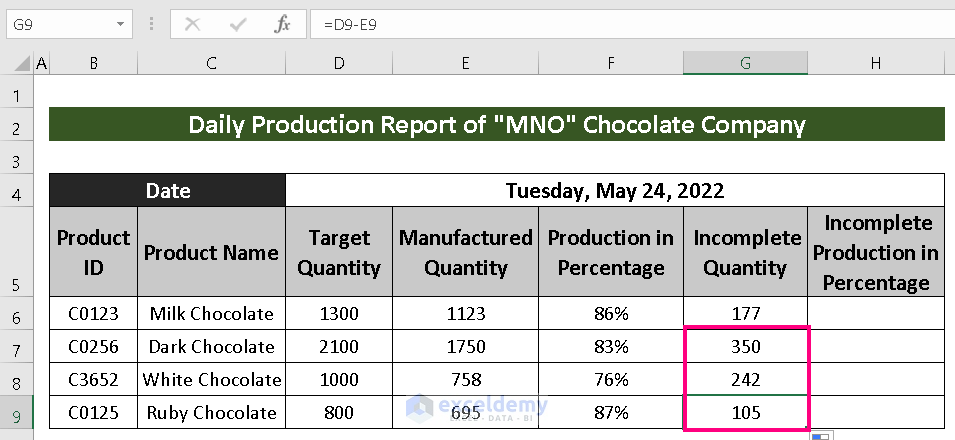
=D6-E6Where Target Quantity is subtracted with the Manufactured Quantity.
- Use Fill Handle to AutoFill till the last.
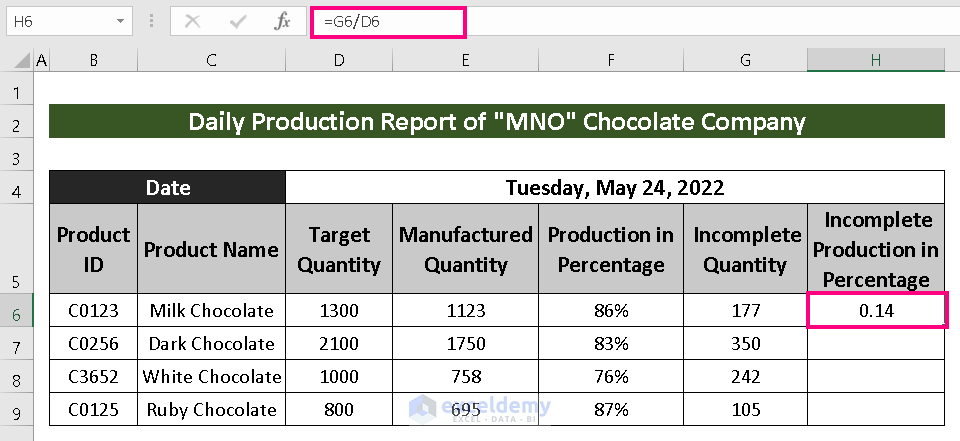
- To find out Incomplete Production in Percentage, use the following formula:
=G6/D6Where Incomplete Quantity is divided by Target Quantity.
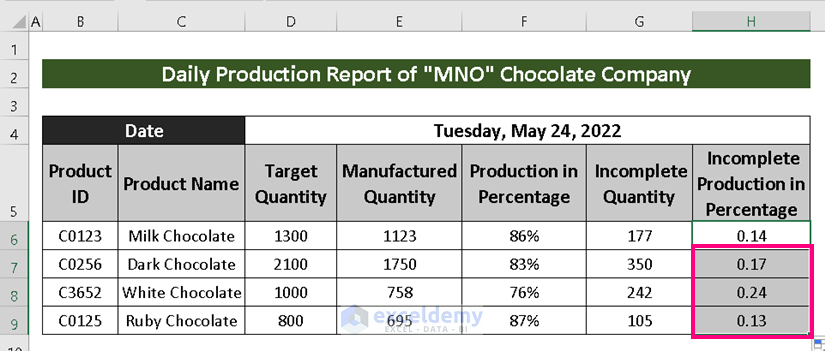
- AutoFill the rests.
- Click on Percentage to complete making the production report.
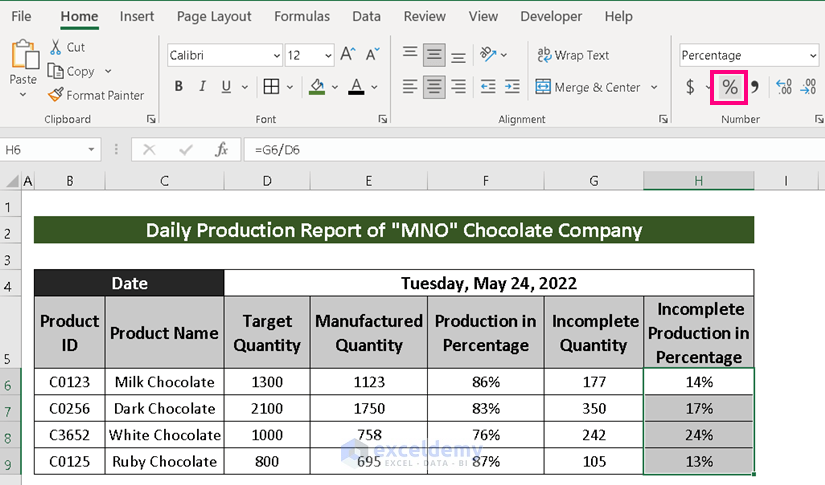
This highlights the production information on a daily basis. The template or need for information can be different for different companies, so you may need to adjust a few columns.
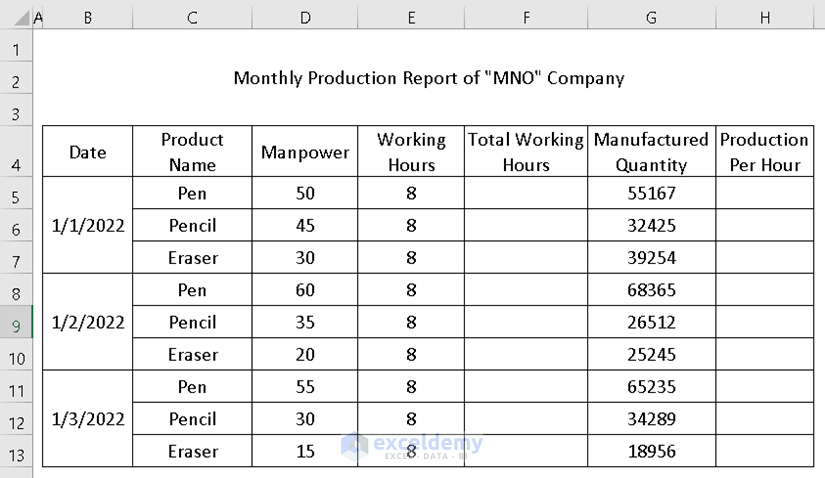
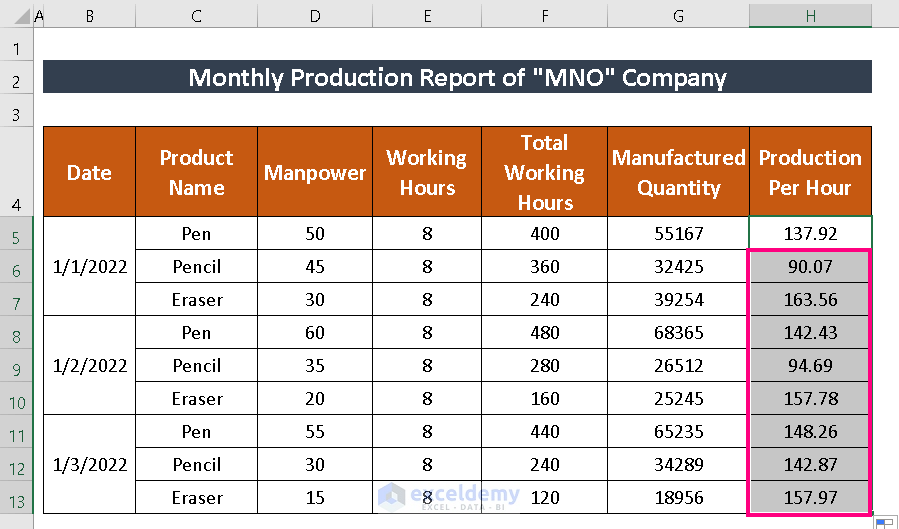
Method 2 – Making of Monthly Production Report
Steps:
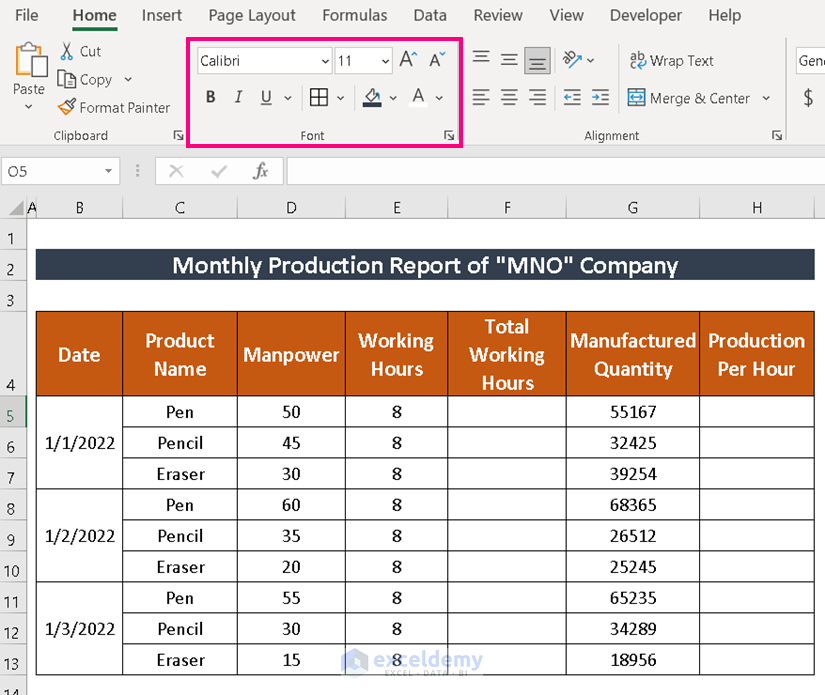
- A table to record Total Working Hours, Production Per Hour with the help of Manpower, Working Hours and Manufactured Quantity.
- Use the Font group in the Home tab to decorate the dataset.
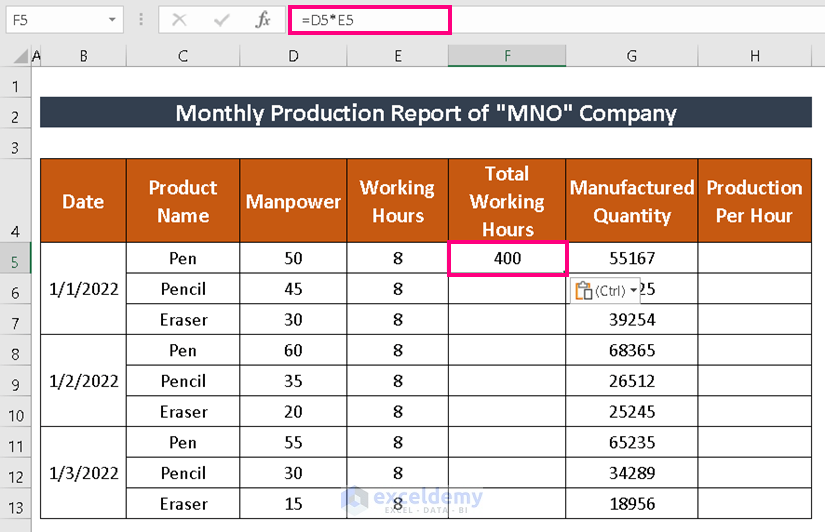
- Use the following formula to calculate Total Working Hours :
=D5*E5Where Manpower is multiplied with Working Hours.
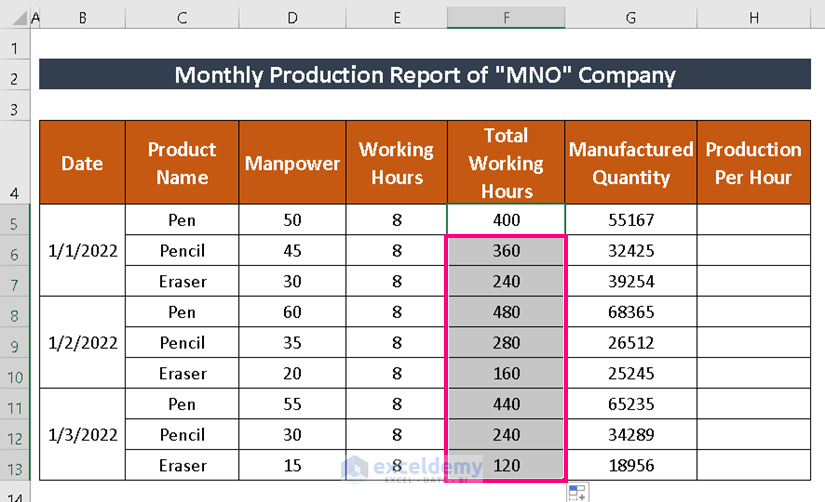
- Fill the rests with AutoFill.
- Calculate Production Per Hour using the following formula:
=G5/F5Where Manufactured Quantity is divided by Total Working Hours.
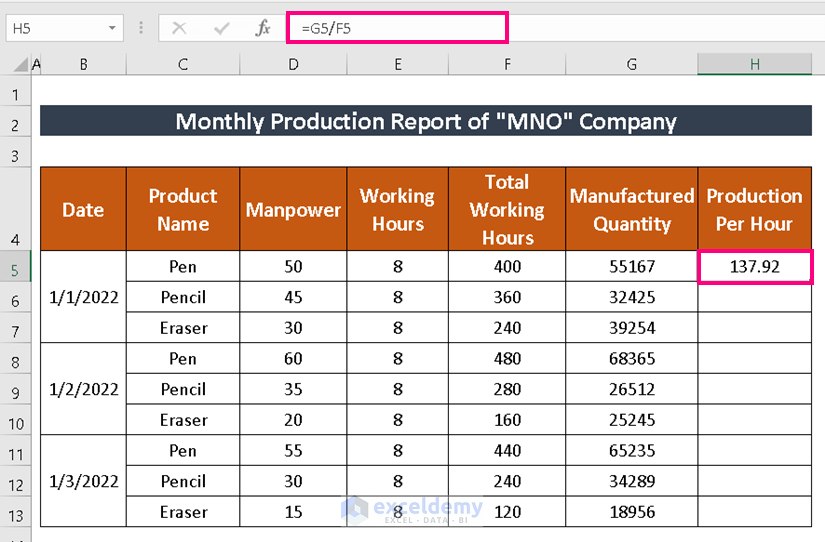
- Use AutoFill for the remaining cells.
Download Practice Workbook
Related Articles
- How to Create an Expense Report in Excel
- How to Make a Monthly Expense Report in Excel
- How to Make Daily Production Report in Excel
- How to Create an Income and Expense Report in Excel
- How to Make Daily Activity Report in Excel
- How to Make Monthly Report in Excel
<< Go Back to Report in Excel | Learn Excel
Get FREE Advanced Excel Exercises with Solutions!
