Method 1 – Line Graph Command Is Producing Two Lines
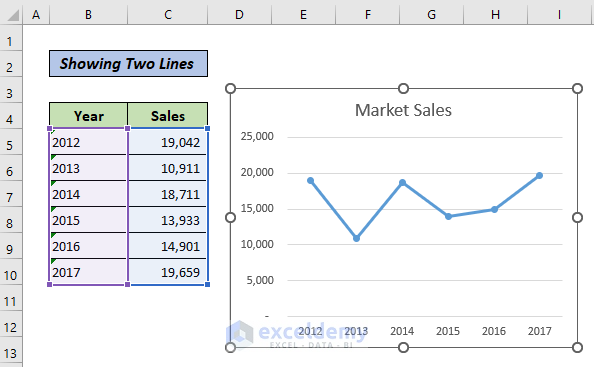
If you want to show two lines in a chart, you need to convert one series of data (in this example, Year) into text format. Look at the following image. We have plotted this chart to show different sales in different years. Inserting a line chart gives us the two lines in the chart.
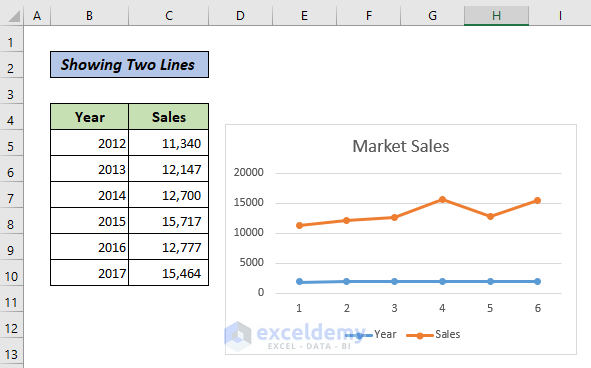
Our goal is to omit the Year line from the chart.
Solution:
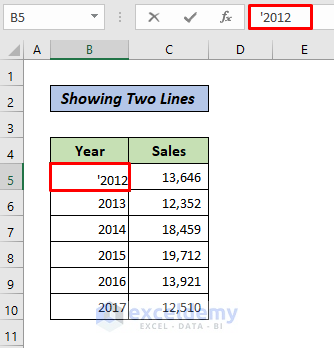
- We need to convert the Year data into text format. We can simply do this by selecting data and putting an Apostrophe in front of it, as shown in the image below.
- You need to drag the Fill Handle to the remaining cells to convert all the Year data into text format.
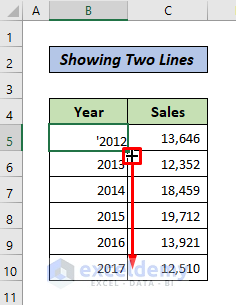
Is the Year data converted to text data.
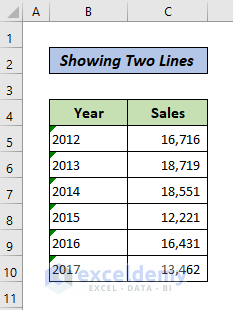
- Insert the double-line chart again. You will see the one line that is the Sales line.
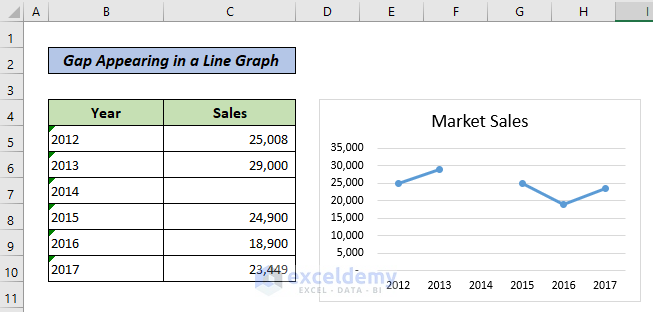
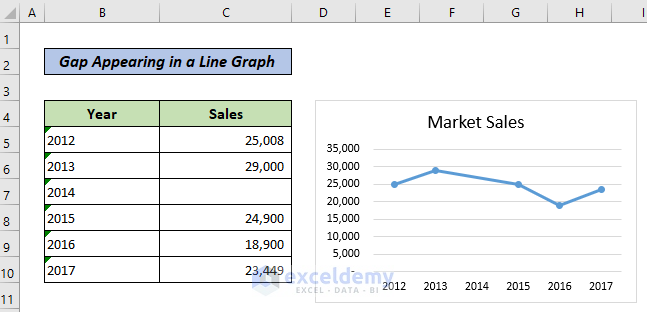
Method 2 – Gap Appearing in a Line Graph
An Excel line chart may contain a gap in the line when you create it. There is a possibility that this issue will occur if there is a blank cell in the data range for the Line chart.
Solution:
This is a solution you can use to overcome this issue.
Display empty cells based on interpolation. For that, just do the following.
» In Excel 2007 and Higher Versions:
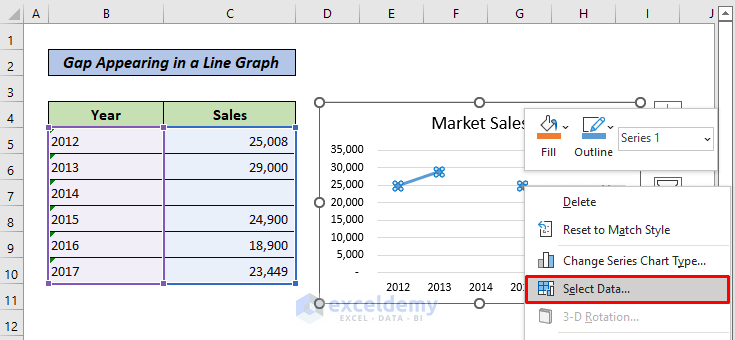
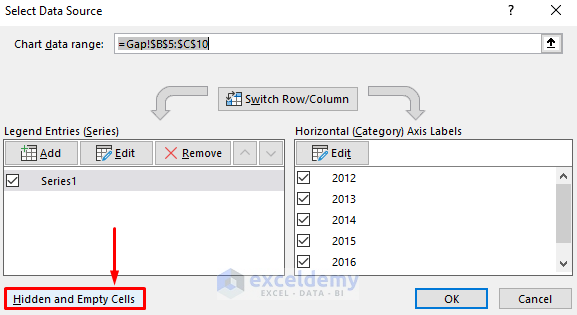
- Right-click anywhere within the chart after selecting the chart. Click on Select Data. A Select Data Source dialog box will pop up.
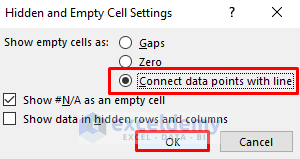
- Select Hidden and Empty Cells. A Hidden and Empty Cells Settings dialog box will appear.
- Choose the “Connect data points with line” option, press OK twice.
This is the result.
» Excel 2000-2003:
- Click your Line chart.
- Click Options from the Tools menu.
- Select Interpolated from the Chart tab, click OK.
Method 3 – Line Not Visible on Chart
Consider a chart with the year on the X-axis and COMBO Y-axis in which data is displayed as four series (three lines on the left Y-axis and one bar graph on the right Y-axis). The lines are all good except for one that isn’t visible. There is a legend for the missing line, but not the actual data line, showing up as part of the data series. You may have tried selecting data/hiding cells/connecting data points with lines but cannot get the last data to appear. There is a solution for you discussed below.
Solution:
The Chart Tools group appears on the right-hand side of the Ribbon, including the Design and Format tabs. You can select different chart elements in the Format tab using a dropdown menu on the left. You should see little handles where the points should be if you select a series you cannot see.
Download Practice Workbook
You can download the following practice workbook that we have used to prepare this article
Related Articles
- How to Make a Double Line Graph in Excel
- How to Plot Multiple Lines in One Graph in Excel
- How to Combine Two Line Graphs in Excel
- How to Combine Bar and Line Graph in Excel
- How to Combine Two Bar Graphs in Excel
- How to Edit a Line Graph in Excel
- How to Overlay Line Graphs in Excel
<< Go Back To Line Graph in Excel | Excel Charts | Learn Excel
Get FREE Advanced Excel Exercises with Solutions!
