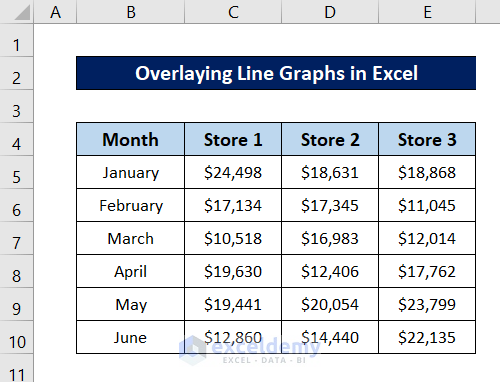
We will plot the types of graphs from the same dataset, which is below. The dataset includes sales of different stores in different months. All months are situated in the same row, and all sales are measured in the same unit (dollar currency).
Method 1 – Overlay the Line Graph with Another Line Graph
Steps:
- Select the whole dataset (the range B4:E10).
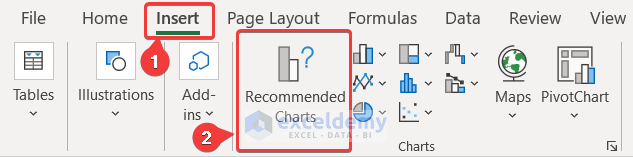
- Go to the Insert tab on your ribbon.
- Select Recommended Charts from the Charts group.
- The Insert Chart box will open up. You can plot one from the Recommended Charts.
- To plot and overlay these graphs manually, go to the All Charts tab in the box.
- Select Line as the chart type from the left of the box, and from the right, select Line (the first one) and the type of line graph you want.
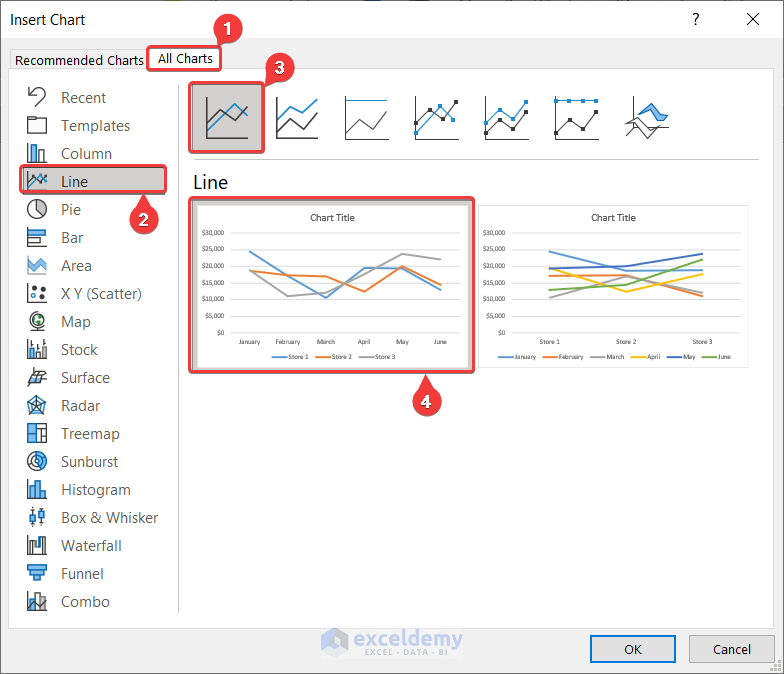
- Click OK.
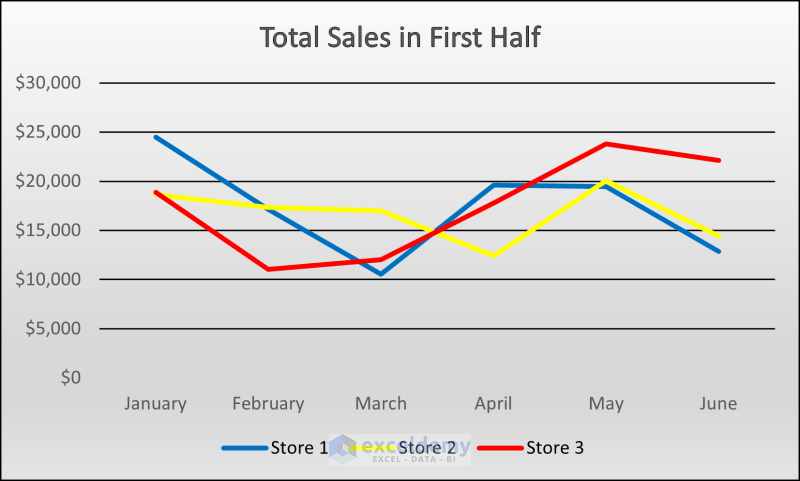
- A chart will appear with overlaying line graphs over the Excel spreadsheet.
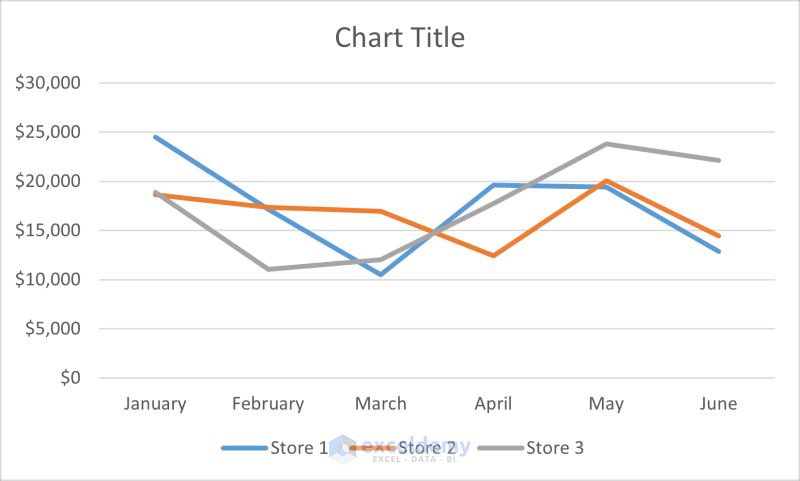
- You can make the chart more presentable by modifying it.
Read More: How to Combine Two Line Graphs in Excel
Method 2 – Overlay a Line Graph with a Column Chart
Steps:
- Select the whole dataset you want to plot (the range B4:E10).
- Go to the Insert tab on your ribbon.
- Select Recommended Charts from the Charts group.
- The Insert Chart box will open up.
- Select the All Charts tab.
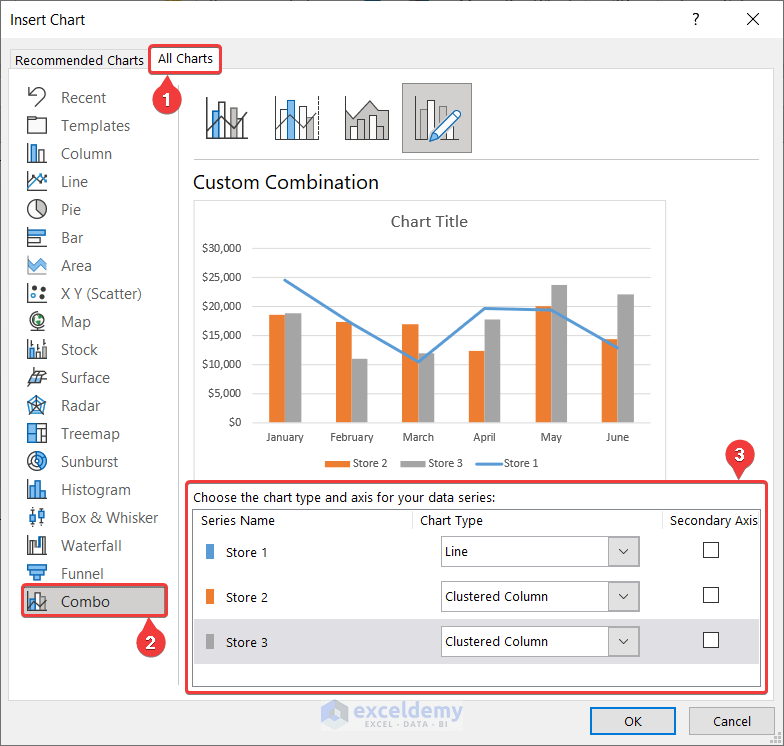
- Select Combo as the type from the left side of the box.
- Select the first series chart type as Line and select Clustered Column for the rest from the right. You can find these options in the drop-downs under the section labeled Choose the chart type and axis for your data series, as shown in the figure below.
- Click OK and a chart will appear on your Excel spreadsheet where line graphs will overlay with clustered columns.
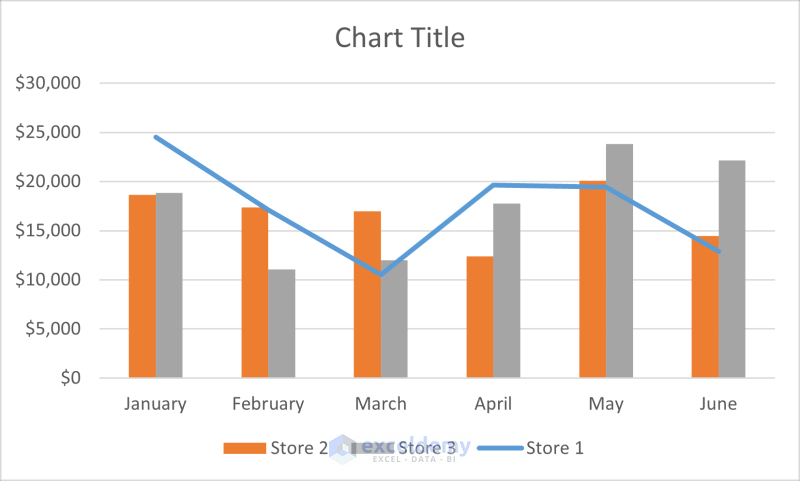
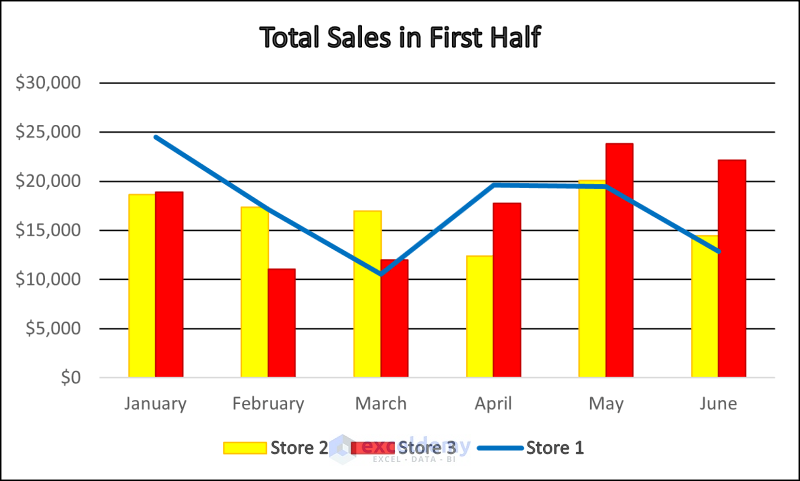
- Modify it to your liking.
Read More: How to Combine Bar and Line Graph in Excel
Method 3 – Overlay a Line Graph with a Scatter Chart
Steps:
- Select the range B4:E10 (the whole dataset we are plotting).
- Go to the Insert tab on your Excel ribbon.
- Select Recommended Charts from the Charts group.
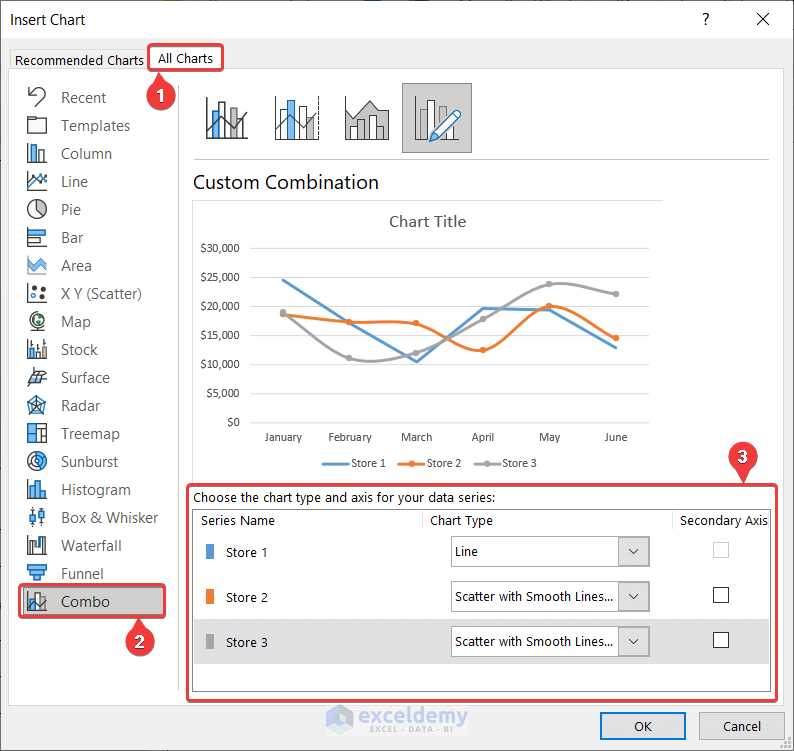
- The Insert Chart box will open up. Now go to the All Charts tab.
- Select Combo as the chart type from the left of the box.
- Select Line as the first chart’s type and Scatter with Smooth Lines and Markers as chart types of the other two. You can change these types from the drop-down menus beside each series under the sections labeled Choose the chart type and axis for your data series.
- Click on OK. A chart will now appear on top of the Excel spreadsheet, with line graphs overlaying scatter graphs.
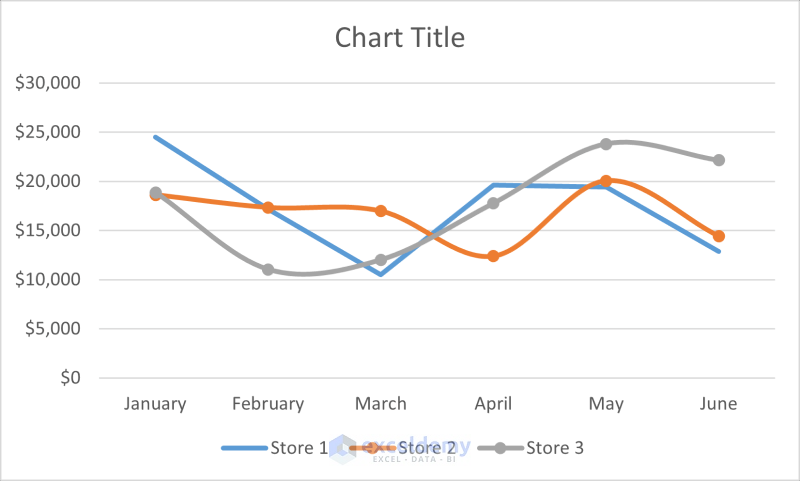
Here, the straight solid line with breaks represents the line graph, and the smooth lines represent the scatter graphs.
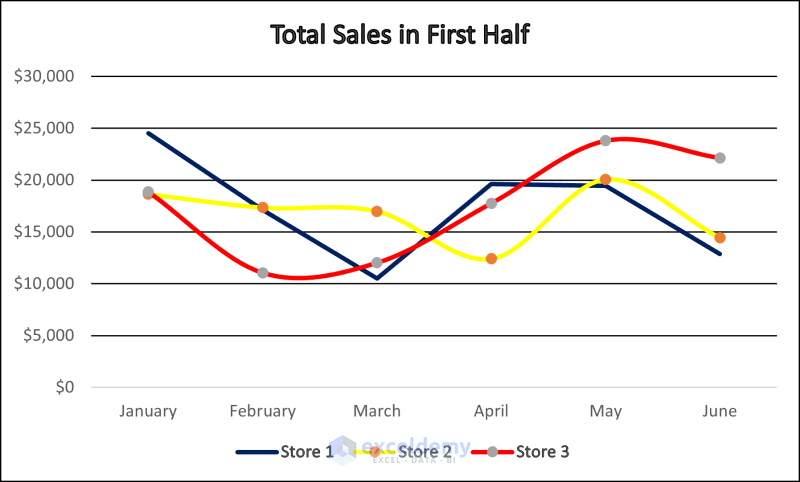
- Modify the graph to your liking.
Download the Practice Workbook
You can download the workbook to practice.
Related Articles
- How to Make a Double Line Graph in Excel
- How to Plot Multiple Lines in One Graph in Excel
- How to Edit a Line Graph in Excel
- How to Combine Two Bar Graphs in Excel
- Line Graph in Excel Not Working
<< Go Back To Line Graph in Excel | Excel Charts | Learn Excel
Get FREE Advanced Excel Exercises with Solutions!
