The sparklines are very important and handy tools of Excel if you need to show a data trend analysis. A dataset sparklines always appear as a group. By ungrouping sparklines, you can apply different sparklines for different data in the same dataset. In this article, we will show you the most possible ways of how to ungroup sparklines in Excel.
What Are Sparklines in Excel and How to Create Them?
In Excel, Sparklines are a type of small, data-dense chart to show trends and variations in data over time. They can be included in individual cells with the data they represent and are often used to give data tables visual interest and context.
Sparklines come in several types, including line, column, and win/loss charts. They are designed to be simple and easy to read, with a minimal amount of visual clutter or distracting elements. Despite their small size, sparklines can be a powerful tool for data analysis, allowing you to quickly identify patterns, trends, and outliers in your data.
Before going to group or ungroup sparklines, you must have a clear knowledge of how to add sparklines in Excel. You can easily add sparklines for your dataset by following this process.
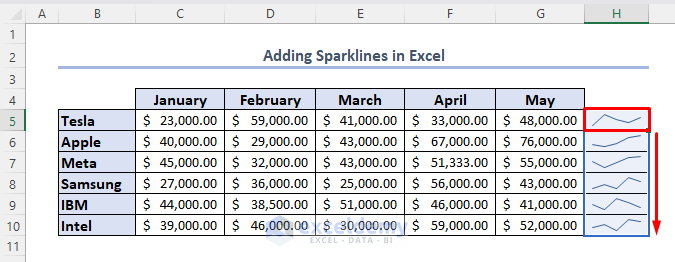
Here, we have a dataset containing the monthly sales for different companies.
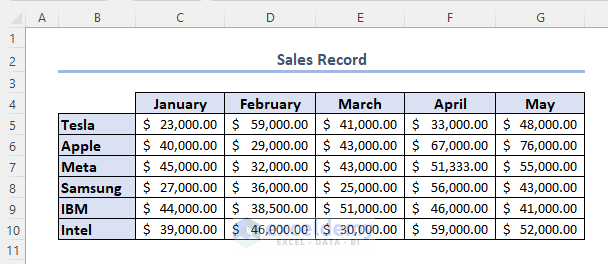
We want to see the monthly state of each company. So that we add sparklines in the dataset. To show the sparklines,
📌 Steps:
- In the beginning, select the row that sparklines you want to create. Here, we selected the range C5:G5.
- Go to the Insert tab and expand the Sparklines bar.
- Choose Line as the sparkline.
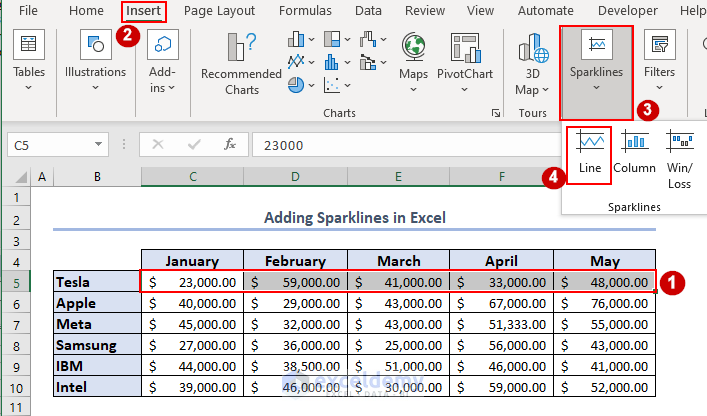
- The selected range C5:G5 is shown in the Data Range section.
- Choose the Location Range where you want to show the sparklines. Here, we input $H$5 as the location range and then click OK.

- You can find the sparkline added to the desired location.
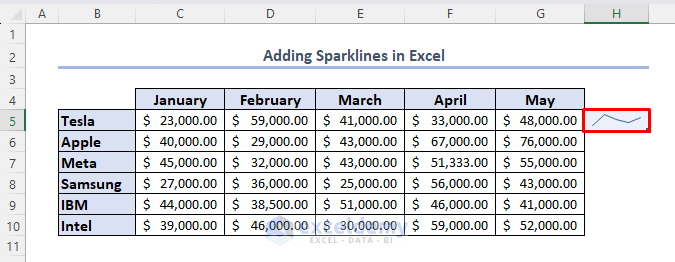
- Use the Fill Handle to insert the sparklines for the existing rows.
Read More: Types of Sparklines in Excel
How to Ungroup Sparklines in Excel: 3 Suitable Ways
If you want to show different types of sparklines in one dataset you have to ungroup the sparklines. Because the sparklines are by default presented as a group. You can ungroup the sparklines by using some easiest methods.
1. Use the Sparkline tab to Ungroup Sparklines in Excel
In Excel, by using the Sparkline tab you can simply ungroup the sparklines. To do so,
📌 Steps:
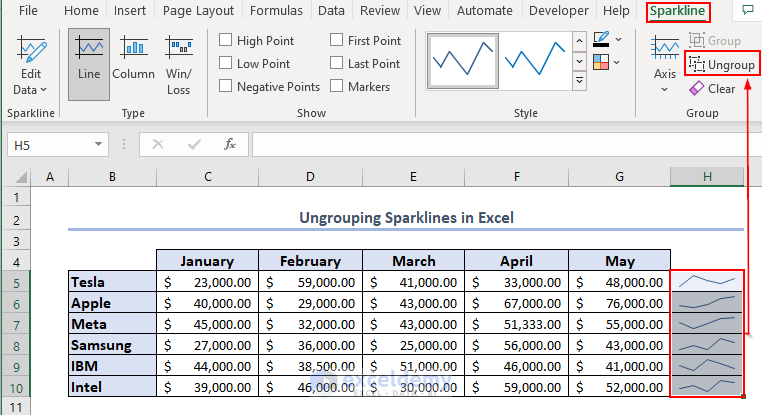
- Select the sparklines and go to the Sparklines menu bar at the top of the sheet.
- Select the Ungroup option from the menu.
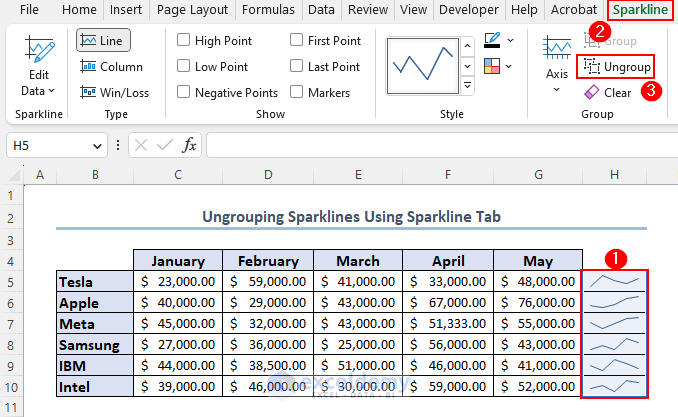
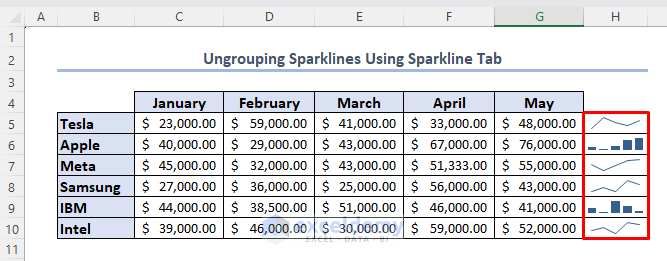
- Now you can add any type of sparklines in the same column according to your requirement.
Read More: How to Use Sparklines in Excel
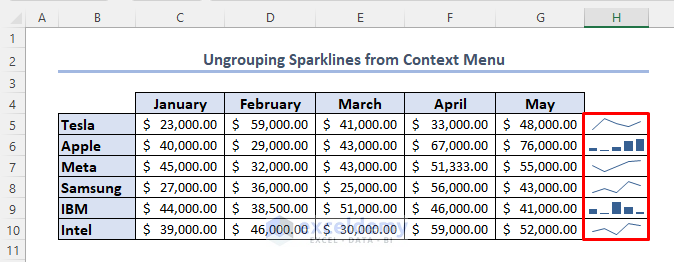
2. Ungroup Sparklines from Context Menu
In Excel, by clicking on the right key you can easily ungroup sparklines.
📌 Steps:
- Select the desired sparklines and click the right button on the mouse.
- You will find several options in the Context Menu. Among them expand the Sparkline option.
- Click on the Ungroup option.

- You can see the sparklines are ungrouped in the dataset.
3. Use VBA to Ungroup Sparklines
You can also use VBA code to ungroup sparklines. To do so, you have to develop a code and 📌 Steps:
- Select the sparklines.
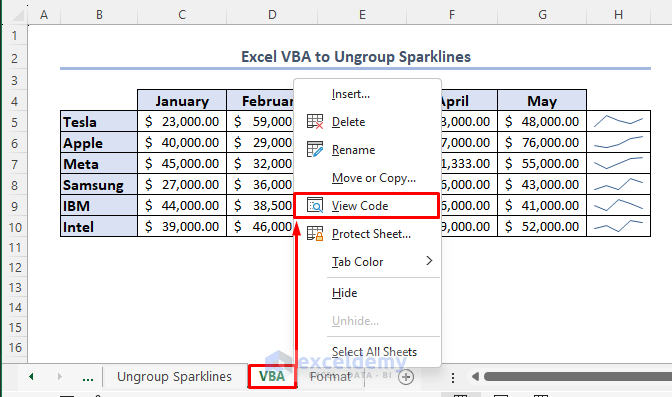
- Right-click on the VBA worksheet and select the View code option.
- Choose Insert tab >> Module option.
- Paste the below code into the module.
Sub Ungroup_Sparkline()
Dim ws As Worksheet
Dim sgs As SparklineGroups
Dim Rng As Range
Set ws = ThisWorkbook.Worksheets("VBA")
Set Rng = ws.Range("H5:H10")
Set sgs = Rng.SparklineGroups
Rng.SparklineGroups.Ungroup
End Sub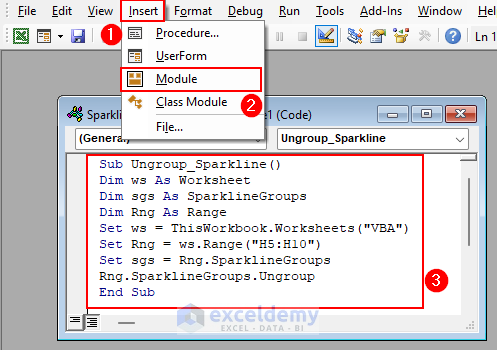
Code Breakdown:
- Dim ws As Worksheet, Dim sgs As SparklineGroups, Dim Rng As Range
These lines declare variables with type.
- Set ws = ThisWorkbook.Worksheets(“VBA”), Set Rng = ws.Range(“H5:H10”),Set sgs = Rng.SparklineGroups
Here, the ws variable value is the “VBA” worksheet. RangeH5:H10 is set as the value for the Rng variable. Finally, the sgs variable takes the sparklines present in range H5:H10 as its value.
- Rng.SparklineGroups.Ungroup
This line simply ungroups the previously grouped sparklines.
- Click on the F5 button or Run option and you will find the sparklines will be ungrouped.
- Finally, You will find the ungroup sparklines in the desired dataset.

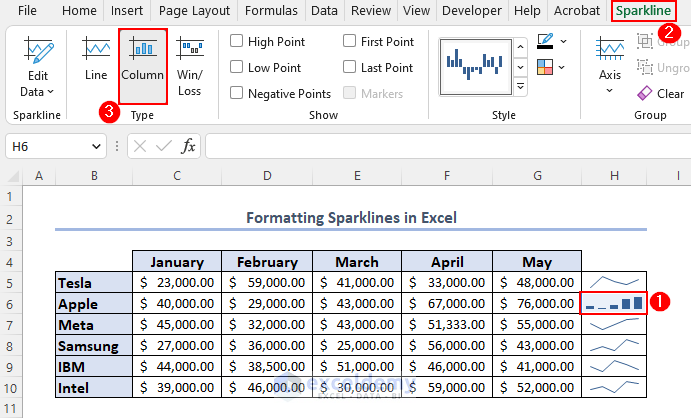
How to Format Sparklines in Excel
You can also format a sparkline as per your requirement. You can change the color of your sparkline, add markers to it, change the styles, input the axis, and many more changes. For this,
📌 Steps:
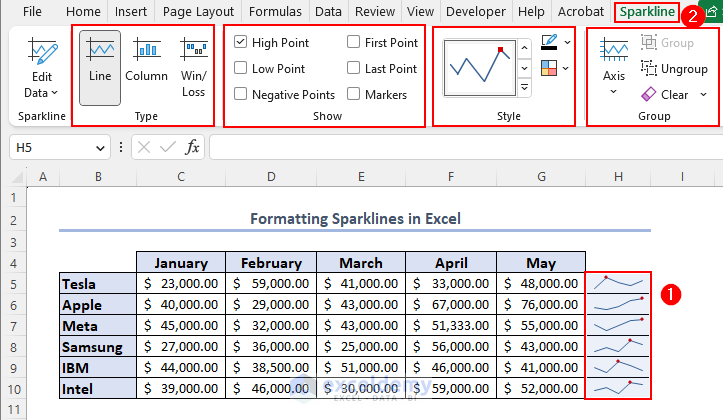
- Select the sparkline in the dataset then find the Sparklines heading in the top corner of the menu.
- Now you can find several options to format the sparklines. You can add different types of sparklines. Here we add the line sparklines.
- You can show the higher or lower points. Here, we check on the High point to make you better understand.
There are also options to change the sparkline style and color. You can also input the axis or clear it from the list.
How to Delete Sparklines in Excel
Sometimes we want to delete or clear the sparklines from the dataset. But you can not simply delete the sparklines by clicking the Delete button.
- To delete the sparklines from the list, just go to the Sparklines menu and expand the Clear option.
- Choose any one option from them as per your requirement and delete the sparkline or group of sparklines.
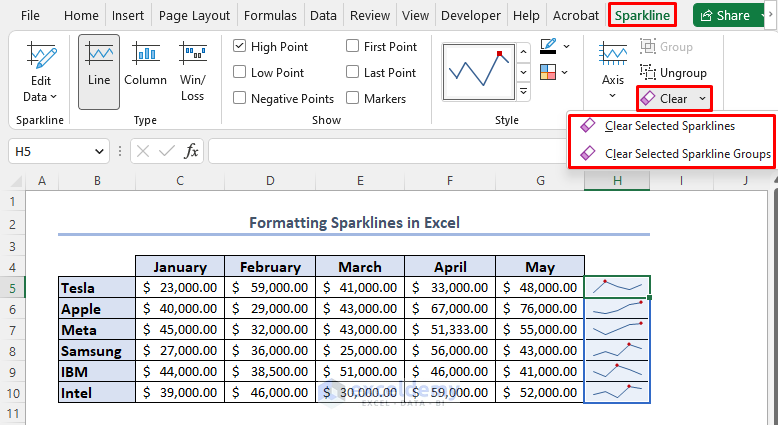
You will get both options to delete selected sparklines or if you want you can delete the entire group of sparklines.
Frequently Asked Questions
1. Can we change Sparkline layout in Excel?
Yes, we can modify Sparklines’ Excel layout to suit your needs.
- You may access Excel’s various sparkline layout options from the tab labeled Sparkline on the Excel ribbon.
- Click on the Type button to open the drop-down menu of sparkline types.
- Select a new sparkline type that has the layout you want. You can choose from Line, Column, Win/loss, or a combination of these.
You can further customize the layout of the sparklines by using the options in the Style and Group groups on the Sparkline tab. By changing the layout of sparklines, you can better visualize the trends and patterns in your data.
2. How can I use Sparklines effectively in Excel?
To use Sparklines effectively in Excel, it’s important to choose the right type of Sparkline for your data and to format them in a way that makes them easy to read and understand. You should also use Sparklines sparingly and only include them in your data analysis when they add value and context to the information being presented.
3. How do I group sparklines in Excel?
You can group sparklines in Excel using the Sparkline Group feature. Grouping sparklines can make it easier to manage and analyze multiple sparklines that are related to each other.
- Once you have created all the sparklines, you can group them together by selecting them all.
- Clicking on the Group button in the Sparklines group on the Sparklines Tab in the Excel ribbon.
You can also right-click on any of the sparklines and choose Group from the context menu. The sparklines will now be grouped together and can be managed as a single entity.
Key Takeaways from This Article
After Completing this article,
- You will be able to ungroup sparklines in Excel.
- You have gathered knowledge of how to add sparklines.
- Learn in detail about the formatting of sparklines.
- Know the group or ungroup process of sparklines.
Download Practice Workbook
You can download the spreadsheet and practice by yourself.
Conclusion
This article will help you to learn how to ungroup sparklines in Excel as well as its adding and grouping process. You can also develop your VBA knowledge through this article. If you have any queries feel free to comment.
Related Articles
<< Go Back to Excel Sparklines | Learn Excel
Get FREE Advanced Excel Exercises with Solutions!
