Latest Posts From Annyca Tabassum

In this article, you will learn about the Excel pareto chart and how to add this chart in Excel. You can also gain knowledge of cumulative percentage, ...

This is an overview. Download Practice Workbook Download the practice workbook. Show Gridlines in Excel.xlsx Method 1 - Show the ...

In this article, you will learn anchoring in Excel which includes how to add anchors in Excel by applying a keyboard shortcut and inserting Dollar Sign ($). ...

Nested formulas contain one or more functions as parameters or arguments within another function. Download Practice Workbook Download the ...

In this article, you will learn how to change case in Excel in detail. You will get to know about formulas based on different functions to change case into ...
This is an overview. Download Practice Workbook Download the workbook and practice. Indentation in Excel.xlsx Method 1 - Indent ...
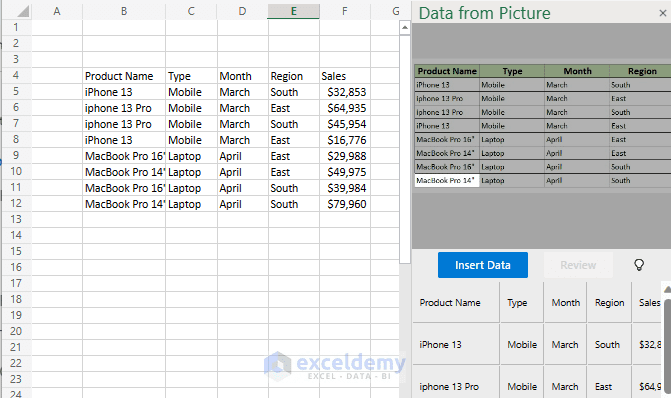
We will add a table from the below image for the methods below. Method 1 – Using an Image Saved in File Explorer Steps: Select a cell of the ...
Excel slicer is a vital tool that gives users easy access to data filtering and interaction. Slicers are often shown vertically, however, a horizontal ...

Method 1 - Excel Slicer with Multiple Columns Find all the columns in the Excel slicer in a single column. You can see the below image. Sometimes there ...
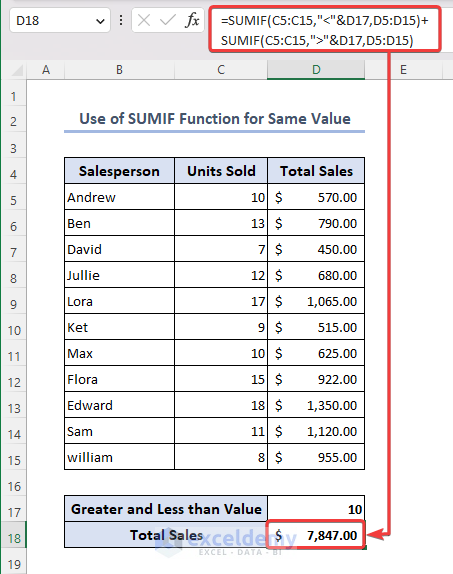
Method 1 - Sum If Greater Than and Less Than from Same Value 1.1 Applying SUMIF Function for Greater Than and Less Than from Same Value You have to apply the ...

In this tutorial, we will guide you through the step-by-step process of how to make graph paper in Excel. Microsoft Excel provides the flexibility to create ...

The sparklines are very important and handy tools of Excel if you need to show a data trend analysis. A dataset sparklines always appear as a group. By ...
See Our Reviews at


Dear KRISHNA KANT,
Thank you for giving your time to read this article. You want to know the formula to calculate the ranks and denote “Fail” if a student is absent in any of the exams. Read the following section for details.
Assuming the given data is placed in columns B to G, and the student rank will be shown in column H.
In cell H5, enter the following formula:
=IF(COUNTIF(C5:F5,"Absent")>0, "Fail",RANK(G5,$G$5:$G$10,0))Drag the formula down to apply it to the rest of the cells in column H.
The overall formula checks if there are any cells with the value “Absent” in range C5:F5. If there exists, it returns “Fail“. Otherwise, it calculates the rank of the value in G5 within the range G5:G10 in ascending order.
The student’s total score and rank are displayed in column G, and column H respectively. If a student is “Absent” in any of the exams, their rank will be denoted as “Fail.”
If you have any more queries, please let us know in the comments.
Regards
Annyca Tabassum
Team ExcelDemy