Sparklines are a powerful feature in Excel that allows you to display miniature charts within a single cell, making it easier to visualize trends and patterns in your dataset. However, there may be instances when you want to remove sparklines from your Excel worksheet to clean up your data or make room for other information. Removing sparklines from Excel is a simple process that can be done in just a few steps. Whether you are working with a small or large data set, it is important to know how to manage sparklines in Excel effectively. In this article, we will walk you through the simple steps to remove sparklines in Excel.
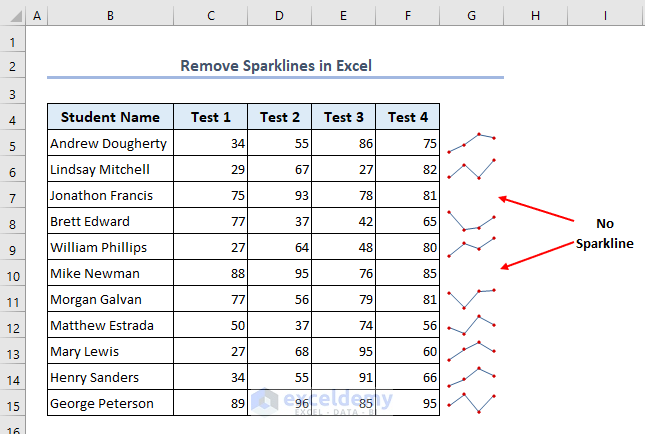
Before jumping into the main discussion, let’s see an overview of how to remove sparklines in Excel in the following image.
What Are Sparklines in Excel?
Sparklines are small, concise charts that offer a visual representation of data trends or patterns within a larger data set. These miniature charts can be added to individual cells in Excel and are usually used alongside other data to provide a more complete understanding of the data.
There are three types of sparklines: line sparklines, column sparklines, and win/loss sparklines. Sparklines are a valuable tool for quickly visualizing data in a clear and concise manner.
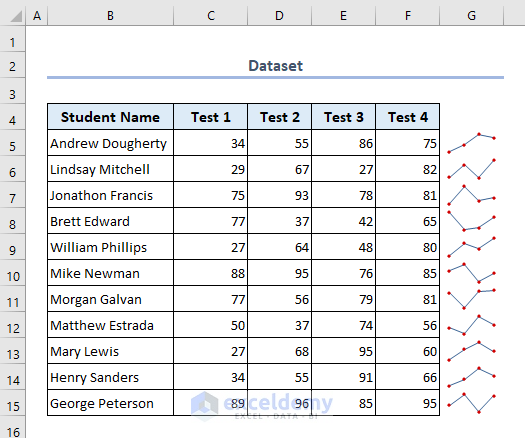
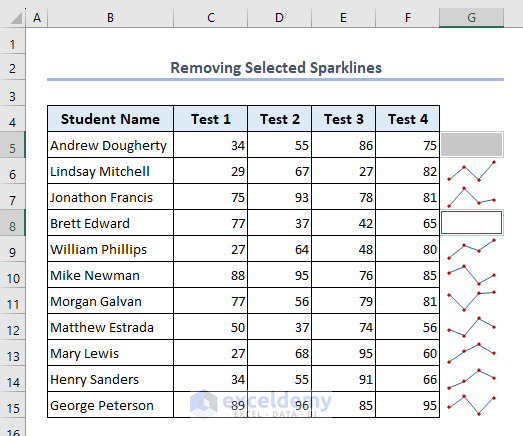
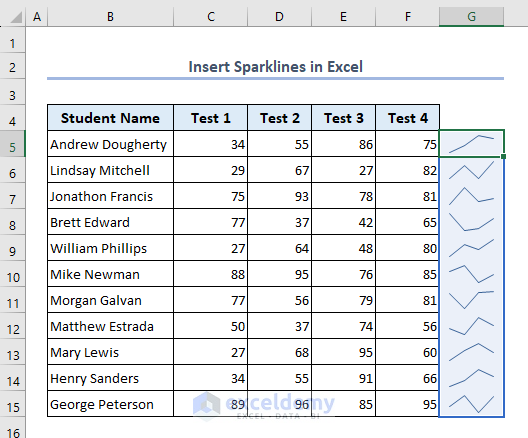
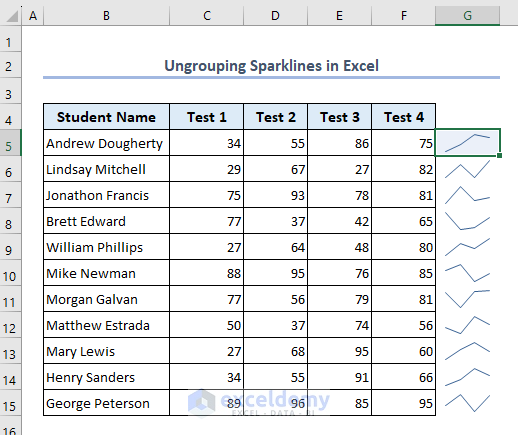
Consider the following dataset. The dataset has some Test Marks of different students in different tests. We have created sparklines to show the progress of students in different tests.
How to Remove Sparklines in Excel: 2 Quick Ways
You can not remove a sparkline in Excel by using the Delete key on your keyboard. You have to follow some simple steps to remove sparklines in Excel. We will now attempt to delete the sparklines from the dataset we have shown above.
1. Removing Selected Sparklines
In this method, we will remove only selected sparklines in Excel. Let’s see how you can do that.
- Select the cells containing the sparklines that you want to remove.
- Go to the Sparkline tab in the ribbon.
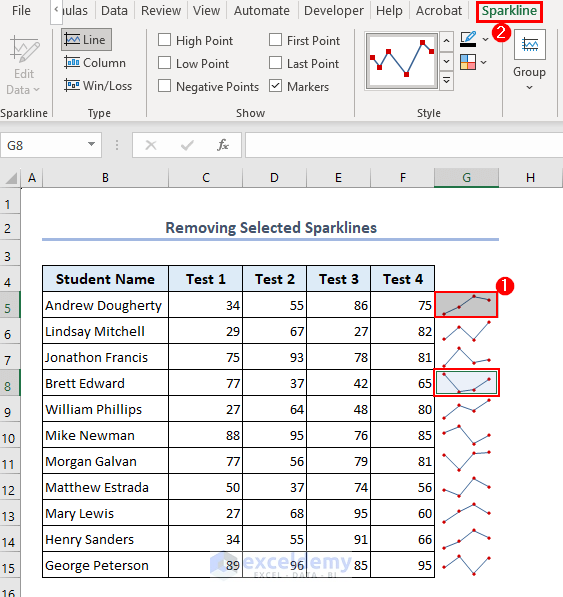
- Click on the Clear button from the menu and select Clear Selected Sparklines from the drop-down menu.
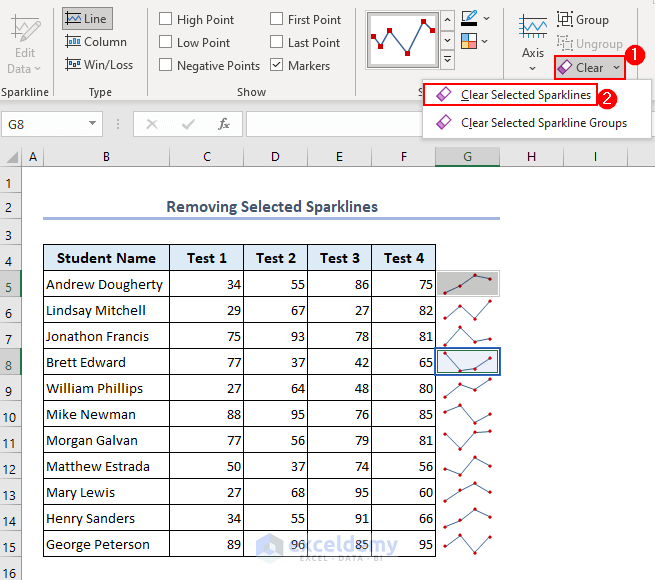
- The selected sparklines are removed.
2. Removing Sparklines Group
Here, we will remove grouped Sparklines at once.
- Select any cell containing a sparkline from the sparklines group.
- Go to the Sparkline tab in the ribbon.
- Click on the Clear button from the menu.
- Finally, select Clear Selected Sparkline Groups from the drop-down menu.
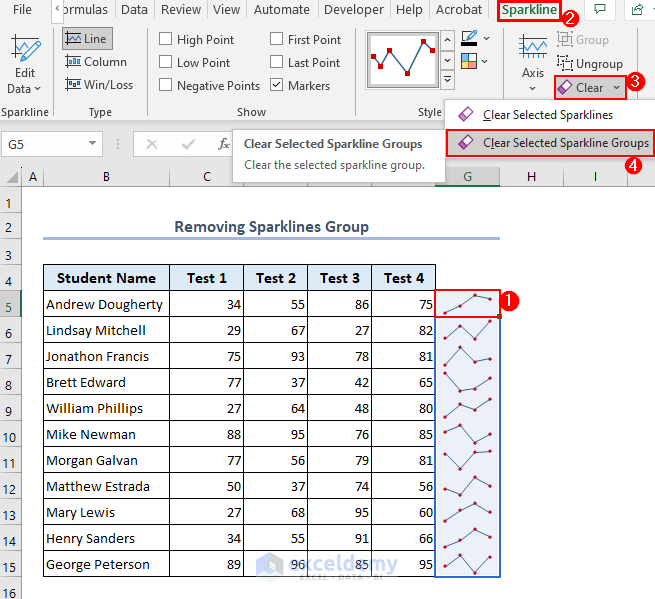
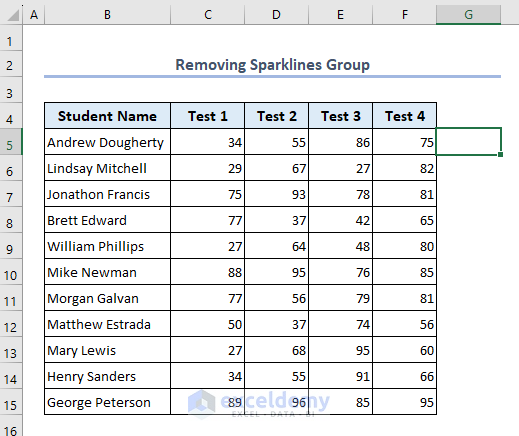
- The sparklines group is removed.
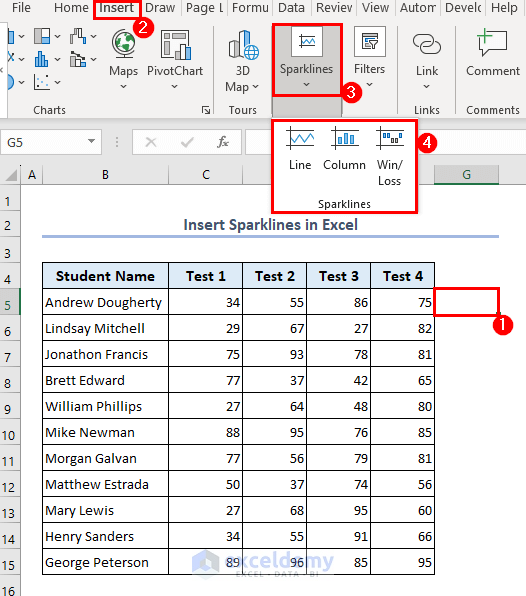
How to Insert Sparklines in Excel
In this section, you will learn how to create sparklines in Excel.
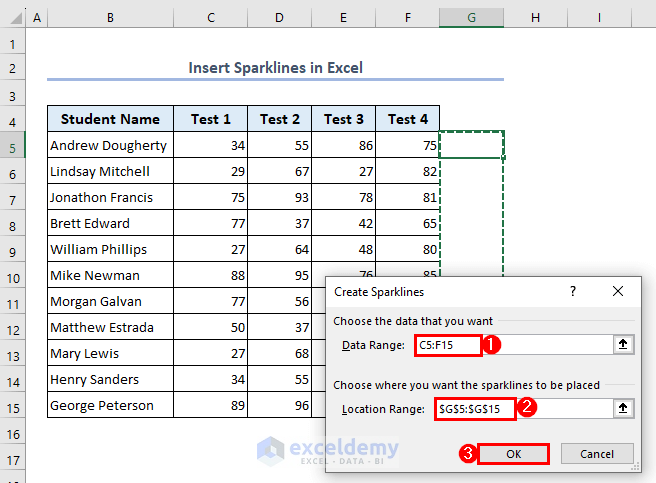
- Select the cell where you want to insert the sparkline and go to the Insert tab in the ribbon.
- Select the type of sparkline you want from the three options available from the Sparklines group.
- You will see a popup window appear.
- Input the data range that you want to use for the sparklines in the Data Range field.
- Specify the cells where you want to display the sparklines in the Location Range field then click on OK.
- You will see that you have inserted the sparklines.
Read More: Types of Sparklines in Excel
How to Group/Ungroup Sparklines in Excel
You may need to group/ungroup sparklines to manage the sparklines more efficiently and easily.
Grouping Sparklines:
- Select the cells containing the sparklines that you want to group.
- Go to the Sparkline tab in the ribbon and click on Group in the Group section.
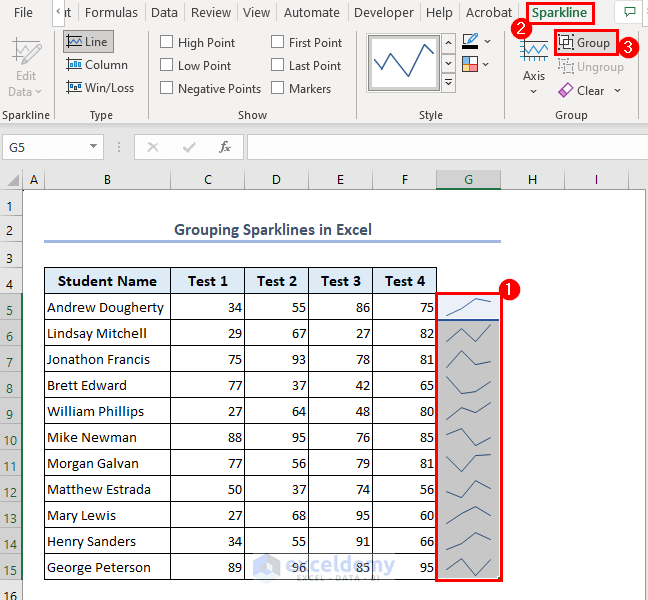
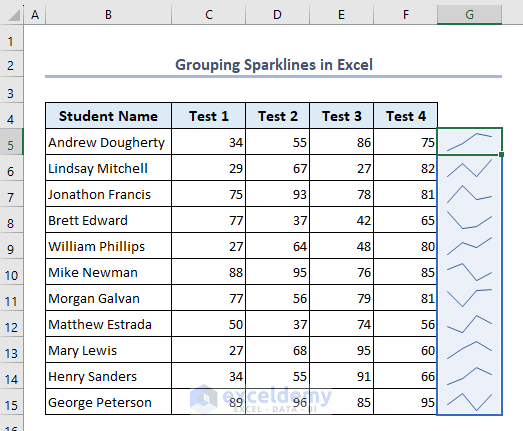
- The selected sparklines are now grouped.
Ungrouping Sparklines:
- If you want to ungroup your sparklines, first, click on the sparklines group that you want to ungroup.
- Go to the Sparkline tab in the ribbon and click on Ungroup in the Group section.
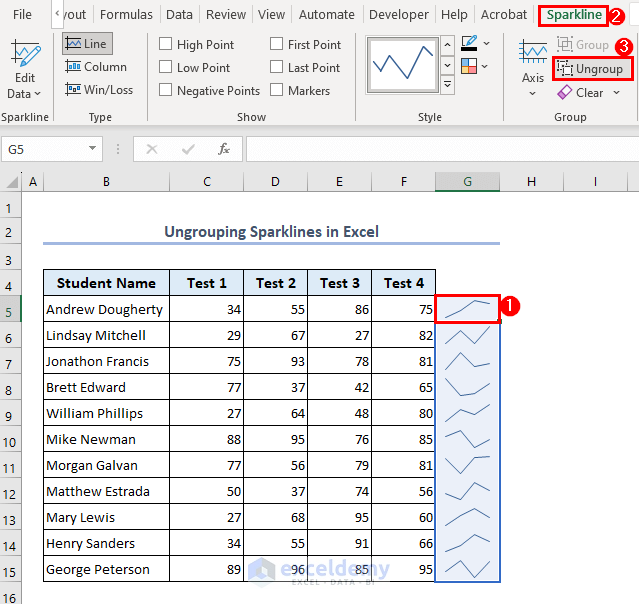
- The sparklines are now ungrouped.
Note:
If the Sparklines are grouped, clicking on the Clear button in the Sparkline tab in the ribbon will remove the whole Sparkline group. If they are not grouped, clicking on the Clear button will remove the sparklines one by one.
How to Customize Sparklines in Excel
You can customize the sparklines in Excel to effectively communicate the trends and patterns that exist within your data. You can change the colors of your sparklines or modify your sparkline’s style, or axis of the sparkline for better visualization of your data. You can even mark important points of your sparklines. Here’s how to customize sparklines in Excel:
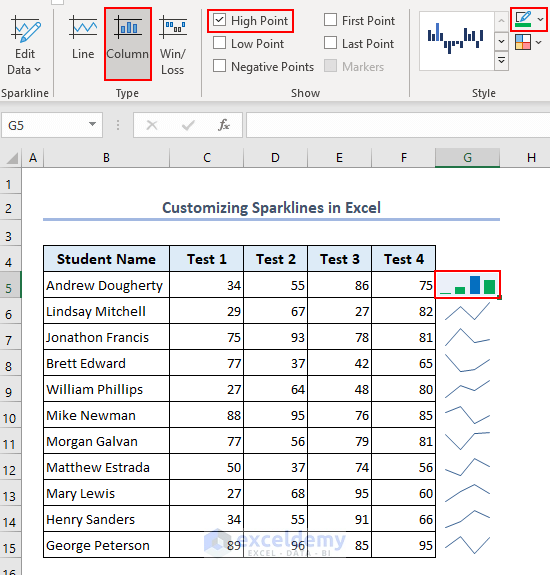
- Select the cell you want to customize and go to the Sparkline tab in the ribbon.
- You can change the chart type from the Type group.
- To show markers, you can check the required markers in the Show group.
- Go to the Style group and select the required color for the sparkline as well as markers to change the appearance of the sparklines.
- We selected a Column graph for chart type, High Point for markers, Green color for Sparkline Color, and Blue color for High Point Marker color for the sparkline in cell G5.
You can follow the same procedures to customize the other sparklines.
Download Practice Workbook
You can download the spreadsheet and practice the methods by working on it.
Conclusion
In this article, we have shown you the process of removing sparklines in Excel. Removing sparklines is a straightforward process that you can accomplish in just a few steps. Whether you want to delete a single sparkline or a group of sparklines, there are several ways to choose from depending on your specific needs. By following the steps outlined in this article, you can easily remove sparklines from your Excel worksheet and keep your data visually appealing, organized, and up-to-date.
We hope that you find this article useful for removing sparklines in Excel. If you have any queries, feel free to leave a comment below.
Related Contents
<< Go Back to Excel Sparklines | Learn Excel
Get FREE Advanced Excel Exercises with Solutions!
