Overview of Sparklines
Sparklines show data patterns in a single cell in Excel. There are 3 types:
- Line sparklines
- Column sparklines
- Win/Loss sparklines
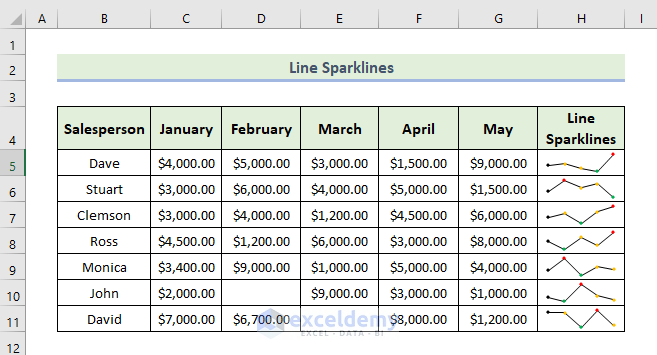
Line Sparklines: Line sparklines are similar to line charts, and they can be used to show trends in monthly sales data. The principles governing line charts are similar to those governing line sparklines.
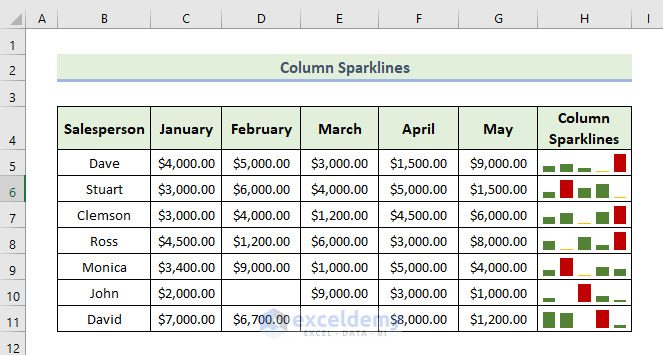
Column Sparklines: They are effectively miniature column charts.
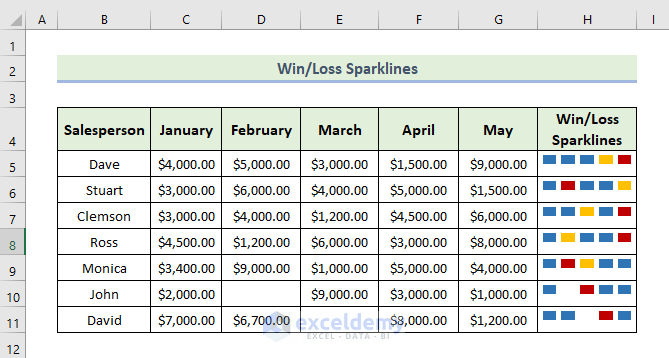
Win/Loss Sparklines: A win/loss sparkline shows or categorizes each data point as either a win or a loss. This type of sparkline shows a stark contrast between win and loss points.
Sparklines are usually positioned in most spreadsheets near or right next to their data sources, as an additional visual cue. You can create a single sparkline based on a column or row or multiple sparklines for a larger number of variables.
Common Uses of Sparklines
- Temperatures or monthly sales data can be visualized
- Compacts data
- Data reports for shorter time periods
- Trend analysis
- Quick glance at the highs and lows of a trend
How to Change the Sparkline Color in Excel with Detailed Steps
Step 1 – Insert Sparklines in Excel
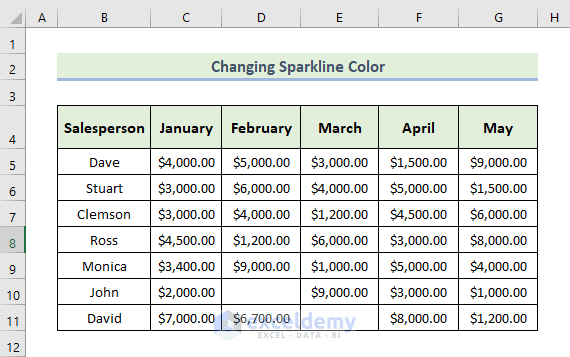
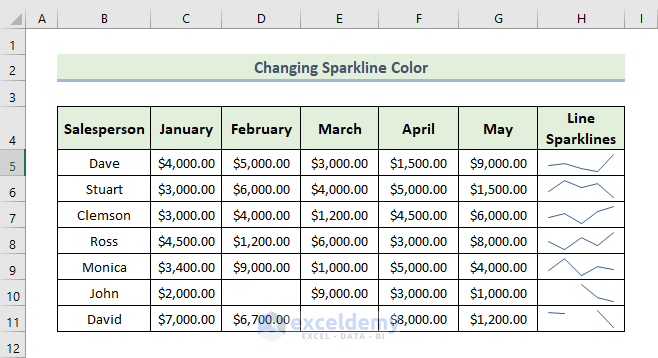
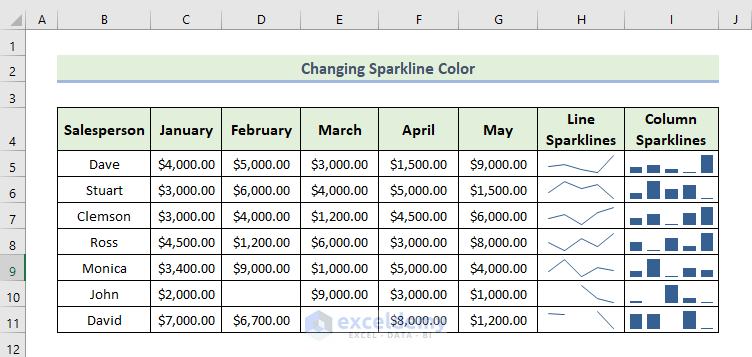
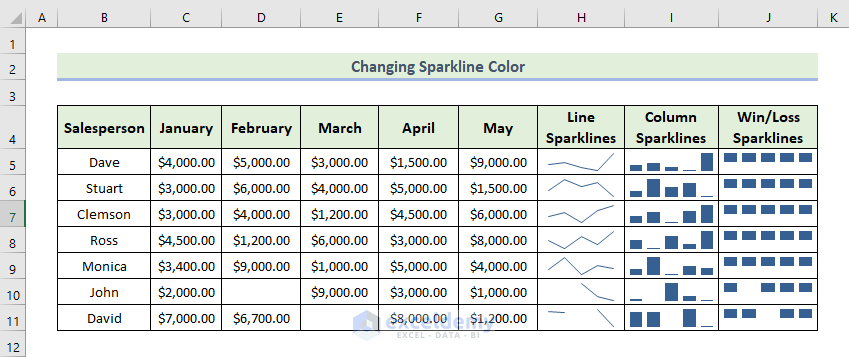
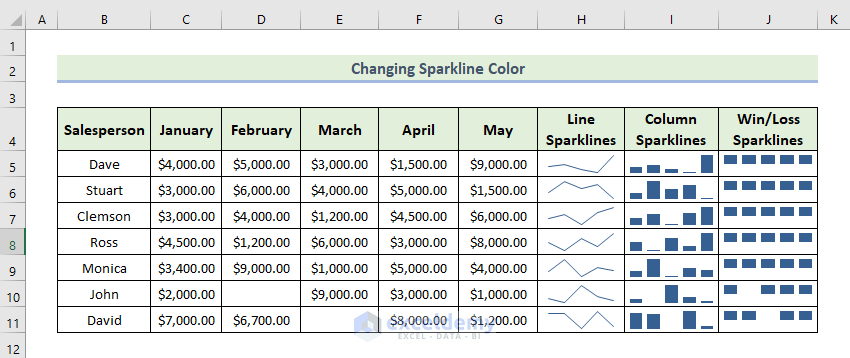
We’re using a sample dataset that contains monthly sales of some salespeople, where there are two values missing.
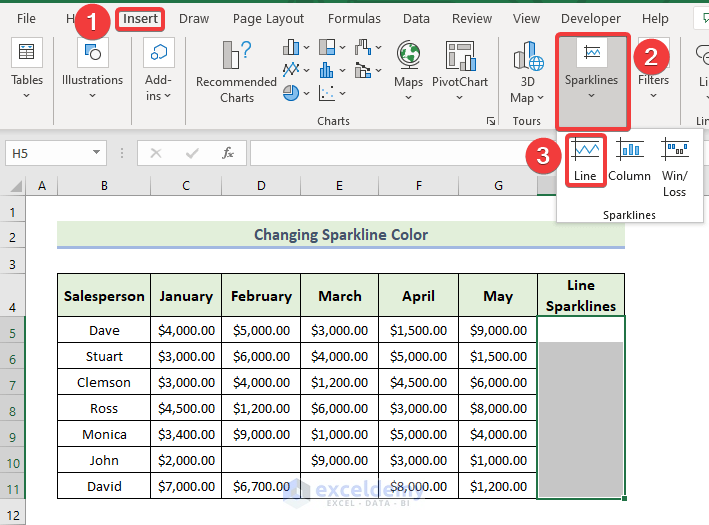
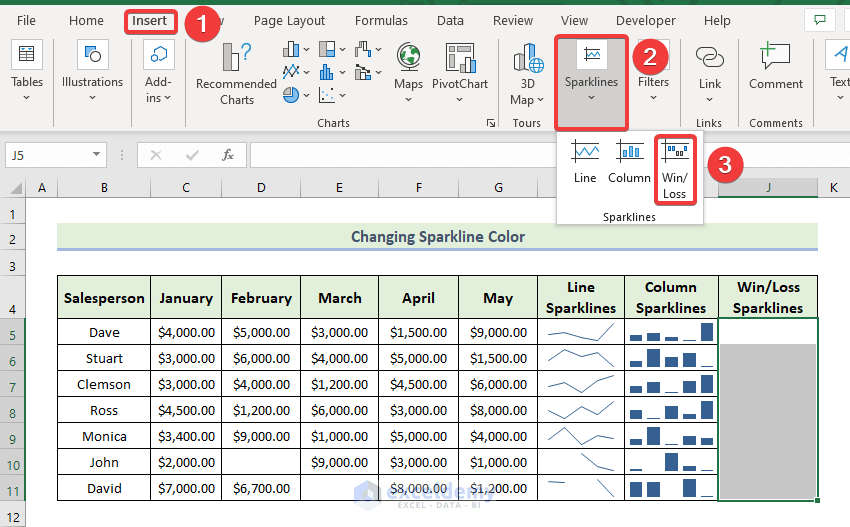
- Select the range of cells where you want to insert a sparkline and go to the Insert tab.
- Select Sparklines and, from the drop-down menu, select the Line option.
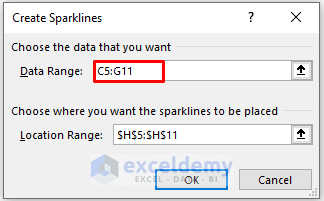
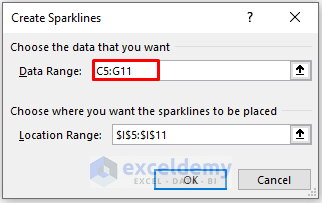
- When the Create Sparklines dialog box appears, select the range of cells in the Data Range that you want to insert into Sparklines. This should be auto-selected if you selected the range beforehand.
- Recheck the Location Range to ensure that the sparklines will be placed next to the dataset.
- Click on OK.
- You will get the following line sparklines. The lines break for the rows that contain blank values.
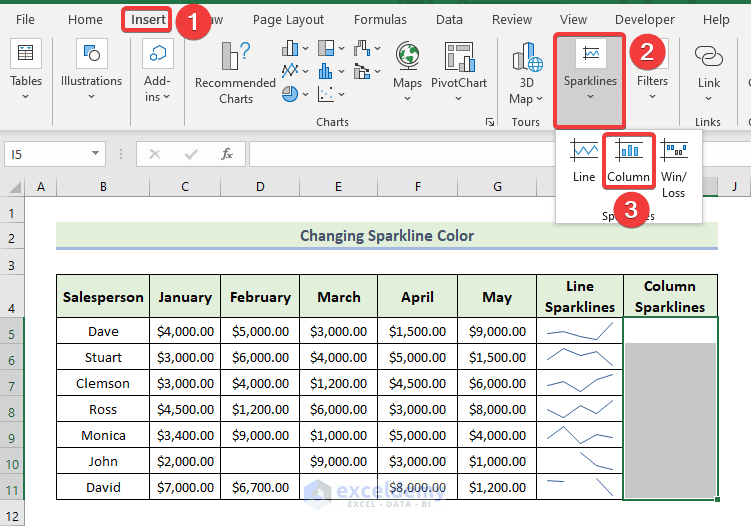
- Insert a Column Sparkline for the dataset using the same process, selecting the Column option in the Sparklines group.
- When the Create Sparklines dialog box appears, select the range of cells in the Data Range that you want to insert into Sparklines.
- Make sure that the sparklines are put in a different location range from the first ones.
- Click on OK.
- You will get the following column sparklines.
- Insert Win/Loss Sparklines for the range as well.
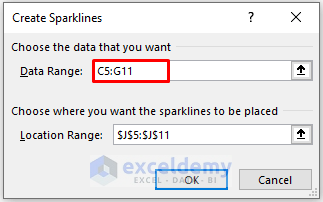
- Select the range of cells in the Data Range that you want to insert into Sparklines.
- Recheck the location range.
- Click on OK.
- You will get the following Win/Loss sparklines. There are no loss indicators for this sparkline yet.
Step 2 – Show Empty or Zero Values
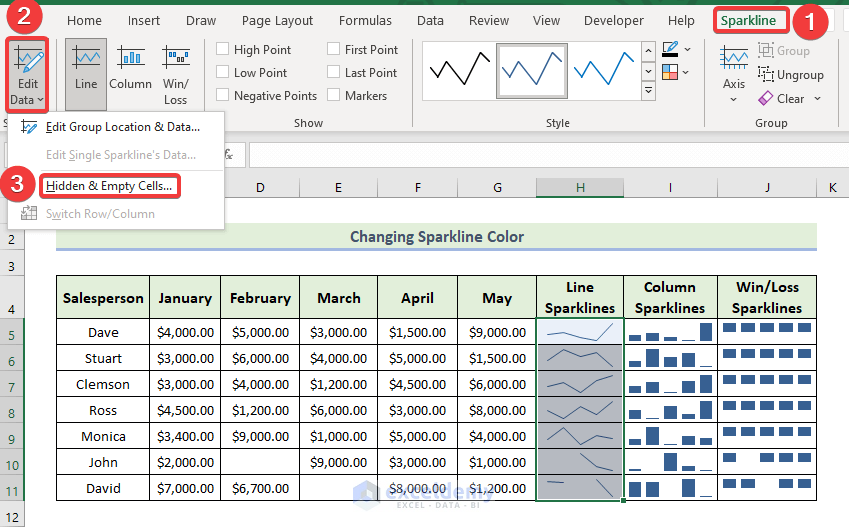
- Select the line sparklines, then go to the Sparkline tab and select Edit Data.
- Select the Hidden & Empty Cells option from the drop-down menu.
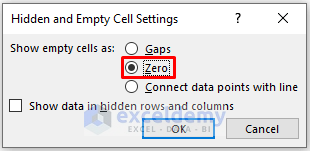
- When the Hidden and Empty Cell Settings window appears, click on Zero to Show empty cells as a box.
- Click on OK.
- This shows zero values in line sparklines as shown below.
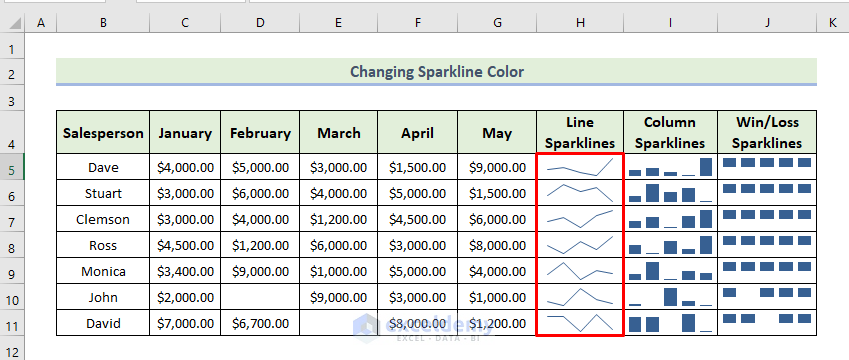
- Follow the same process for the other two types of sparklines.
Step 3 – Change the Sparkline Style and Line Width
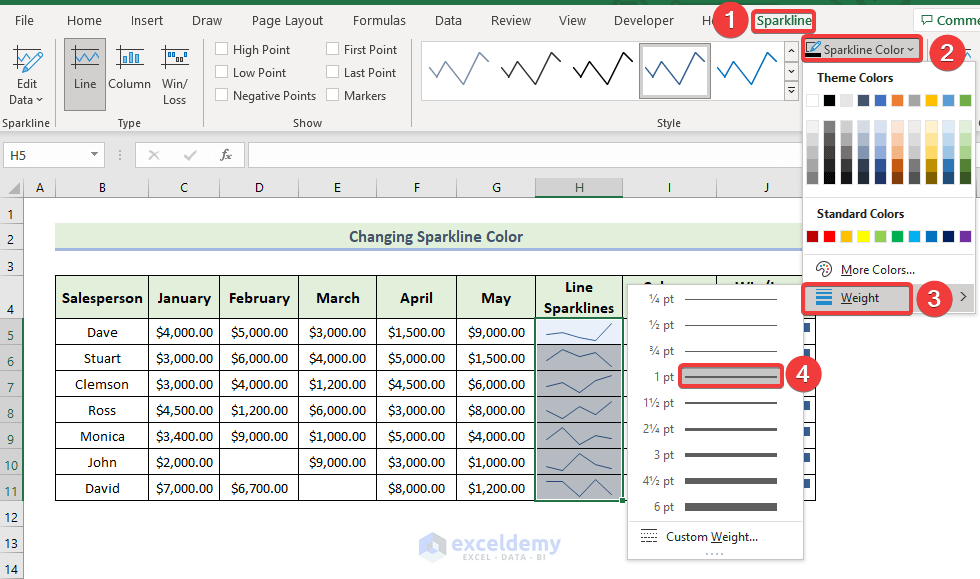
- Select the line sparklines and go to the Sparkline tab.
- Select Sparkline Color.
- From the drop-down menu, select the Weight option and choose your desired line width as shown below.
- If you want to change the sparkline styles, go to the Sparkline tab and select a style from the group.
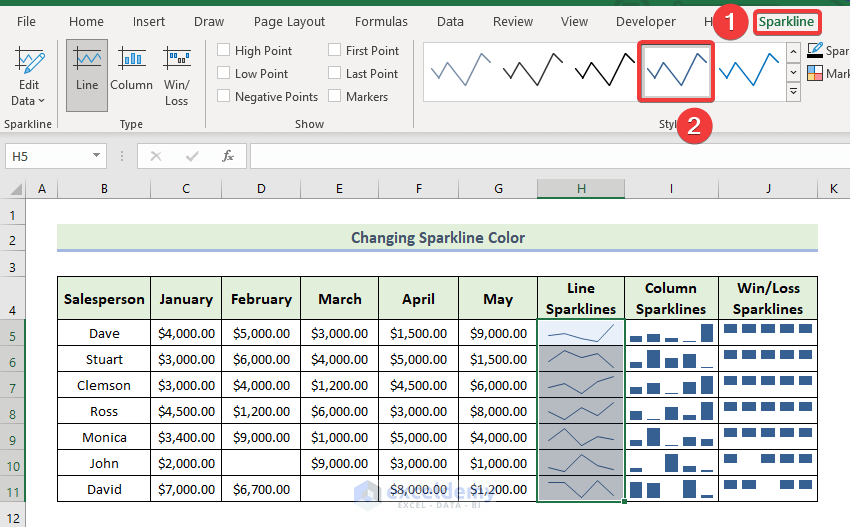
- You can change the Column Sparklines and Win/Loss Sparklines style by following the same process.
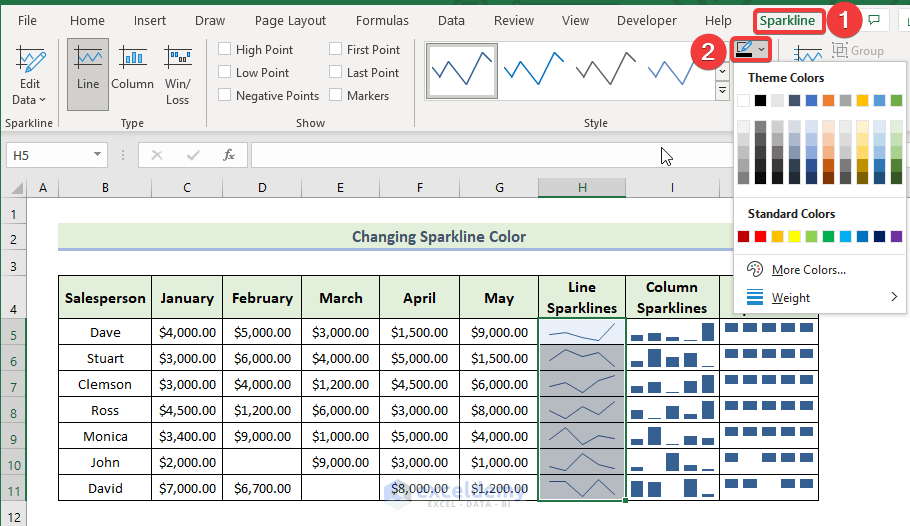
Step 4 – Change the Sparkline Color
- Select the line sparklines and go to the Sparkline tab.
- Select Sparkline Color.
- Select your desired color.
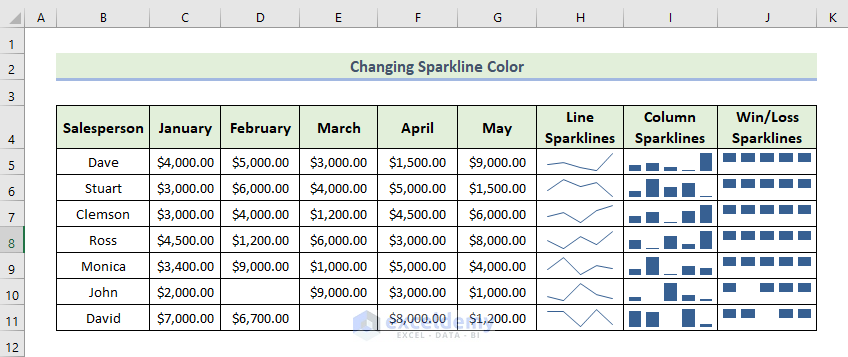
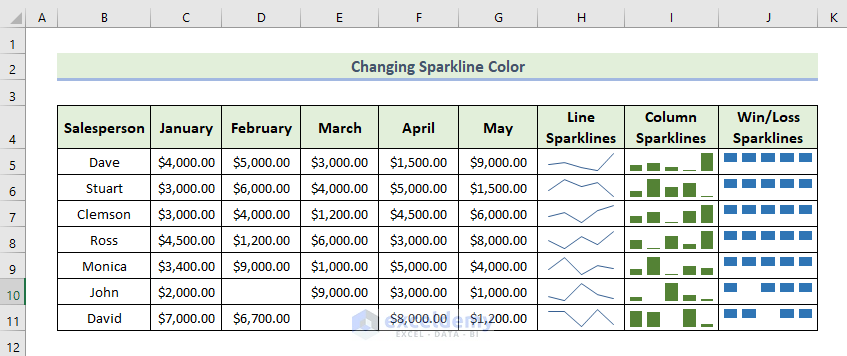
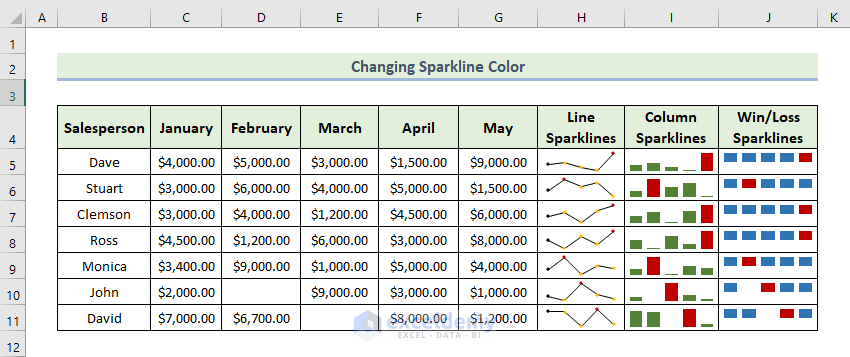
- Following the same procedure, you can change the Column Sparklines and Win/Loss Sparklines colors.
- We changed the column colors to green and win/loss sparklines to a lighter blue.
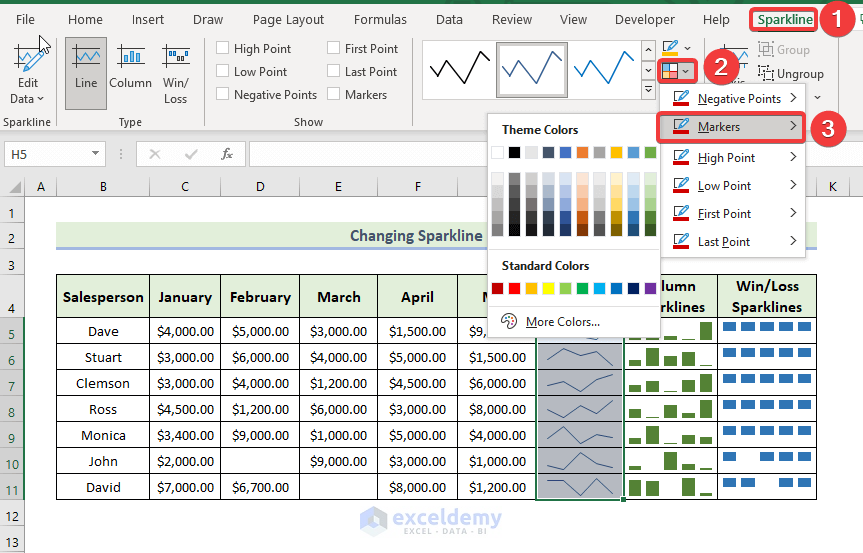
Step 5 – Change the Marker Colors
- Select the line sparklines and go to the Sparkline tab.
- Select Marker Color.
- From the drop-down menu, select Markers and choose your desired color.
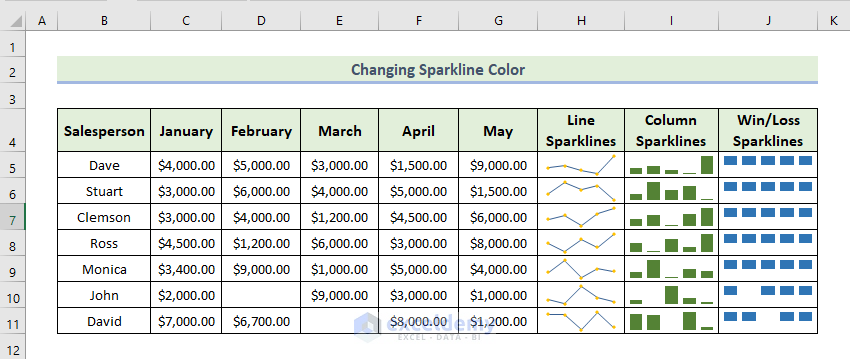
- You will get the following image showing point markers in line sparklines.
- We want to show the highest point in the sparklines.
- Select all sparklines and go to the Sparkline tab.
- Select Marker Color.
- From the drop-down menu, select High Point and choose your desired color.
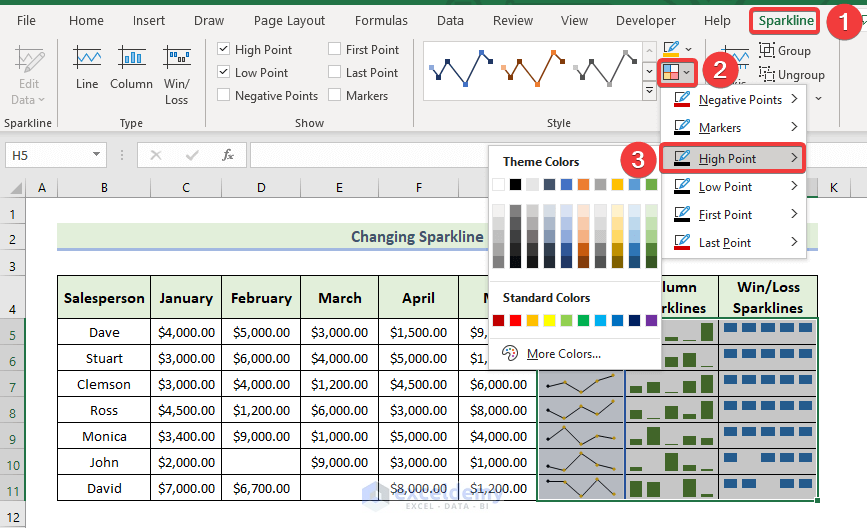
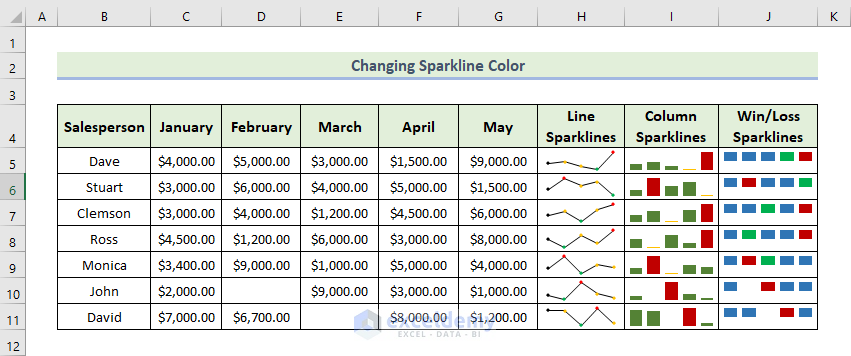
- You will get the following image where the highest point is highlighted as red for every type of sparkline.
- We want to show the lowest point in the sparklines.
- Select all sparklines and go to the Sparkline tab.
- Select Marker Color.
- From the drop-down menu, select Lowest Point and choose your desired color.
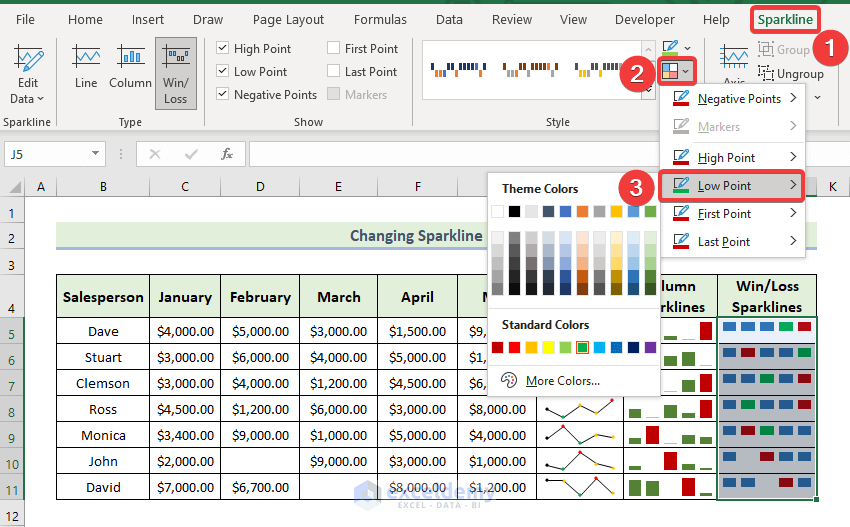
- We chose the lowest point to be highlighted as green for Line Sparklines and Win/Loss Sparklines and yellow for Column Sparklines. You can choose your own colors.
Read More: How to Add Markers to Sparklines in Excel
Download the Practice Workbook
Related Articles
- [Solved]: Excel Sparklines Location Reference Is Not Valid
- Sparklines Are Not Showing in Excel
- How to Ungroup Sparklines in Excel
<< Go Back to Excel Sparklines | Learn Excel
Get FREE Advanced Excel Exercises with Solutions!
