Skewness is a basic statistical concept. Sometimes, you may need to calculate the skewness in Excel. So, if you are looking for how to calculate the skewness in Excel then you have come to the right place. Today, I will demonstrate how to calculate the skewness in Excel.
Furthermore, for conducting the session, I will use the Microsoft 365 version.
What Is Skewness in Statistics?
The skewness of an ideal symmetric probability distribution, also known as the poison distribution curve, is its asymmetry. It is a fundamental statistical concept. The skewness of the poison’s distribution curve, also known as the normal distribution, is 0. This means that the normal distribution curve is symmetrical.
Despite the fact that no practical probability distribution is perfectly symmetrical. They do, however, have a skewness that is close to zero.
Any deviation from the normal distribution has some skewness values.
Here, I will describe 2 suitable methods to calculate skewness in Excel. Also, for your better understanding, I’m going to use sample data that has 2 columns. Those are the Student’s Name and Mathematics Score. The dataset is given below.

1. Using Excel SKEW Function to Compute Skewness
You can use a built-in Excel function to calculate the skewness in Excel. Which is known as the SKEW function. Furthermore, this is the easiest and simplest way to find out the skewness in Excel. Now, let’s follow the steps.
Steps:
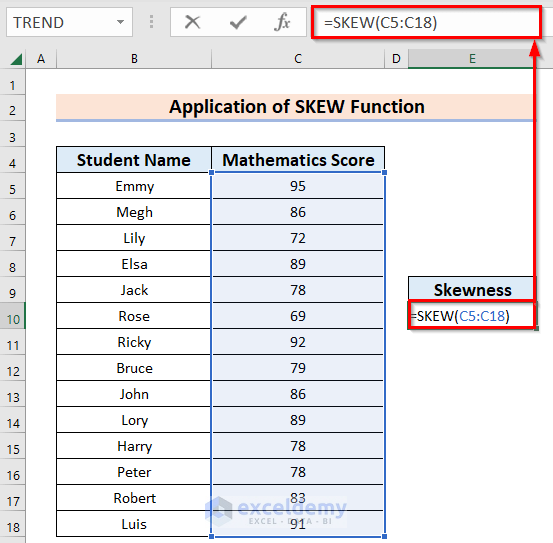
- Firstly, you must select a new cell E10 where you want to keep the skewness.
- Secondly, you should use the formula given below in the E10 cell.
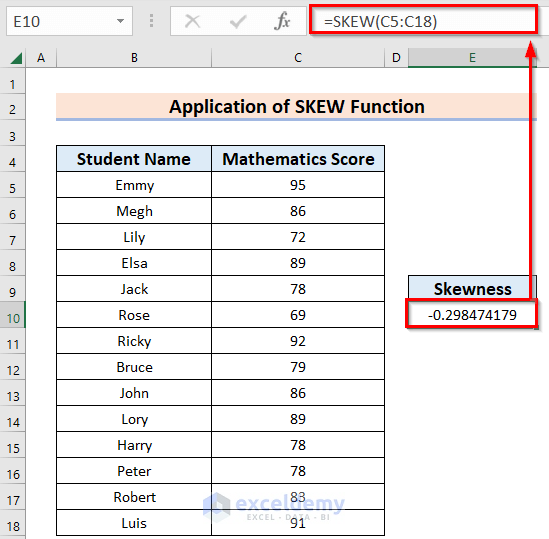
=SKEW(C5:C18)Here, in this formula, the SKEW function will return the skewness. Where C5:C18 is the number range.
- Subsequently, press ENTER, and you will get the skewness.
Read More: How to Calculate Coefficient of Skewness in Excel
2. Applying Data Analysis ToolPak to Find Skewness in Excel
You can apply the Data Analysis ToolPak to calculate skewness in Excel. Firstly, you have to check whether your Excel Custom Ribbon is the Data Analysis ToolPak visible or not. If the Data Analysis ToolPak is invisible then you should follow Step-1. Otherwise, you may follow from Step-2.
Step 1: Insert Data Analysis ToolPak
Here, I will show how to insert Data Analysis ToolPak in Excel.
- Firstly, you have to go to the File tab.
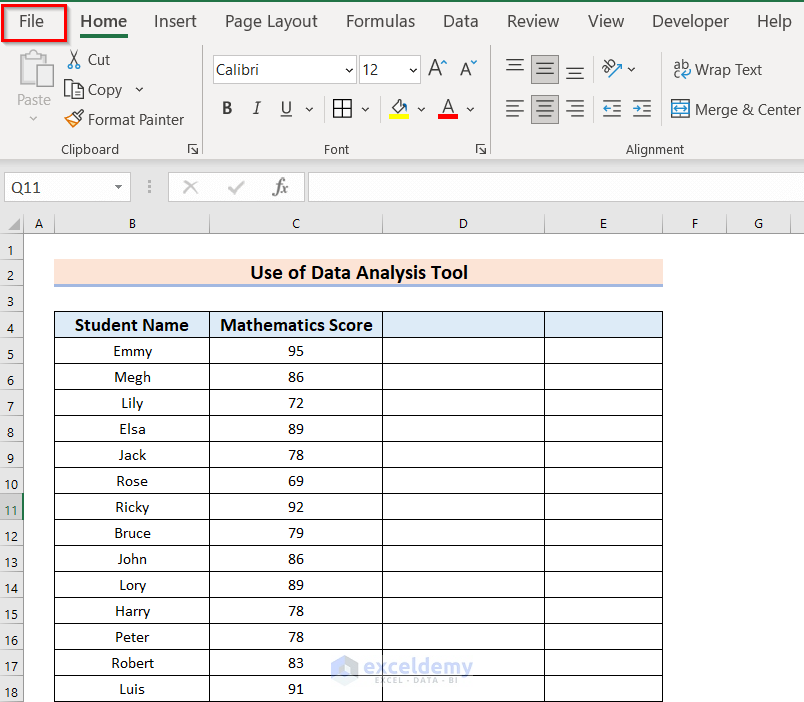
At this time, you will see the following window.
- Now, from that window, you should choose the Options menu.
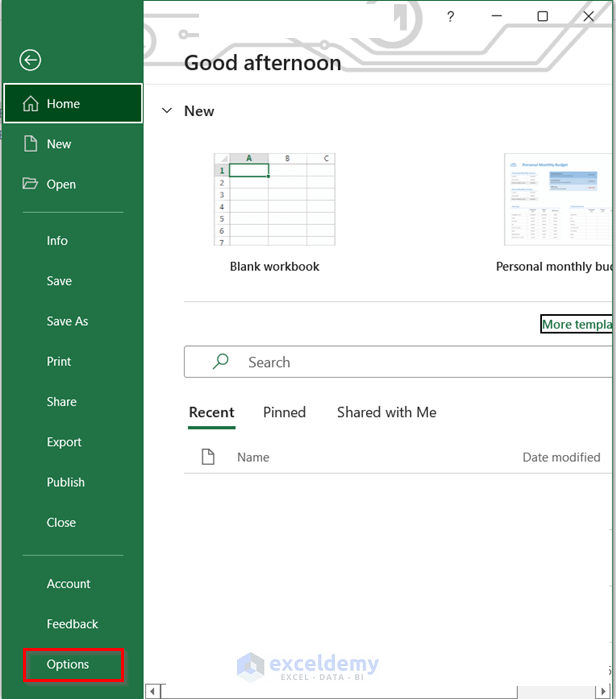
Consequently, a dialog box named Excel Options will appear.
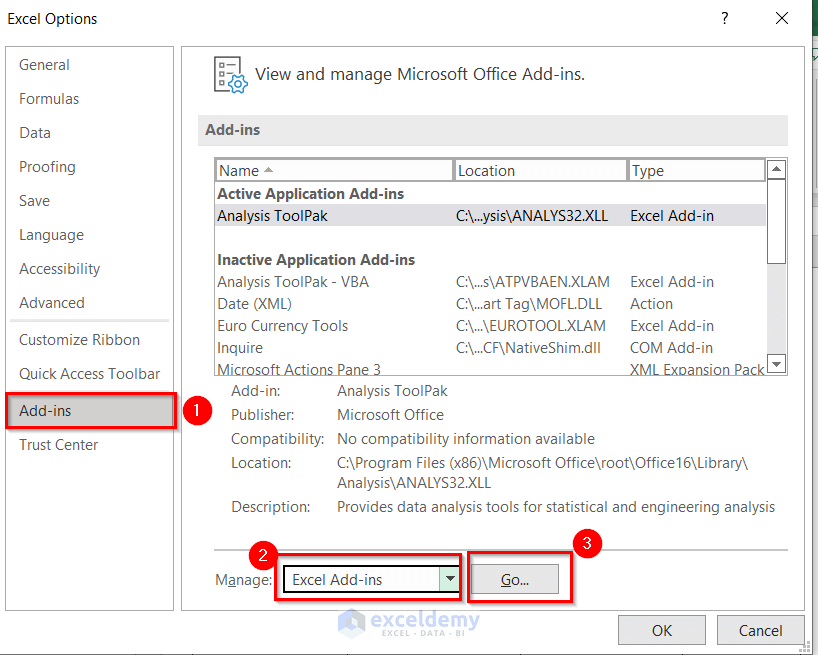
- Firstly, from that dialog box, you have to go to the Add-ins command.
- Secondly, choose Excel Add-ins in the Manage: box.
- Finally, press the Go button.
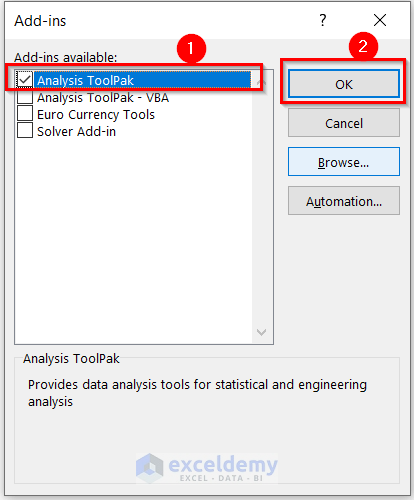
At this time, another dialog box named Add-ins will appear.
- Now, you need to click on the Analysis ToolPak.
- Then, press OK to get the changes.
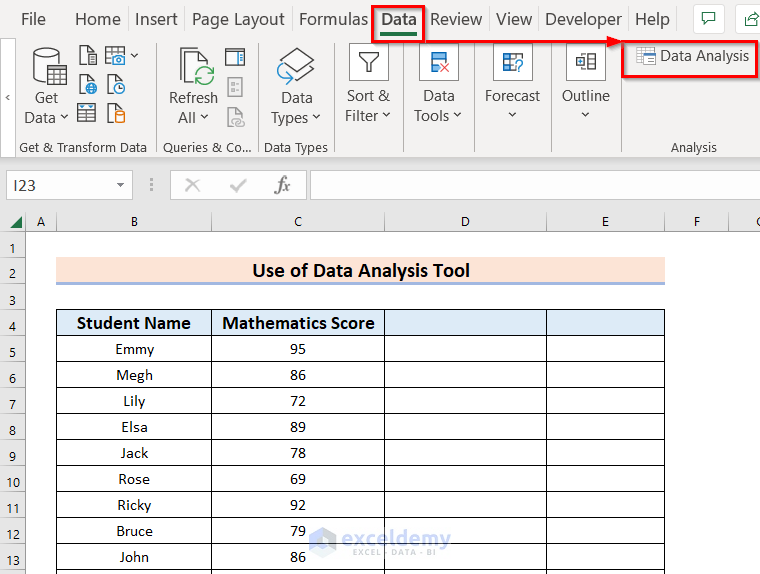
- Lastly, you will see that there is a new ribbon named Data Analysis under the Data tab.
Step 2: Use the Descriptive Statistics Feature from Data Analysis ToolPak
In this section, I will demonstrate how to use the Descriptive Statistics feature for the calculation of skewness with the help of the Data Analysis ToolPak in Excel.
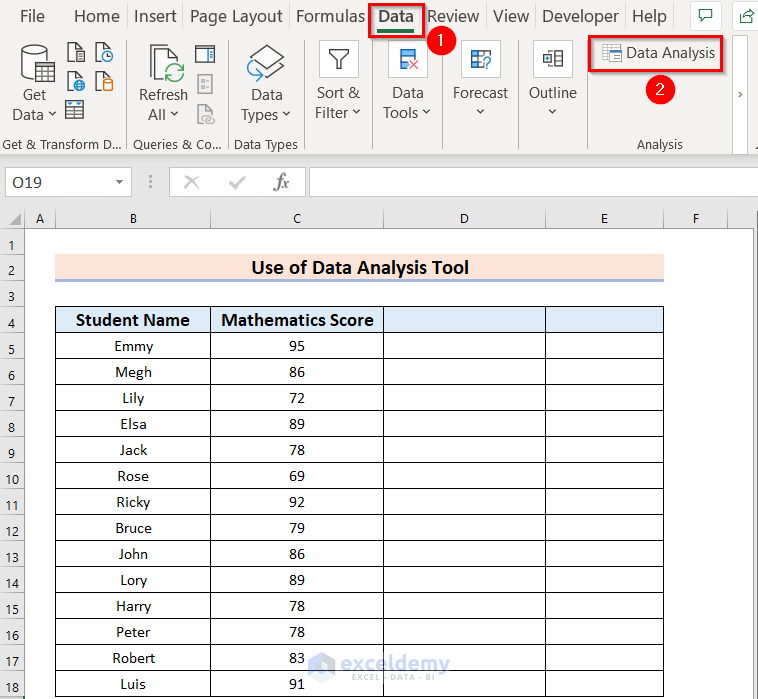
- Firstly, from the Data tab >> go to the Data Analysis ribbon.
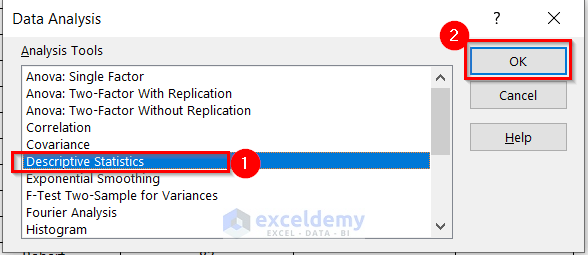
At this time, a dialog box named Data Analysis will appear.
- Now, select Descriptive Statistics and then Click on OK.
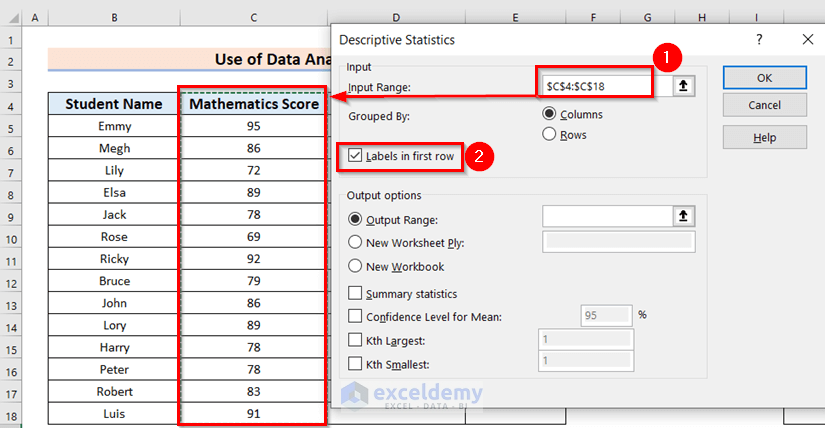
Subsequently, a new dialog box named Descriptive Statistics will appear.
- Firstly, select the data range in the Input Range: box for which you want to do the descriptive statistics. Here, I have selected the range C4:C18.
- Secondly, mark the Labels in first row option.
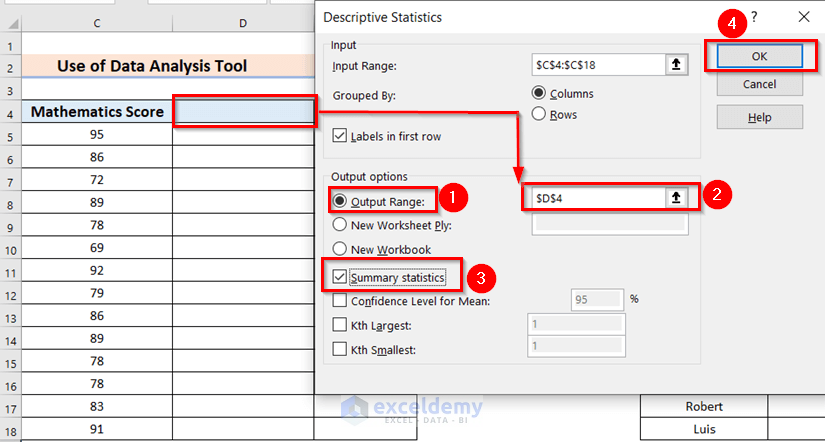
- After that, choose the cell in the Output Range: box where you want to see the result. Here, I have chosen the D4 cell.
- Then, you must mark the Summary statistics option.
- Finally, press OK to get the result.
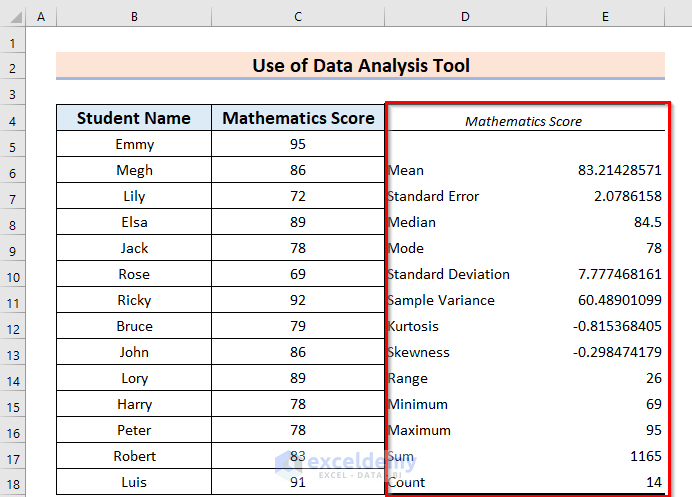
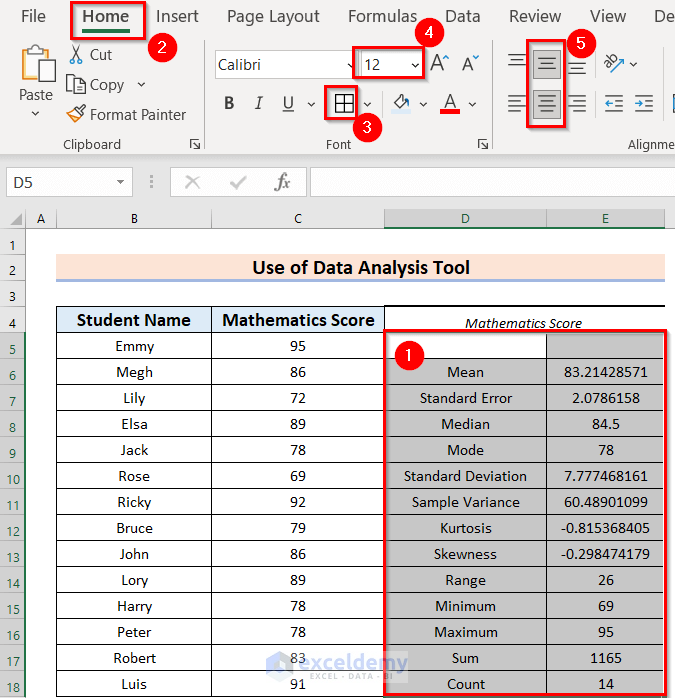
At this time, you will see the following output. Where you will find the skewness.
Now, I will do formatting to the output. In addition, you can do the formatting according to your preference. Also, this is not a mandatory term.
- Firstly, select the data range.
- Secondly, from the Home tab >> you may select the All Borders option >> then you may increase the Font Size >> then you may choose Center and Middle Alignment.
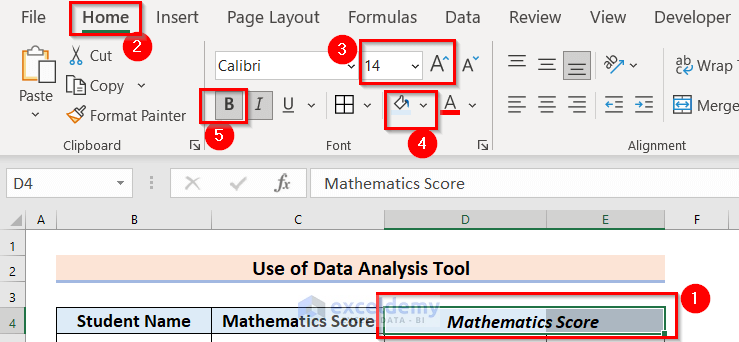
- After that, select D4:E4.
- Then, from the Home tab >> I increase the Font Size >> then I change the Fill Color >> then Bold it.
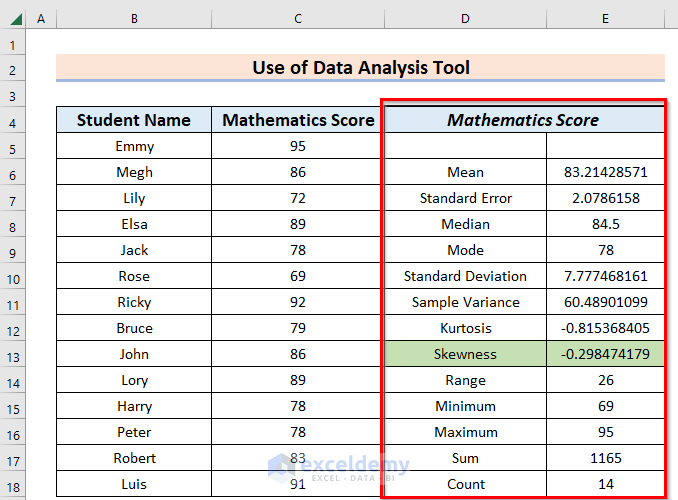
Finally, you will see the following formatted result. Additionally, I have marked the Skewness with Fill Color (Green, Accent 6, Lighter 60%).
Practice Section
Now, you can practice the explained method by yourself.

Download Practice Workbook
You can download the practice workbook from here:
Conclusion
I hope you found this article helpful. Here, I have explained 2 suitable methods for calculating the Skewness in Excel. Please, drop comments, suggestions, or queries if you have any in the comment section below.
Related Articles
<< Go Back to Skewness and Kurtosis in Excel | Excel for Statistics | Learn Excel
Get FREE Advanced Excel Exercises with Solutions!
