Method 1 – Calculate Pearson’s Skewness in Excel by Using Descriptive Statistics
1.1 Use AVERAGE, MODE.SNGL, STDEV.P Functions
Steps:
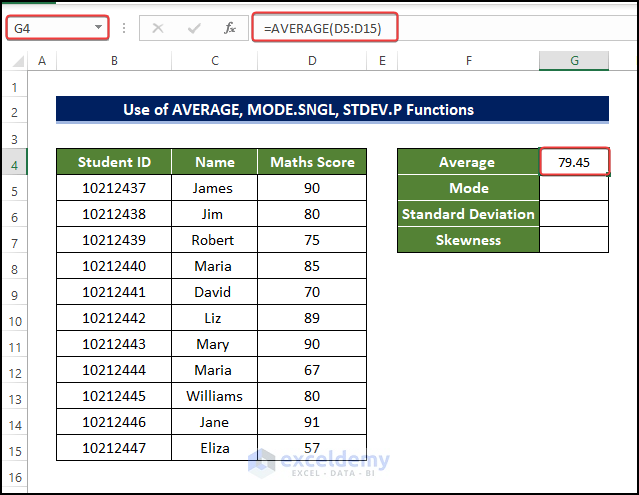
- Select the cell G4 and enter the following formula:
=AVERAGE(D5:D15)
- Pressing enter we got the average of the values in cell D5:D15 in cell G4.
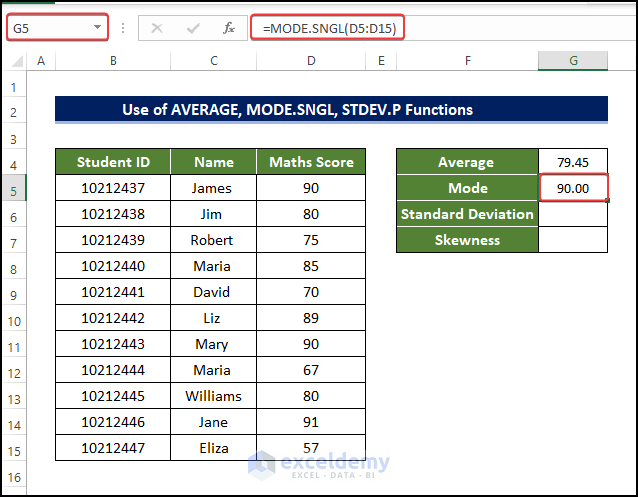
- Select the cell G5 and enter the following formula:
=MODE.SNGL(D5:D15)
- Pressing Enter, we got the Mode of the values mentioned in the range of cell D5:D15 in cell G5.
- Select the cell G6 and enter the following formula:
=STDEV.P(D5:D15)
- Pressing Enter, we got the Standard Deviation of the values mentioned in the range of cell D5:D15 in cell G6.

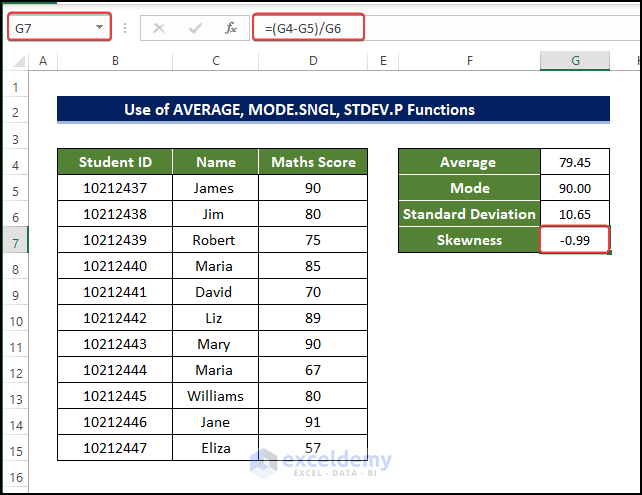
- Select the cell and enter the following formula:
=(G4-G5)/G6
- Pressing Enter we got the average of the values mentioned in the range of cells D5:D15 in cell G7.
1.2 Apply AVERAGE, MEDIAN, STDEV.P Functions
Steps:
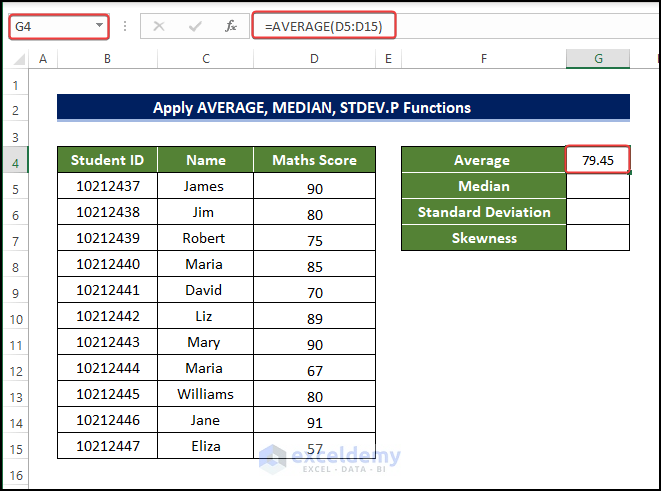
- Select the cell G4 and enter the following formula:
=AVERAGE(D5:D15)
- Pressing Enter we got the average of the values mentioned in the range of cell D5:D15 in cell G4.
- Select the cell G5 and enter the following formula:
=MEDIAN(D5:D15)
- Pressing Enter, we got the Median of the values mentioned in the range of cell D5:D15 in cell G5.

- Select the cell G6 and enter the following formula:
=STDEV.P(D5:D15)
- Pressing Enter, get the Standard Deviation of the values in the range of cell D5:D15 in cell G6.
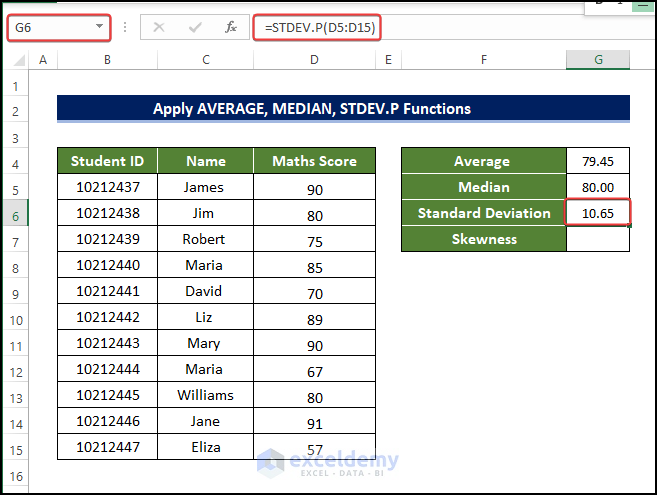
- Select the cell G7 and enter the following formula:
=3*((G4-G5)/G6)
- Pressing Enter, we got the Skewness of Coefficient of the values in the range of cell D5:D15 in cell G7.

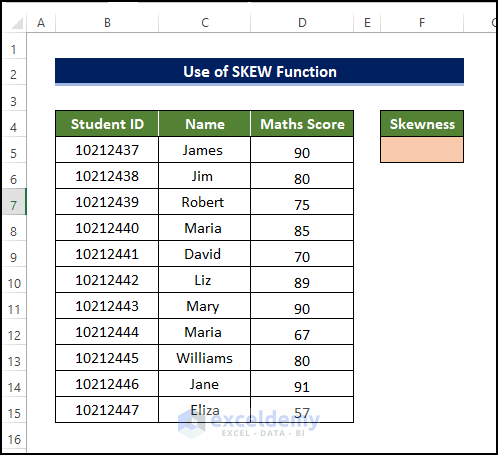
Method 2 – Insert Excel SKEW Function to Estimate Skewness Coefficient
Steps:
- Below are the data of students with their id and their scores in Math.
- In the cell G5, we need to estimate the skewness of this dataset,
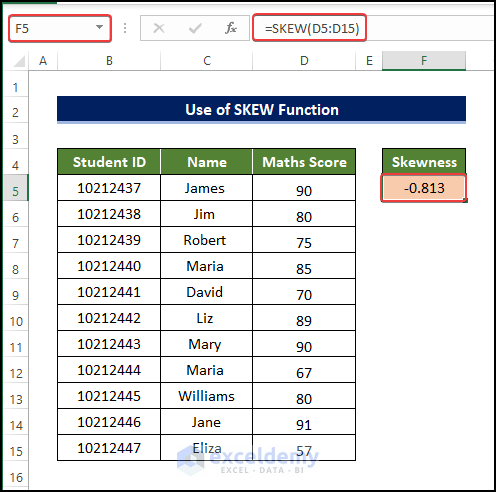
- Select cell G5 and enter the following formula and press Enter:
=SKEW(D5:D15)
- After pressing Enter, you will notice that the coefficient of skewness of the range of cells D5:D15 is now showing at cell F5.
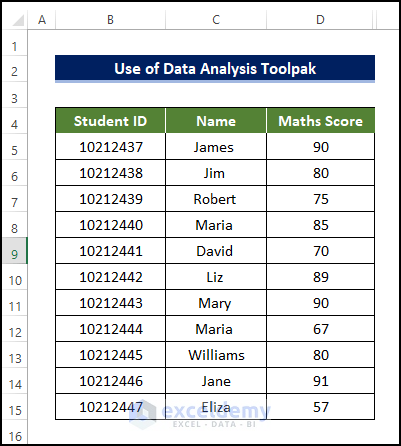
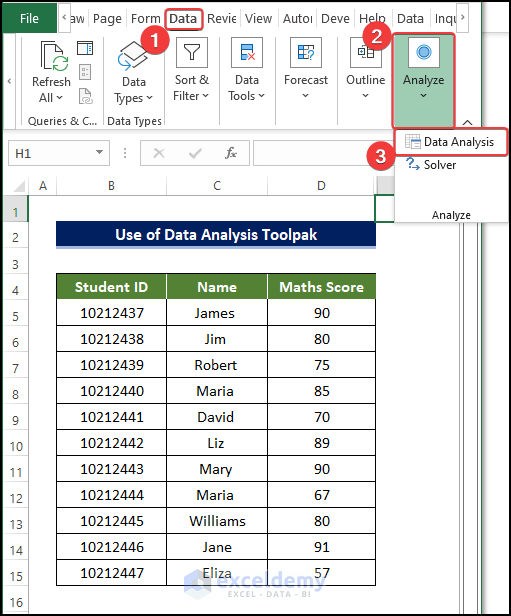
Method 3 – Apply Data Analysis Toolpak to Get Coefficient of Skewness
Steps:
- We have the student’s marks with their id information in the below dataset.
- The coefficient of skewness of those marks needs to be determined.
- Enable the Data Analysis feature if you don’t find it in the Data tab.
- Click on the added Data Analysis feature from Data > Analyze.
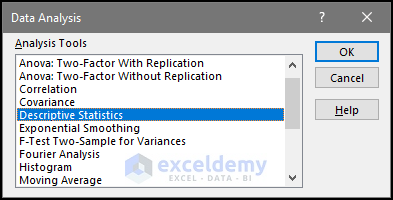
- A new window will open, and select Descriptive Statistics.
- Click OK after this.
- In the next window. Select cell D4:D15 in the Input Range range box.
- Then select Columns in the Grouped By option.
- Tick the Labels in the first row check box.
- Set the Output Range as the F4.
- Check both the Summary Statistics and Confidence Level for Mean box.
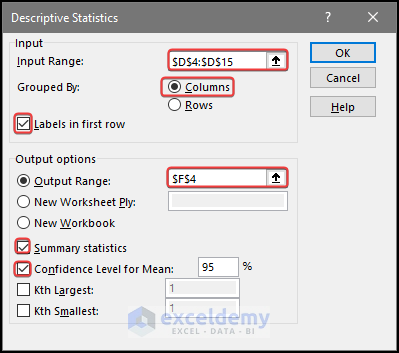
- Click OK.
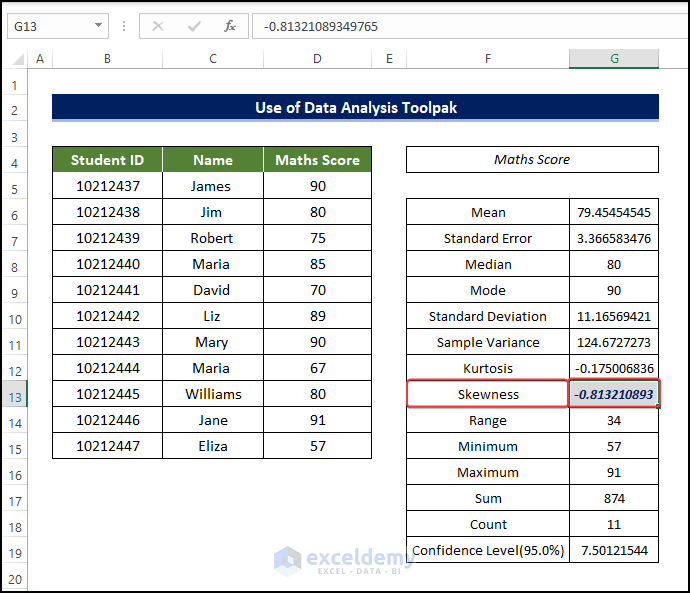
- Clicking OK. you will notice that the Skewness Coefficient value is now in cell G13.
Download Practice Workbook
Download this practice sheet to practice while you are reading this article.
<< Go Back to Excel for Statistics | Learn Excel
Get FREE Advanced Excel Exercises with Solutions!
