Sometimes you may need to do Descriptive Statistics in Excel. In addition, you can find out lots of statistical terms like Summation, Median, Mean, Minimum, Maximum, Standard Deviation and so on through one simple method. So, I will explain how to do Descriptive Statistics in Excel in this article.
How to Do Descriptive Statistics in Excel: 2 Ways
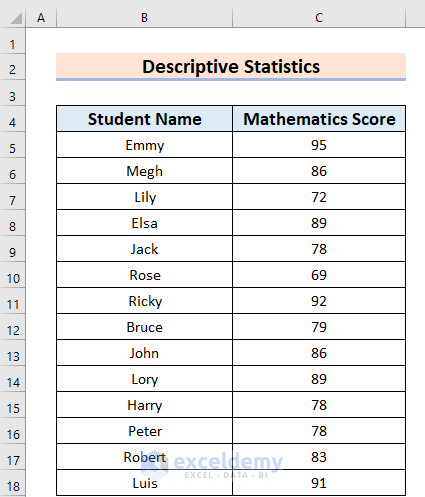
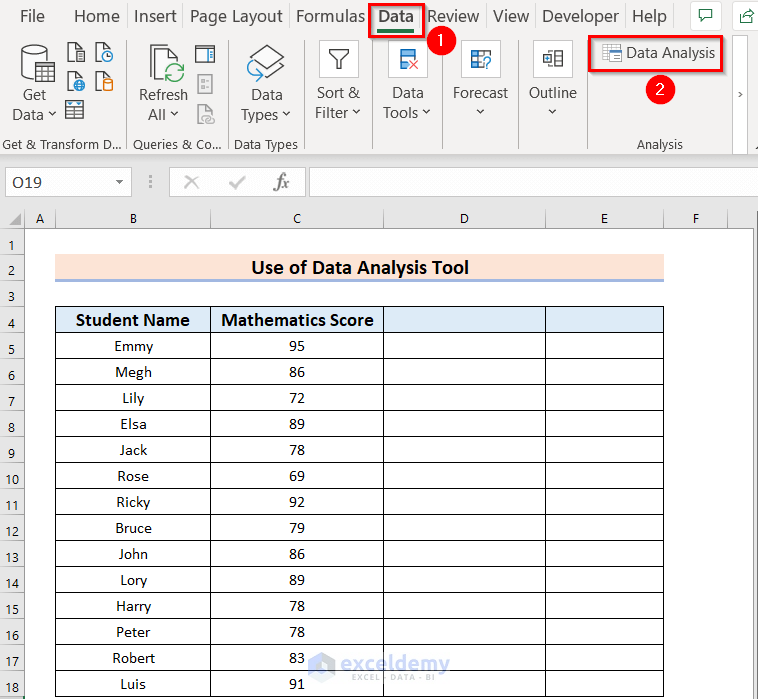
Here, I will describe 2 suitable methods on how to do Descriptive Statistics in Excel. Also, for your better understanding, I’m going to use sample data that has 2 columns. Those are Student Name, and Mathematics Score. The dataset is given below.
1. Applying Data Analysis ToolPak to Do Descriptive Statistics in Excel
You can apply the Data Analysis ToolPak to do Descriptive Statistics in Excel. First, you have to check whether your Excel Custom Ribbon is the Data Analysis ToolPak visible or not. If the Data Analysis ToolPak is invisible then you should follow Step-1. Otherwise, you may follow from Step-2.
Step 1: Inserting Data Analysis ToolPak in Excel
Here, I will show how to insert Data Analysis ToolPak in Excel.
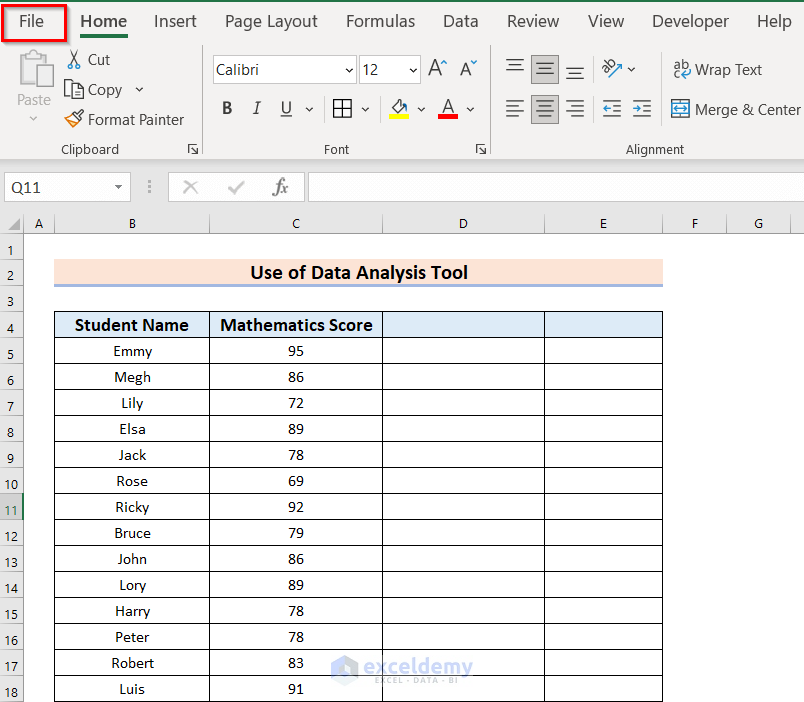
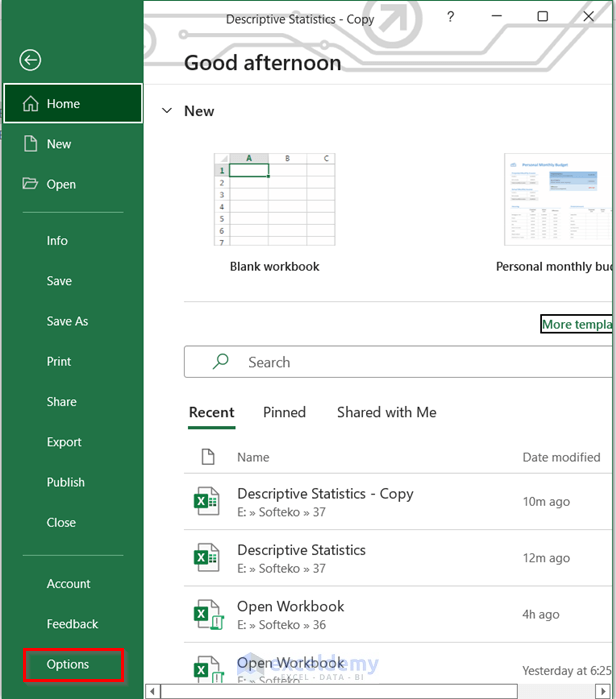
At this time, you will see the following window.
- Now, from that window, you should choose the Options menu.
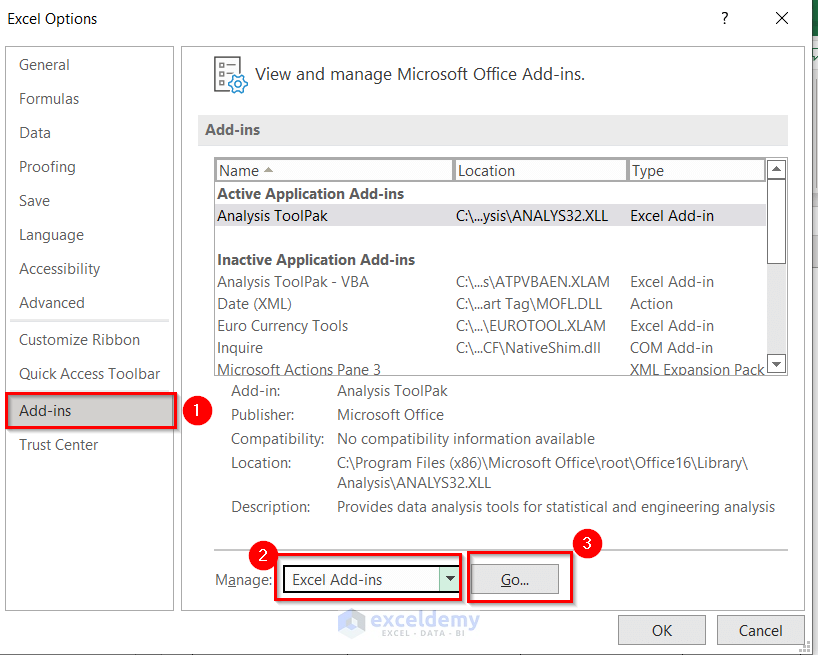
At this time, a dialog box named Excel Options will appear.
- Firstly, from that dialog box, you have to go to Add-ins command.
- Secondly, choose Excel Add-ins in the Manage: box.
- Finally, press the Go button.
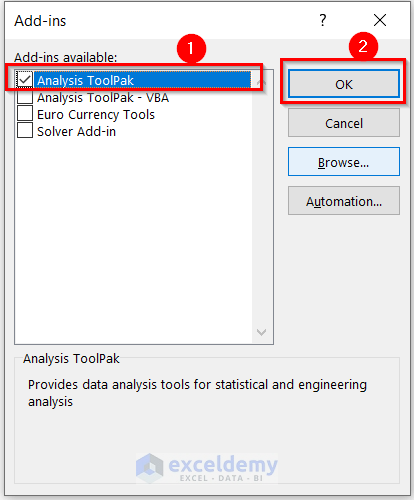
At this time, another dialog box named Add-ins will appear.
- Now, you need to click on the Analysis ToolPak.
- Then, press OK to get the changes.
Lastly, you will see that there is a new ribbon named Data Analysis under the Data tab.
Step 2: Use of Descriptive Statistics in Excel
In this section, I will demonstrate how to use the Descriptive Statistics feature in Excel.
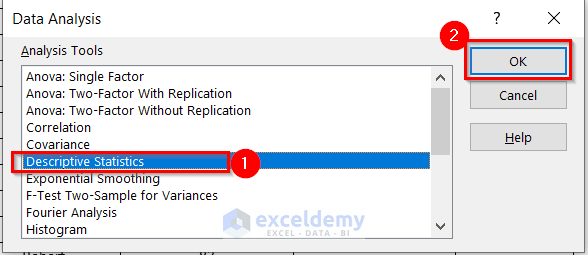
At this time, a dialog box named Data Analysis will appear.
- Now, select Descriptive Statistics and then Click on OK.
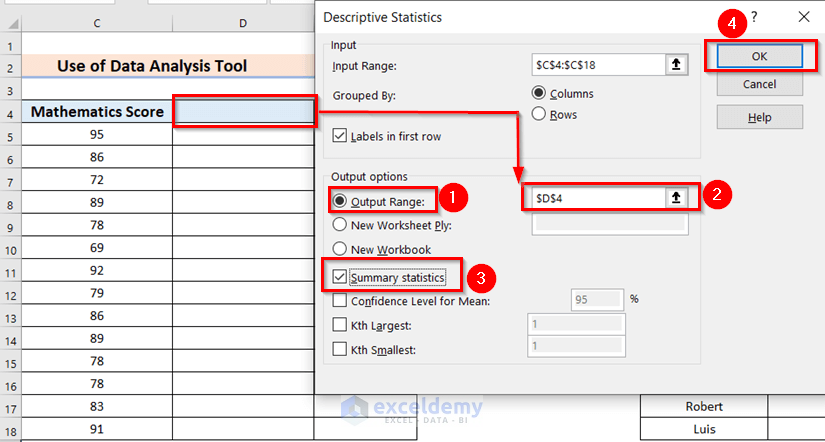
Subsequently, a new dialog box named Descriptive Statistics will appear.
- Firstly, select the data range in the Input Range: box for which you want to do the descriptive statistics. Here, I have selected the range C4:C18.
- Secondly, mark the Labels in first row option.
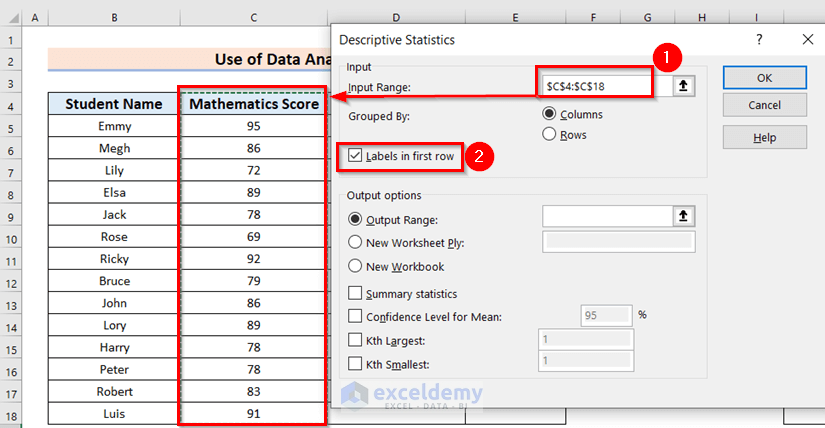
- After that, choose the cell in the Output Range: box where you want to see the result. Here, I have chosen the D4 cell.
- Then, you must mark the Summary statistics option.
- Finally, press OK to get the result.
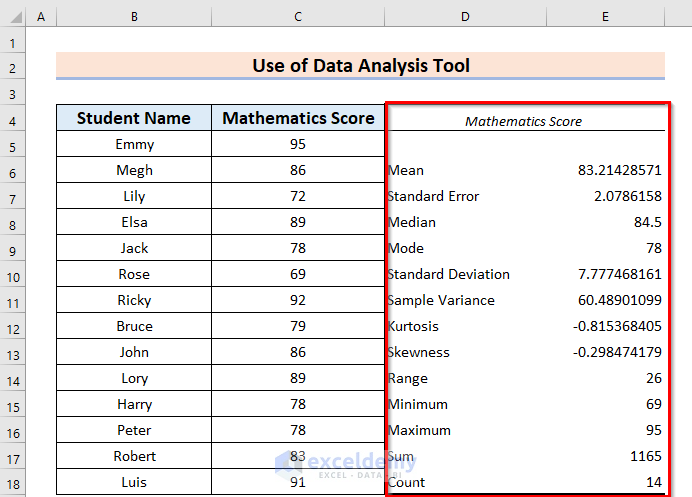
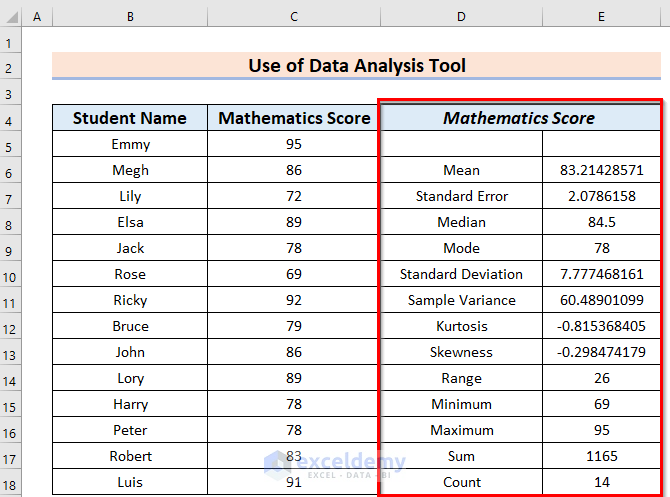
At this time, you will see the following output.
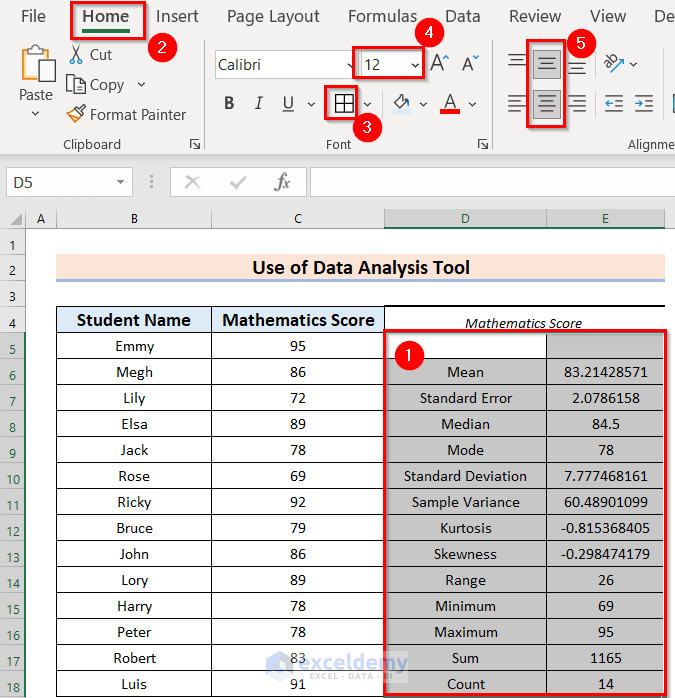
Now, I will do formatting to the output. In addition, you can do the formatting according to your preference. Also, this is not a mandatory term.
- Firstly, select the data range.
- Secondly, from the Home tab >> you may select the All Borders option >> then you may increase the Font Size >> then you may choose Center and Middle Alignment.
- After that, select D4:E4.
- Then, from the Home tab >> I increase the Font Size >> then I change the Fill Color >> then Bold it.
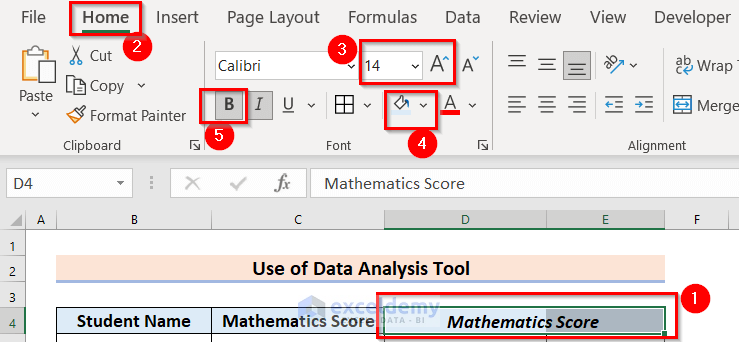
Finally, you will see the following formatted result. Hope, you’ve now got a clear idea of how to do descriptive statistics in Excel with the help of Data Analysis Toolpak.
2. Employing Power Query to Do Descriptive Statistics in Excel
You can employ Power Query to do Descriptive Statistics in Excel. Furthermore, with this method, you will get certain terms of Descriptive Statistics like Sum, Max, Min, Average, Median, and Count. The steps are given below.
Steps:
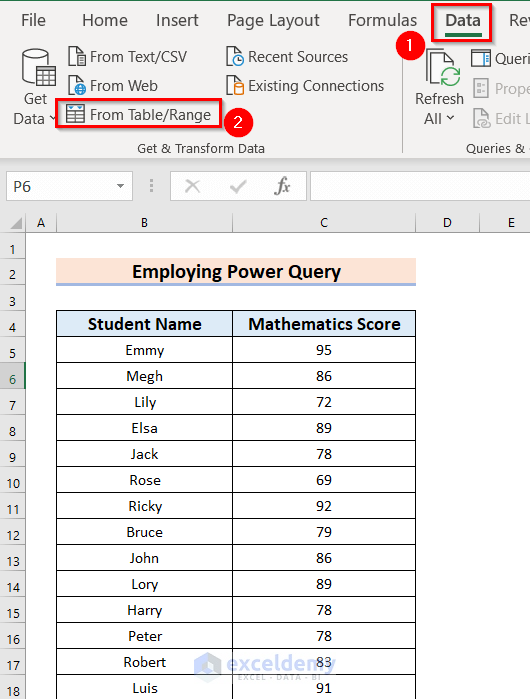
- Firstly, from the Data tab >> you should go to the From Table/Range feature.
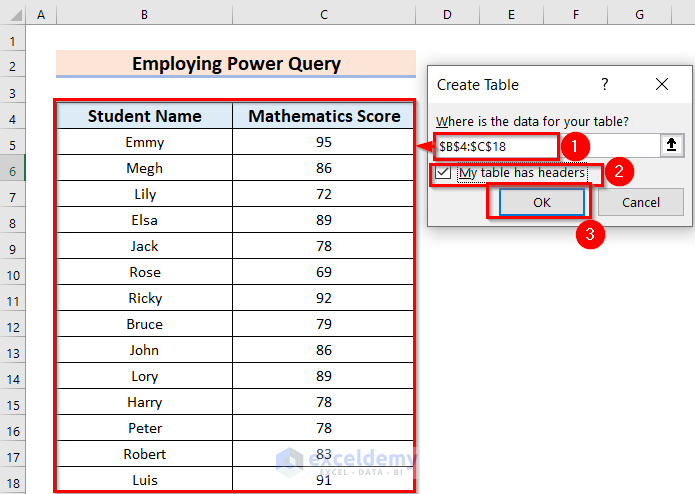
At this time, a dialog box named Create Table will appear.
- Firstly, select the data range. Here, I have selected the data B4:C18.
- Secondly, I must check the My table has headers option. This is because I have selected data with titles.
- Thirdly, press OK to get the result.
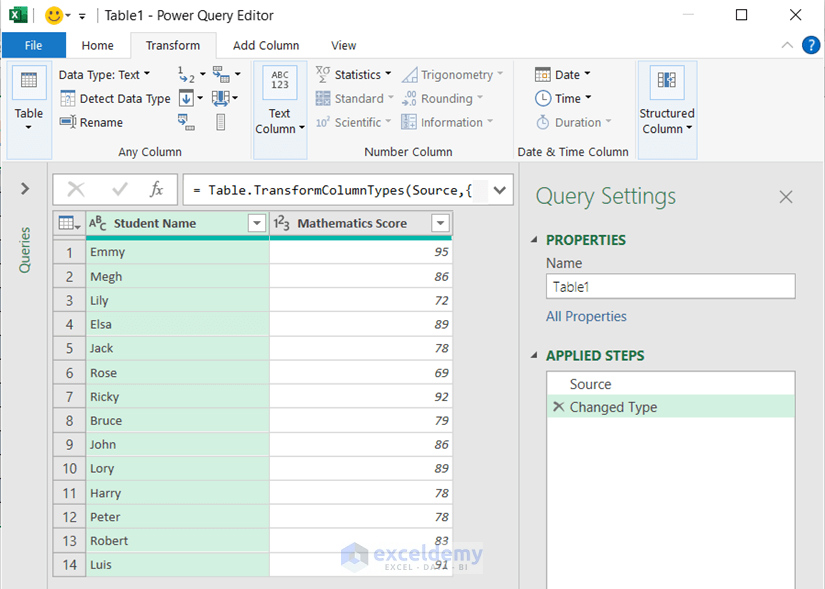
After that, you will see the following situation. Which is Table-1 Power Query Editor.
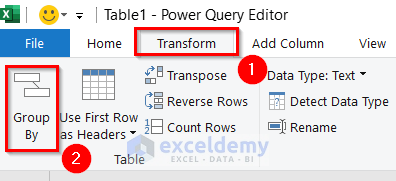
- Now, from the Transform tab >> you have to go to the Group By command.
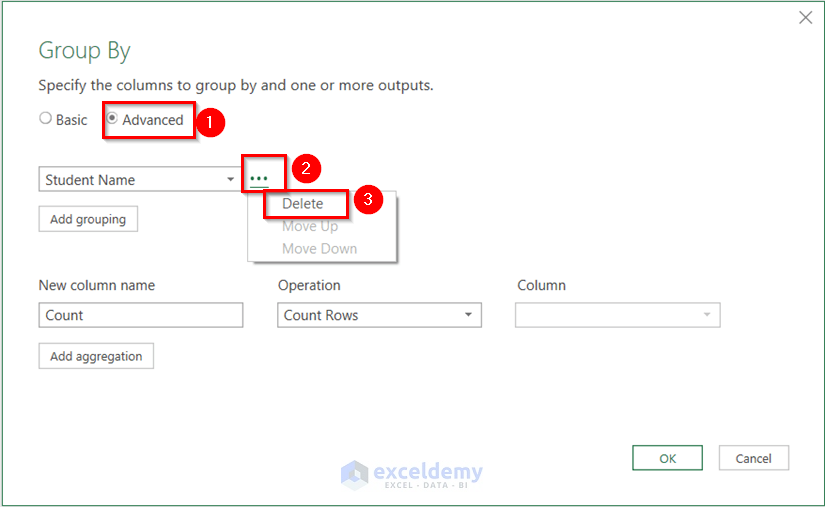
At this time, a new window named Group By will appear.
- Firstly, check Advanced.
- Secondly, from the three dots beside Student Name >> you should press on Delete.
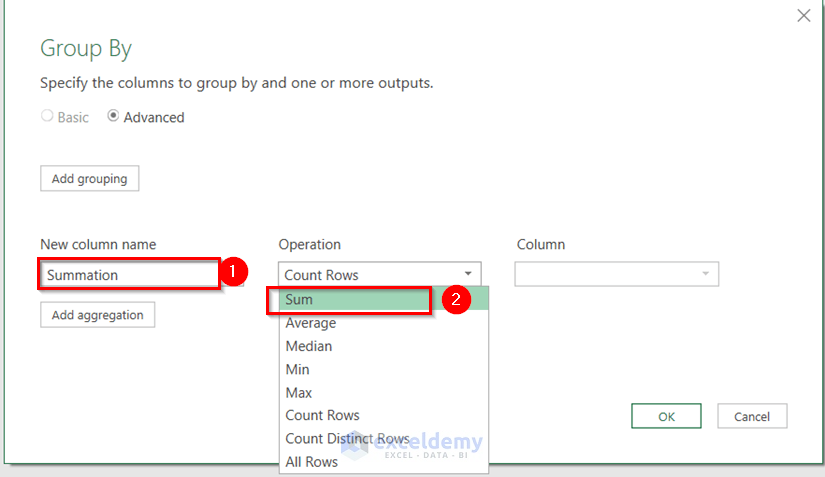
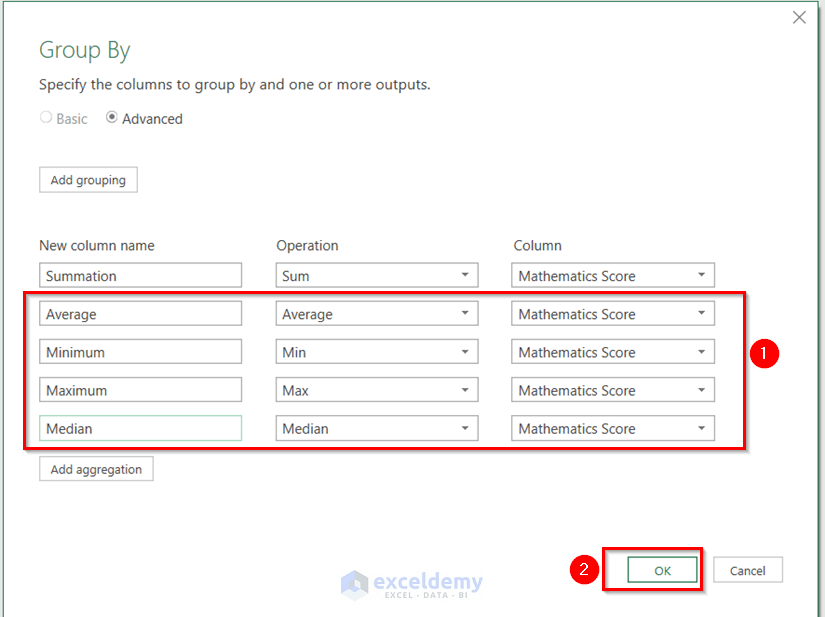
- Now, in the same window, write down Summation in the New column name.
- Then, choose the Operation as Sum.
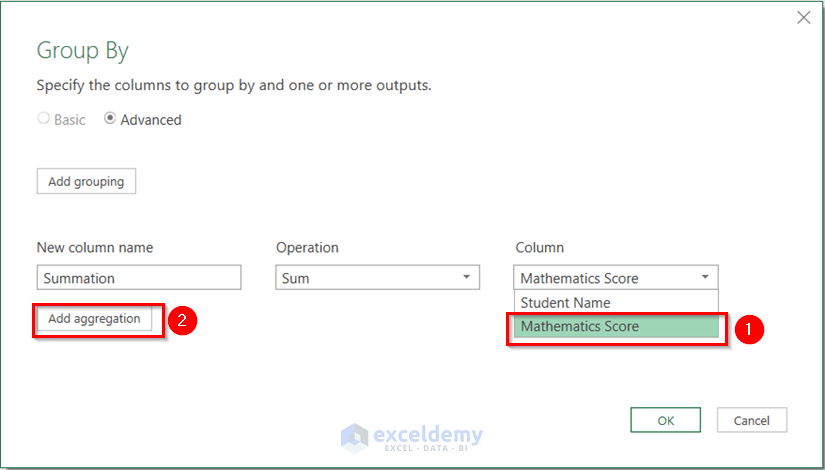
- After that, choose the Mathematics Score in the Column box.
- Then, click on Add aggregation.
Here, I have pressed 4th time on the Add aggregation. But, you have to do this as per your requirement.
- Now, in the same way, write down in the New column name and choose the Operation and then select the Mathematics Score option.
- Finally, press OK to get changes.
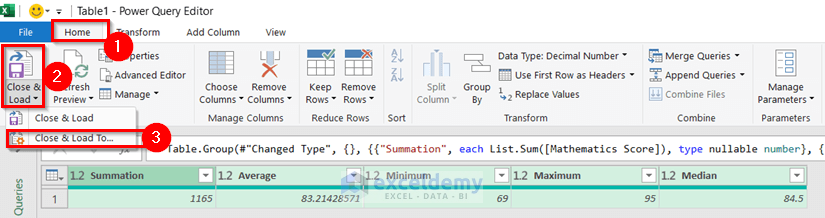
- Subsequently, from the Home tab >> choose the Close & Load feature >> then select Close & Load To…
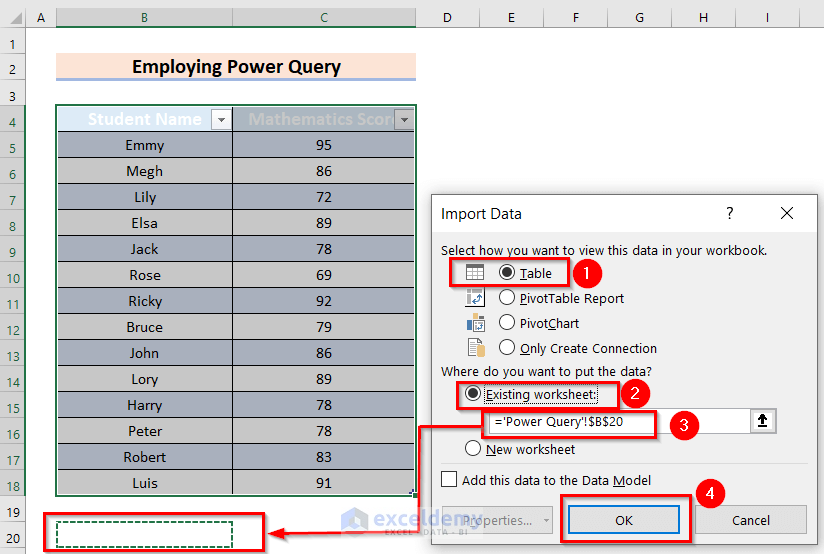
At this time, a new dialog box named Import Data will appear.
- Firstly, check Table.
- Secondly, mark the Existing worksheet:
- Thirdly, choose the cell where you want to keep the results.
- Finally, press OK.
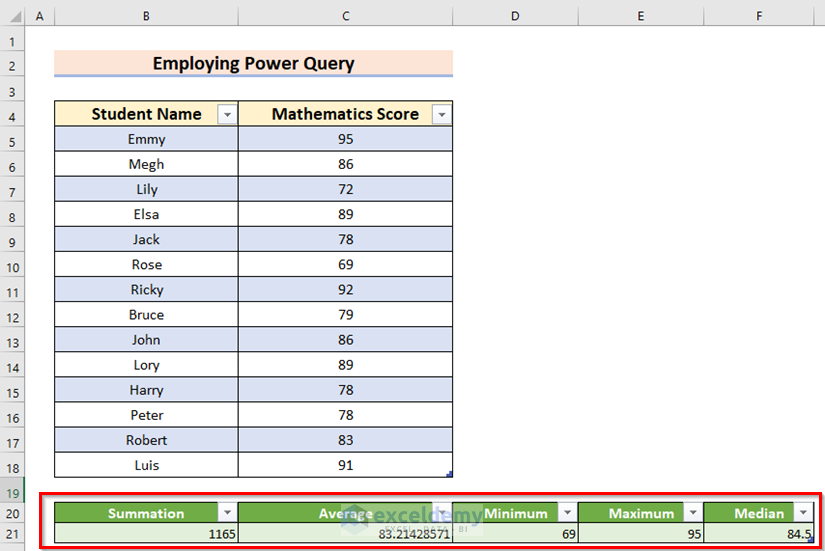
At the end, you will get the following result in your worksheet.
How to Do Descriptive Statistics in Excel by Using Customize Status Bar
You can use the Customize Status Bar to do Descriptive Statistics in Excel. Also, with this method, you will get certain terms of Descriptive Statistics. These are Average, Count, Maximum, Minimum, and Sum. The steps are given below.
Steps:
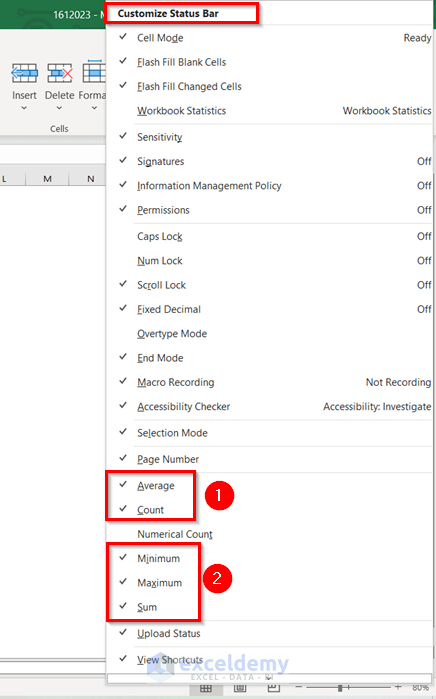
- Firstly, Right Click on the Status Bar.
- Secondly, from the Context Menu Bar whose name is Customize Status Bar >> must check Average, Count, Maximum, Minimum, and Sum.
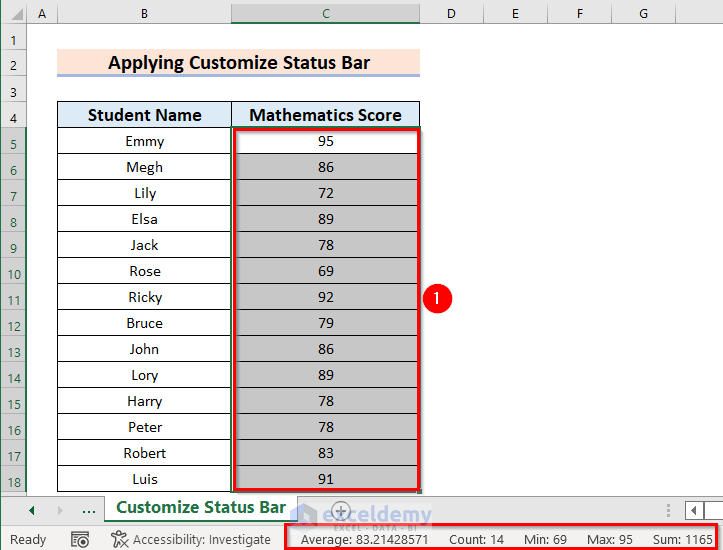
Finally, if you select the data range you will see the results on the Status Bar.
💬 Things to Remember
- With method 1 you will get lots of statistics terms. But method 2 and 3 will give you certain terms.
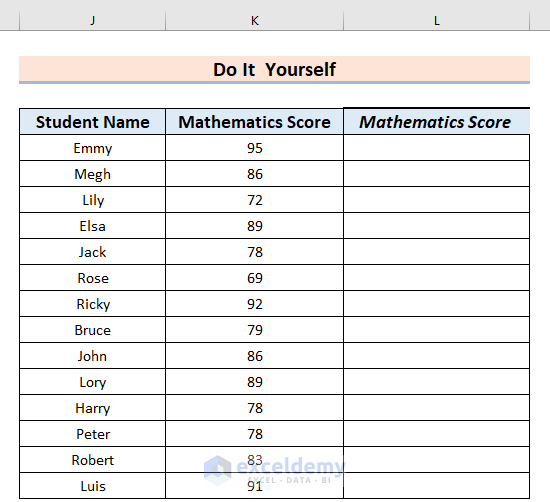
Practice Section
Now, you can practice the explained method by yourself.
Download Practice Workbook
You can download the practice workbook from here:
Conclusion
I hope you found this article helpful. Here, I have explained 2 methods of how to do Descriptive Statistics in Excel. Please, drop comments, suggestions, or queries if you have any in the comment section below.
Excel Descriptive Statistics: Knowledge Hub
- How to Create a Descriptive Statistics Table in Excel
- Get Summary Statistics in Excel
- Descriptive Statistics – Input Range Contains Non-Numeric Data
<< Go Back to Excel for Statistics | Learn Excel
Get FREE Advanced Excel Exercises with Solutions!
