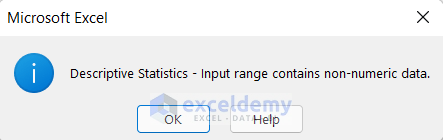
Descriptive Statistics can work only on numeric values. When non-numeric data is used for Descriptive Statistics, it shows an error that instructs us to input a range that contains non-numeric data.
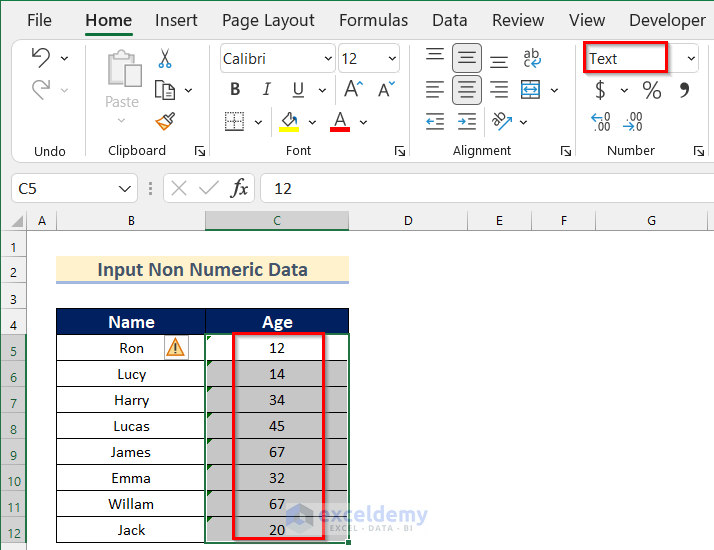
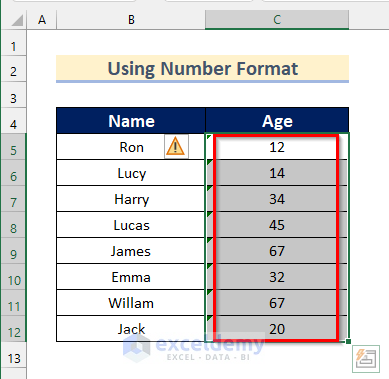
In the sample dataset below, the values in Cell range C5:C12 are in Text Format.
When we input this cell range in descriptive Statistics it shows an error as shown below.
Method 1 – Using Number Format
Step 1: Adding Data Analysis Command in Excel Workbook
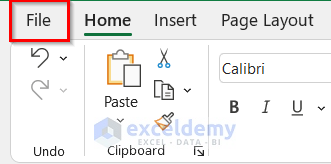
- Click on the File tab.
- Click on the Options.
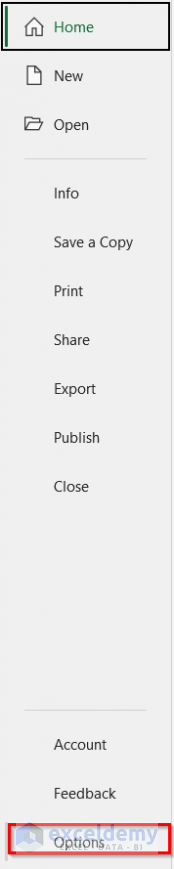
- The Excel Options box will open.
- Go to the Add-ins tab >> click on Analysis ToolPak.
- Click on Go.
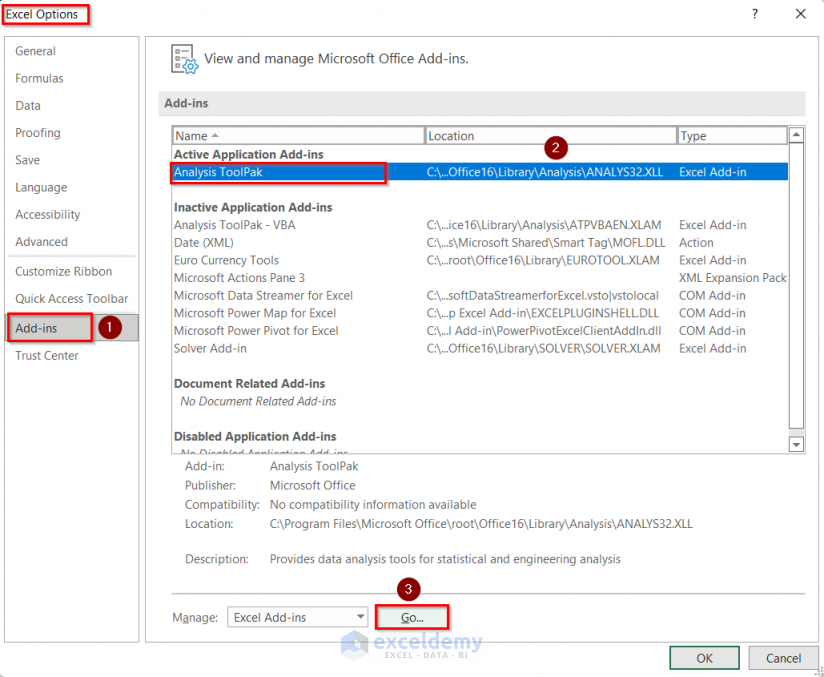
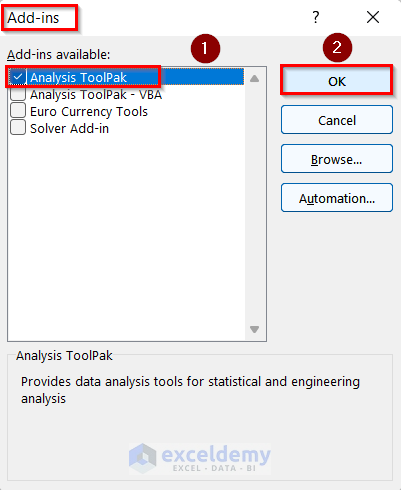
- The Add-ins box will appear.
- Check Analysis ToolPak.
- Click OK.
Step 2: Using Number Format to Input Non-Numeric Data Range
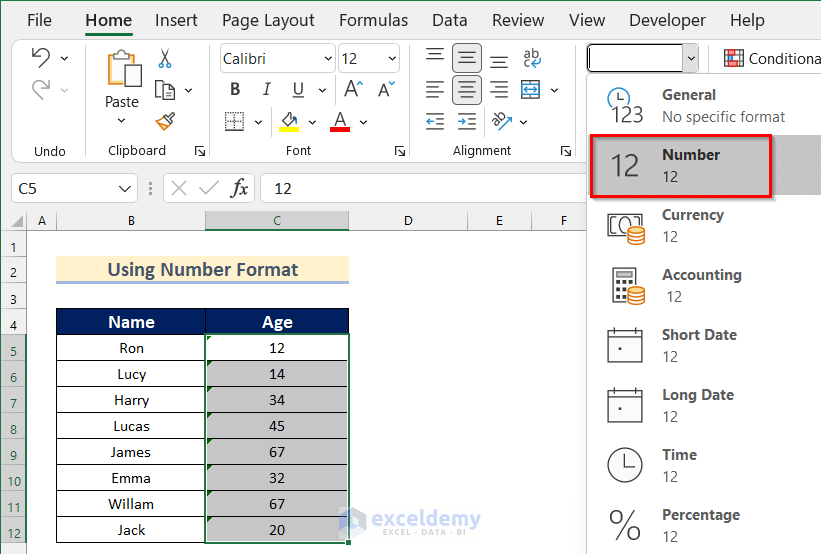
- Select Cell range C5:C12.
- Go to the Home tab >> click on Number Format.
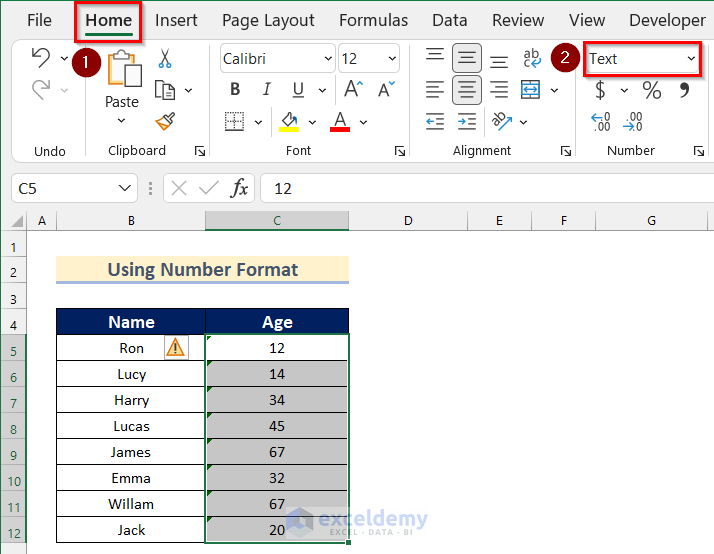
- Select Number.
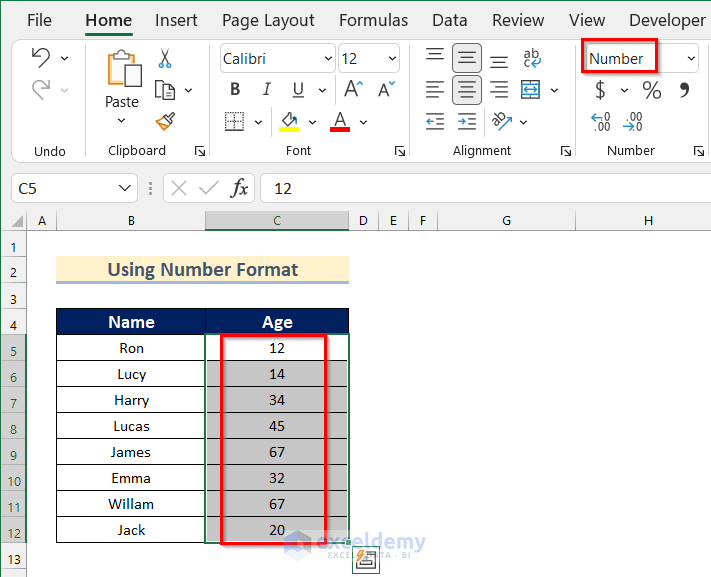
- Cell range C5:C12 will change to Number Format.
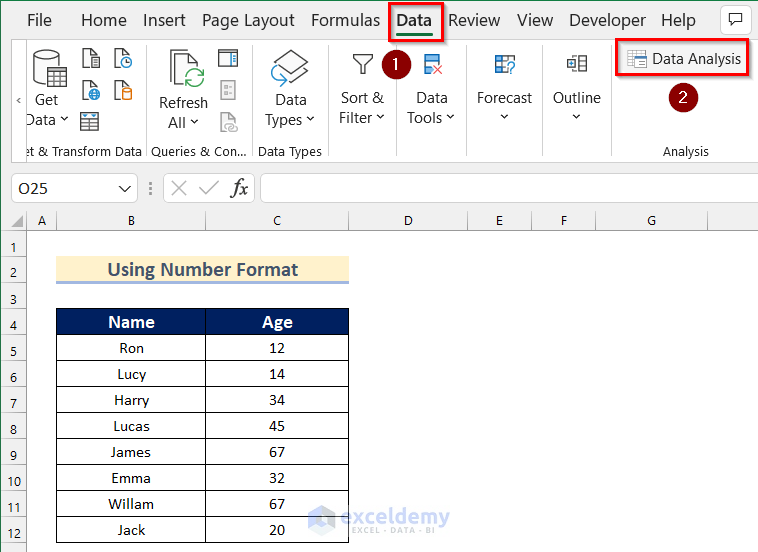
- Go to the Data tab >> click on Data Analysis.
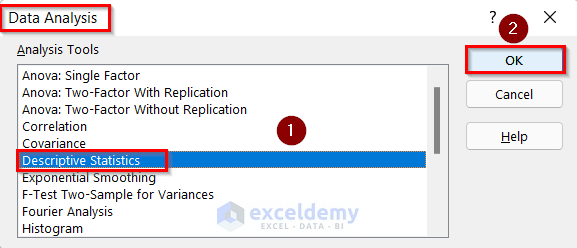
- The Data Analysis box will appear.
- Select Descriptive Statistics.
- Click on OK.
- The Descriptive Statistics box will open.
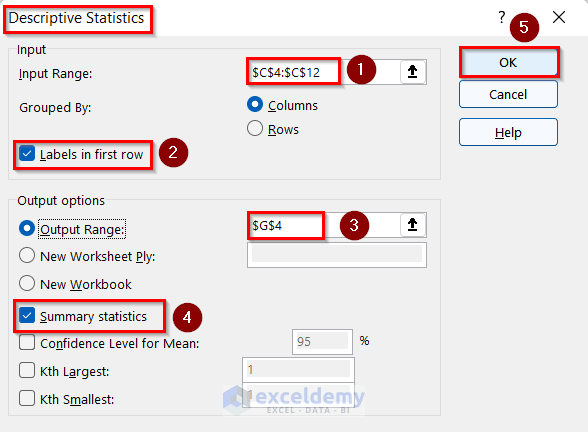
- Select Cell range C4:C12 in the Input Range box.
- Turn on Labels in first row option.
- Input Cell G4 as Output Range.
- Select any Statistical option. We will select Summary statistics.
- Click on OK.
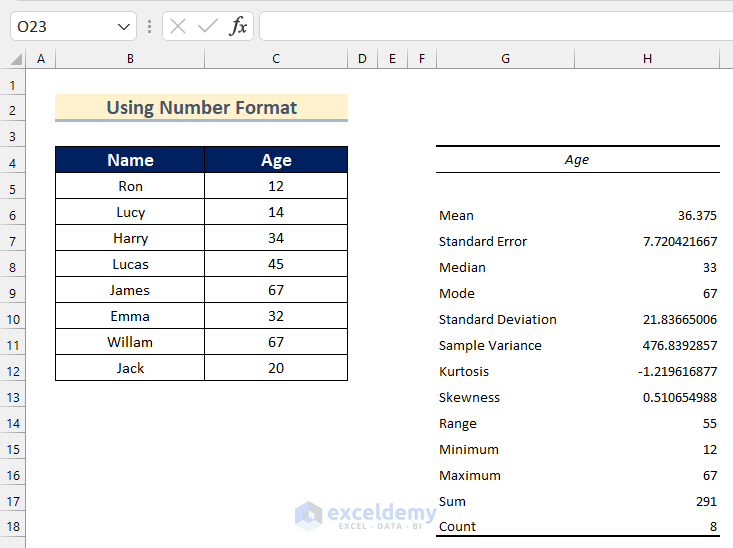
- You will get your desired Descriptive Statistics analysis of the given data using Number Format.
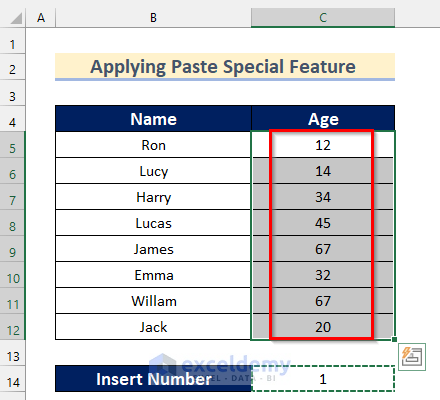
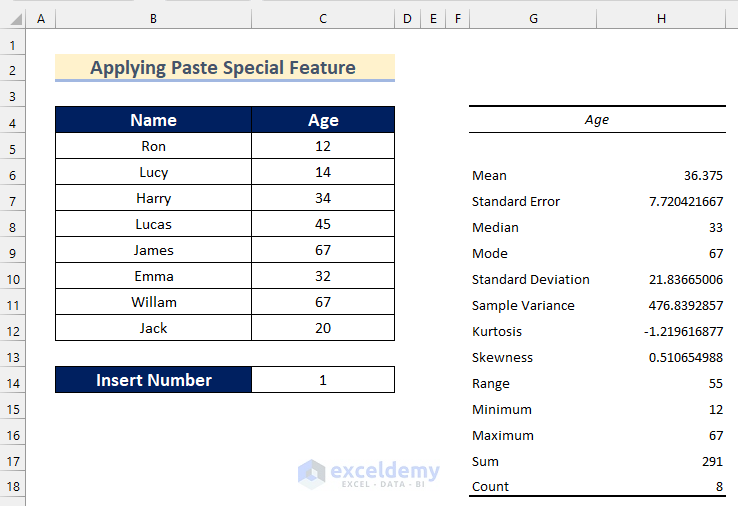
Method 2 – Applying Paste Special Feature
Steps:
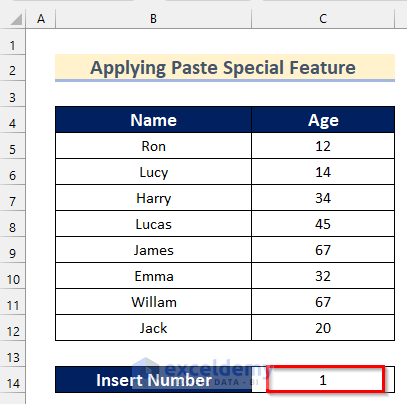
- Insert 1 in any Cell of your Excel worksheet. We will insert 1 in Cell C14.
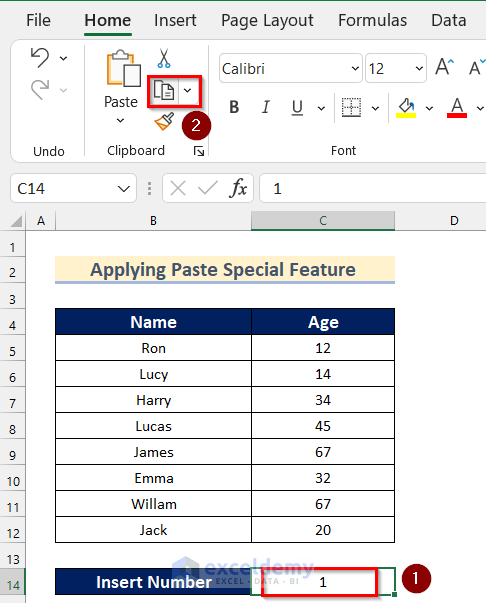
- Select Cell C14 and click on the Copy button.
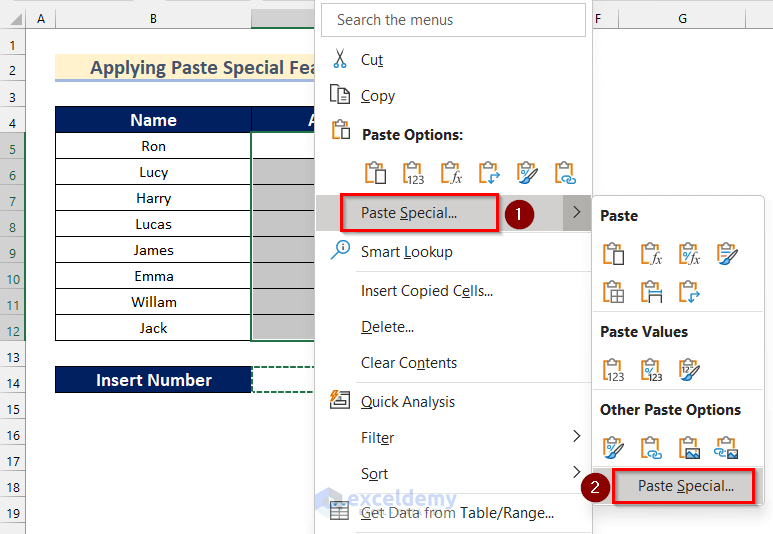
- Select Cell range C5:C12 and Right-click on it.
- Click on Paste Special >> select Paste Special.
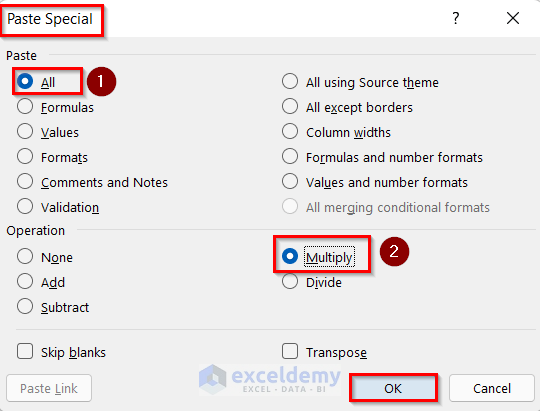
- The Paste Special box will appear.
- Select All from Paste options.
- Select Multiply from Operation options.
- Click on OK.
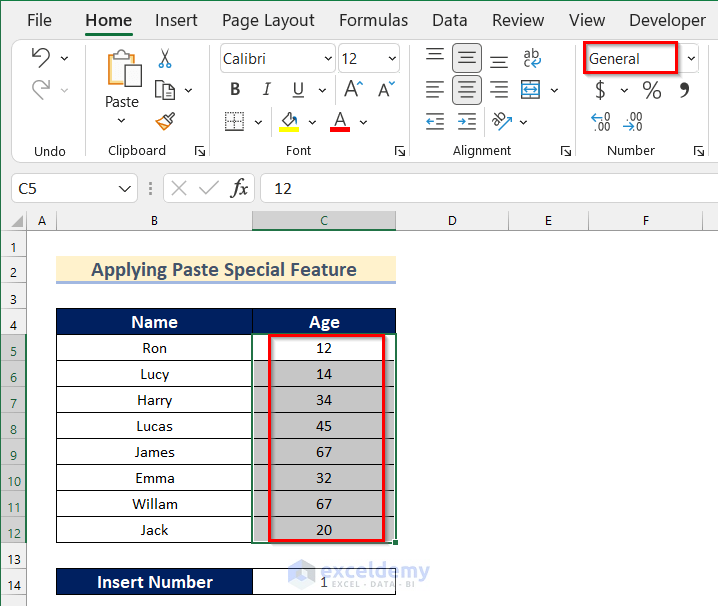
- Cell range C5:C12 turns to General Format.
- Follow the steps shown in Method 1 to insert Descriptive Statistical analysis of the dataset.
- You will get your desired Descriptive Statistics of the given data by applying Paste Special Feature.
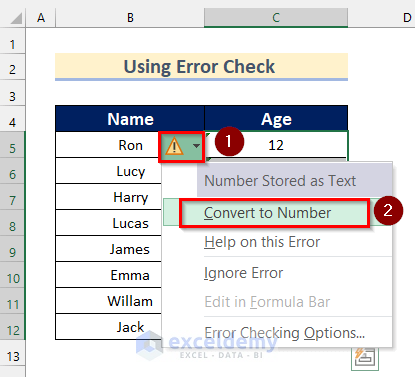
Method 3 – Using Error Check to See Non-Numeric Data
Steps:
- Select Cell range C5:C12.

- Click on the Error box.
- Click on Convert to Number.
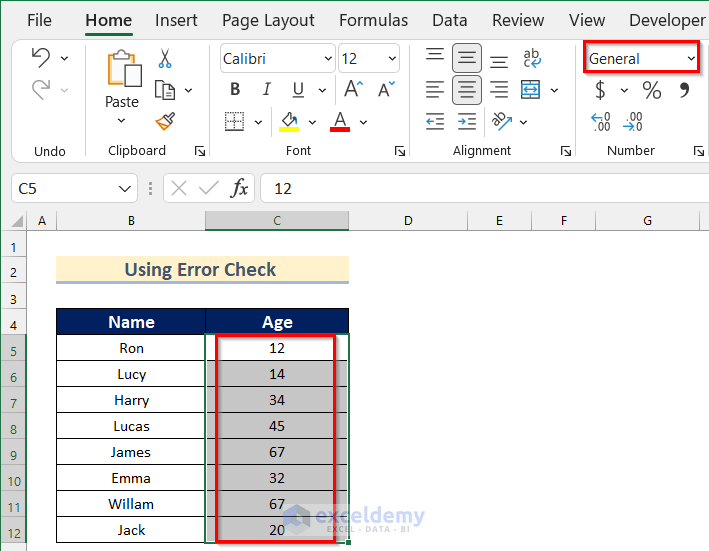
- Cell range C5:C12 is in General Format.
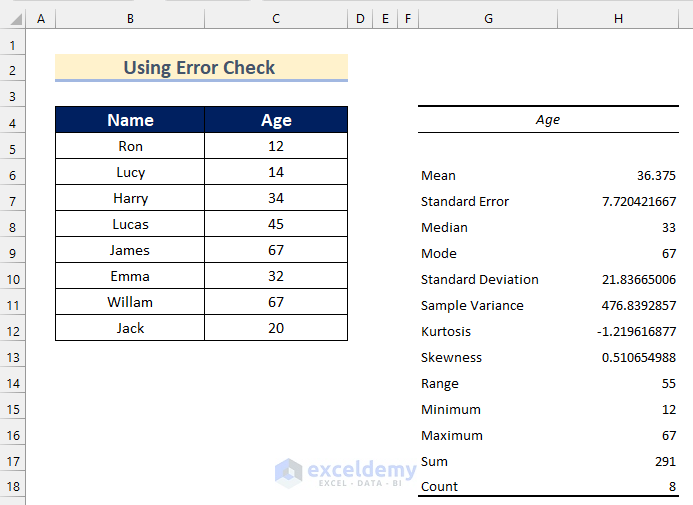
- Follow the steps shown in Method 1 to insert Descriptive Statistical analysis of the dataset.
- You will get your desired Descriptive Statistics of the given data.
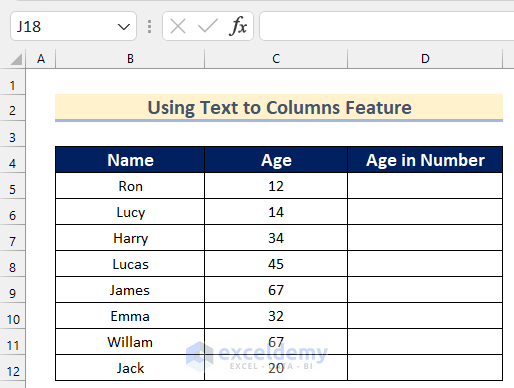
Method 4 – Convert Text to Numeric Data with Text to Columns Feature
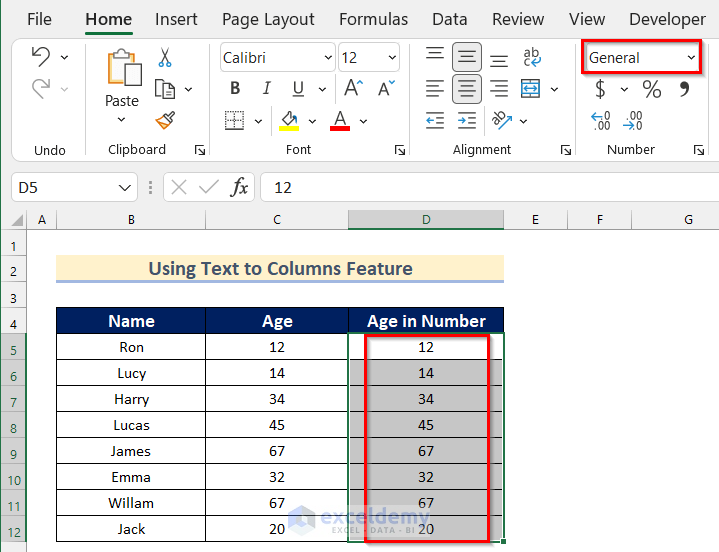
The sample dataset below has an additional column named Age in Number to input the Numerical data.
Steps:
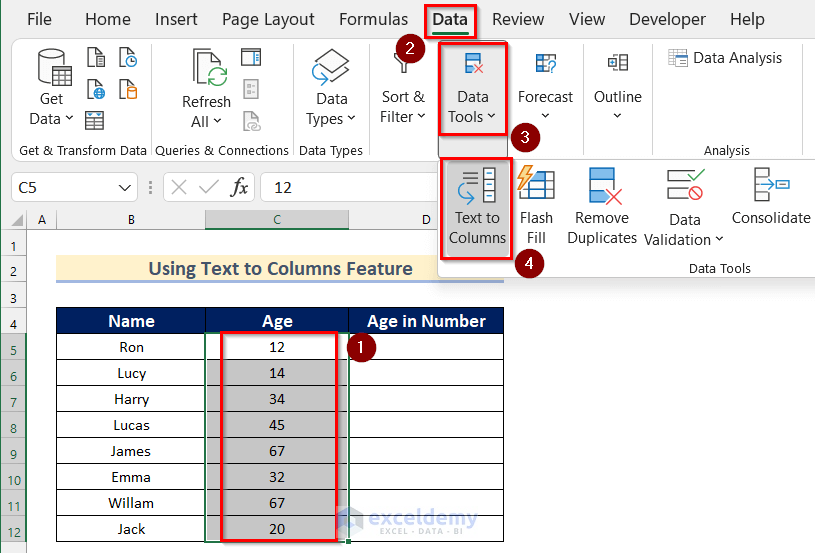
- Select Cell range C5:C12.
- Go to the Data tab >> click on Data Tools >> select Text to Columns.
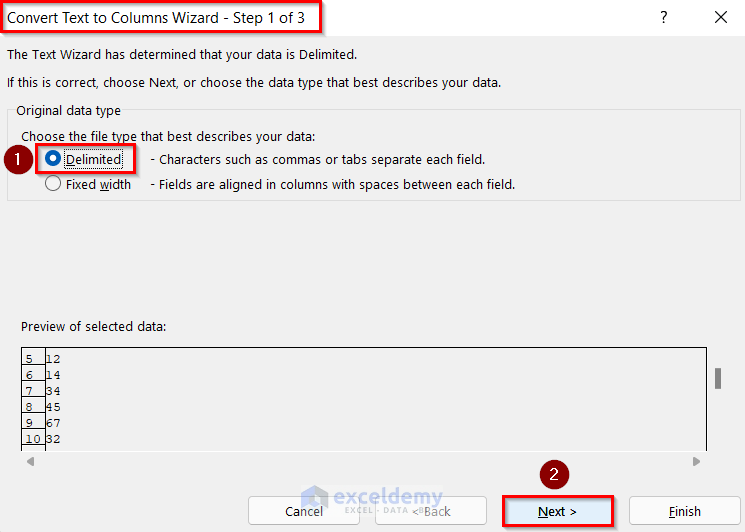
- The Convert Text to Columns Wizard box will appear.
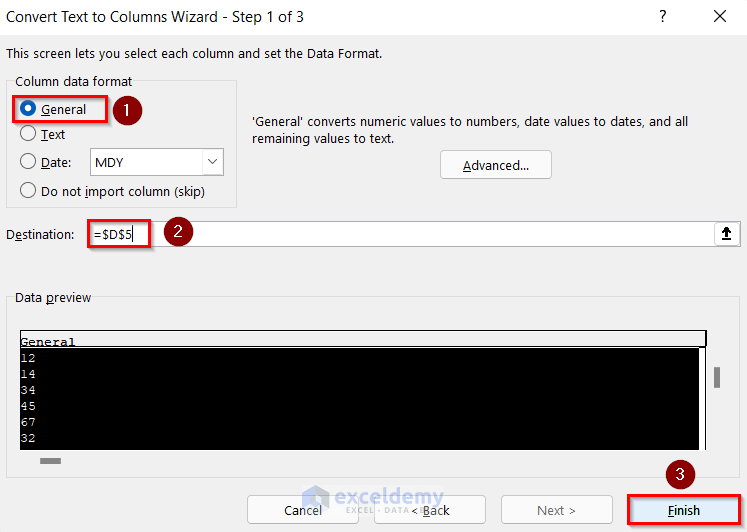
- Select Delimited.
- Click on Next.
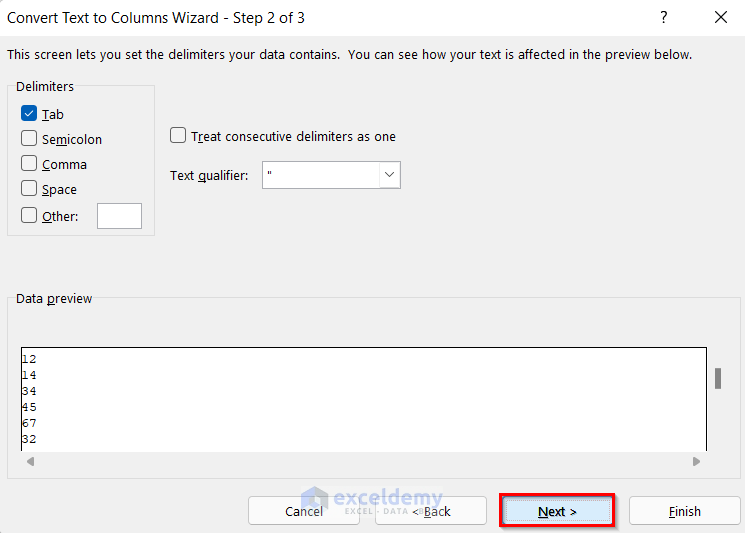
- Click on Next.
- Select General as Column data format.
- Input Cell D5 as Destination.
- Click on Finish.
- Cell range C5:C12 is in General Format.
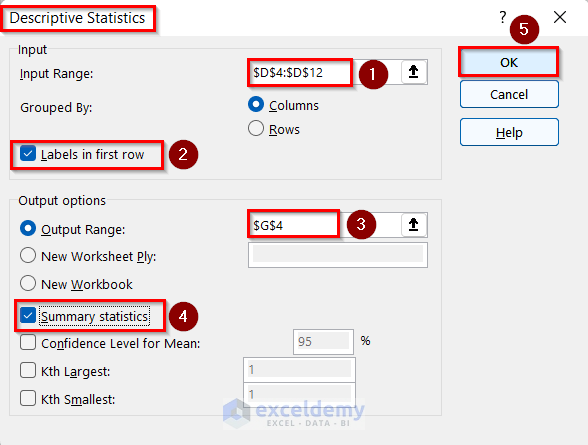
- Follow the steps shown in Method 1 to open the Descriptive Statistics box.
- Select Cell range D4:D12 as Input Range.
- Turn on Labels In first row option.
- Input Cell G4 as Output Range.
- Select any Statistical option. We will select Summary statistics.
- Click on OK.
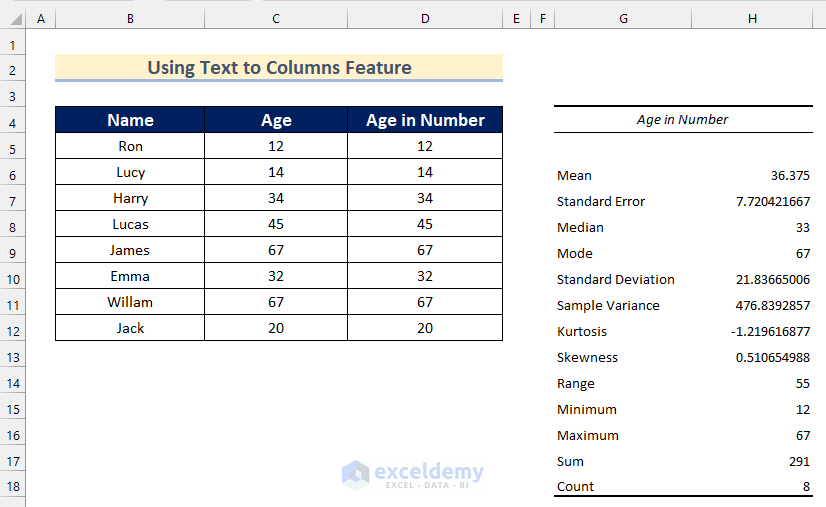
- You will get your desired Descriptive Statistics of the given data using the Text to Column Feature.
Read More: How to Get Summary Statistics in Excel
Method 5 – Use of Value Function
Steps:
- Select Cell D5.
- Insert the following formula.
=VALUE(C5)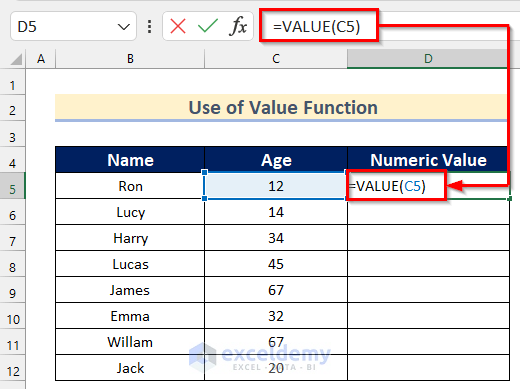
- Press ENTER.
- Drag down the Fill Handle tool to AutoFill the formula to the rest of the cells.
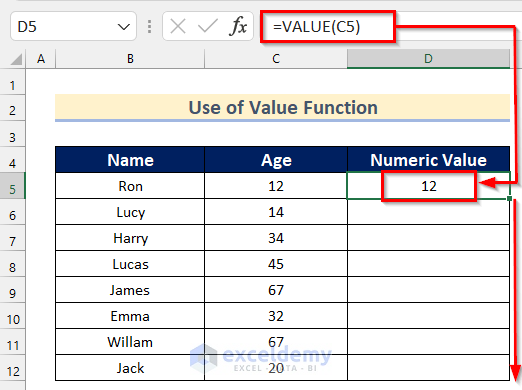
- You will get all the values of Age in General Format.
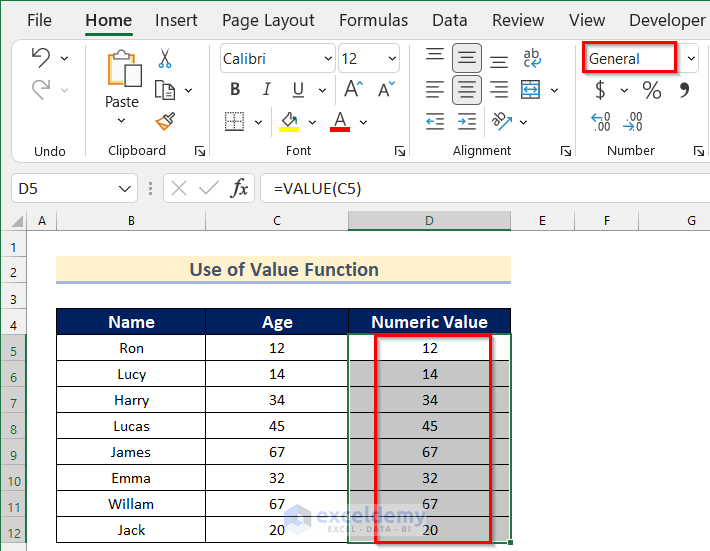
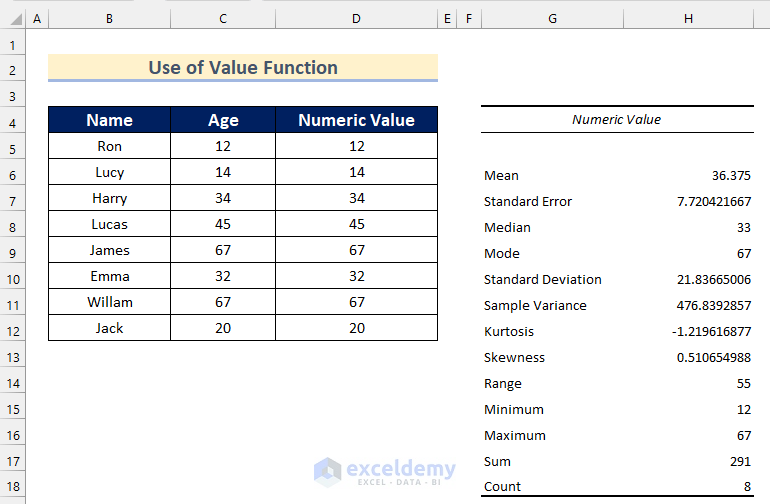
- Follow the steps shown in Method 3 to insert Descriptive Statistical analysis of the dataset.
- You will get your desired Descriptive Statistics of the given data using the Value Function.
Method 6 – Using Mathematical Operation
Steps:
- Select Cell D5.
- Insert the following formula.
=1*C5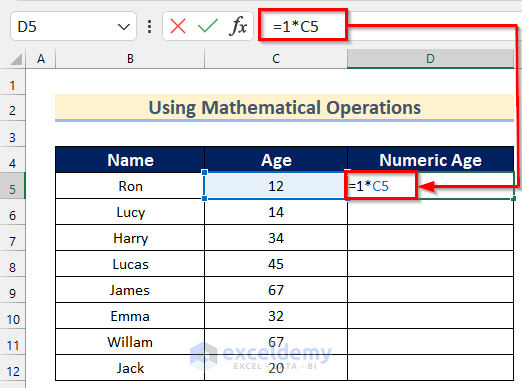
- Press ENTER.
- Drag down the Fill Handle tool to AutoFill the formula to the rest of the cells.
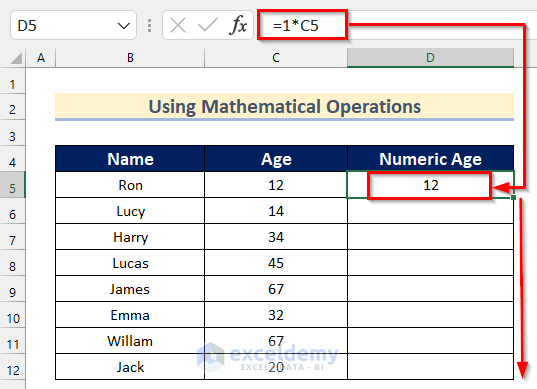
- You will get all the values of Age in General Format.
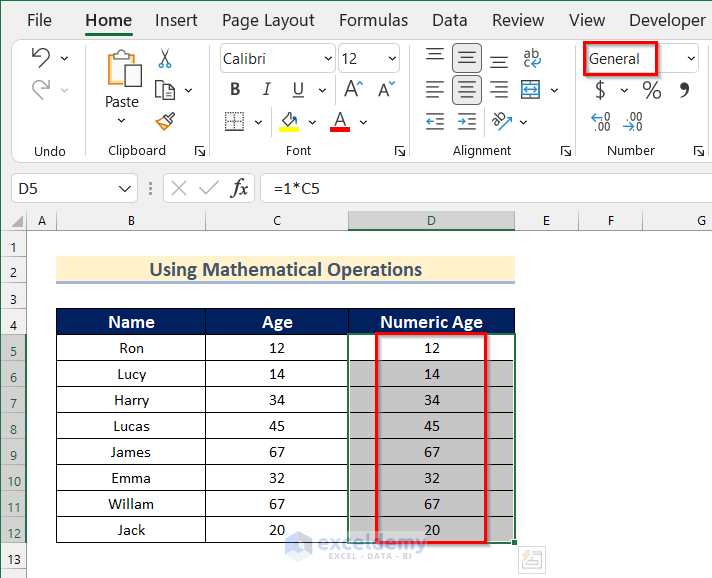
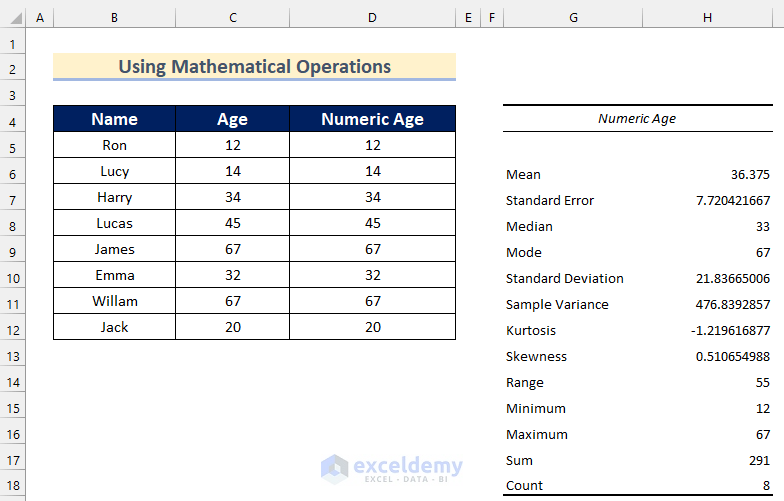
- Follow the steps shown in Method 3 to insert Descriptive Statistical analysis of the dataset.
- You will get your desired Descriptive Statistics of the given data using the Mathematical Operation.
Download Practice Workbook
<< Go Back to Excel for Statistics | Learn Excel
Get FREE Advanced Excel Exercises with Solutions!
