A scorecard is a powerful tool by which you can determine and visualize your company’s financials, customers, internal business, learning, and growth. In this article, we’ll demonstrate how to create a scorecard in Excel.
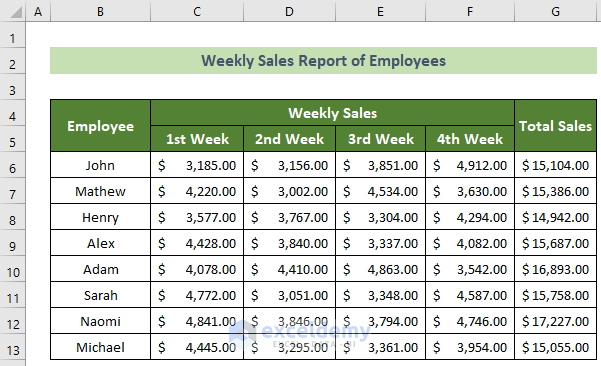
Suppose you have a weekly sales report for 8 employees and want to create a scorecard from their sales report.
In this article, we have used the Microsoft 365 version of Microsoft Excel, but you can use any other version available to you. If you face any problems implementing the steps below with another version, please leave a comment below.
Step 1 – Visualize Weekly Sales Scorecard with Conditional Formatting
First, lets create a weekly sales scorecard from the sales report.
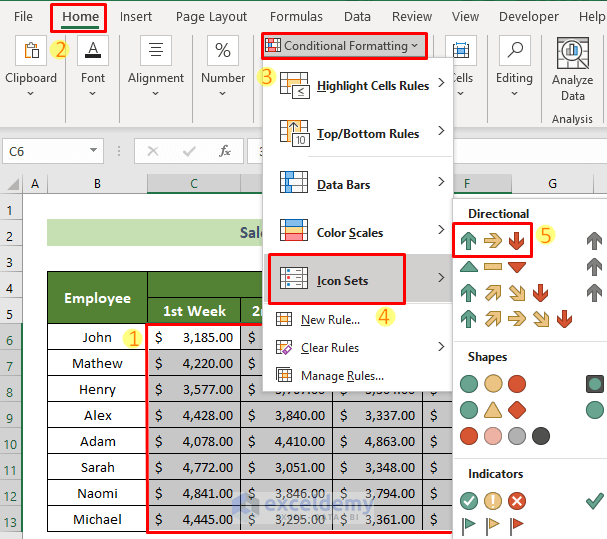
- Select cells C6:F13.
- Click the Home tab.
- Click the Conditional Formatting tool.
- Select Icon Sets from the drop-down.
- Select the first option from the Directional group.
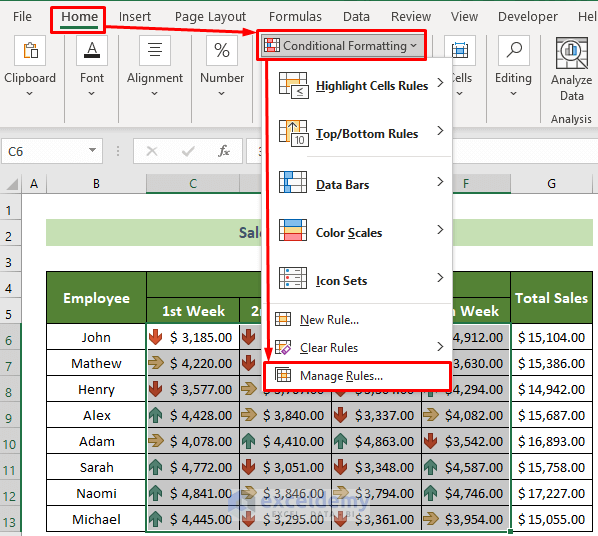
- Return to the Home tab.
- Select the Conditional Formatting tool again.
- Select Manage Rules from the drop-down.
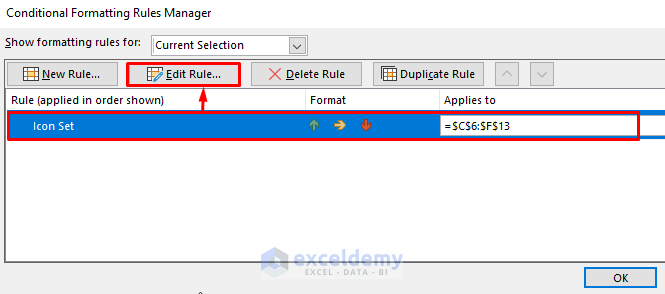
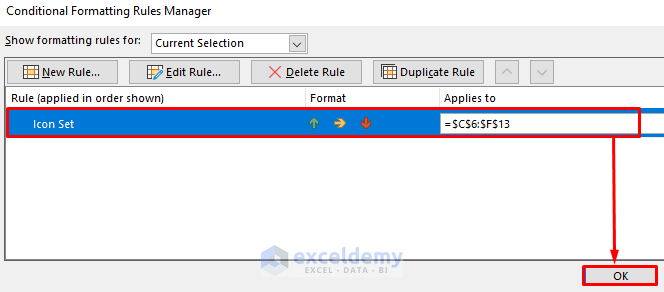
- The Conditional Formatting Rules Manager window appears.
- Select the Icon Set rule.
- Click the Edit Rule… button.
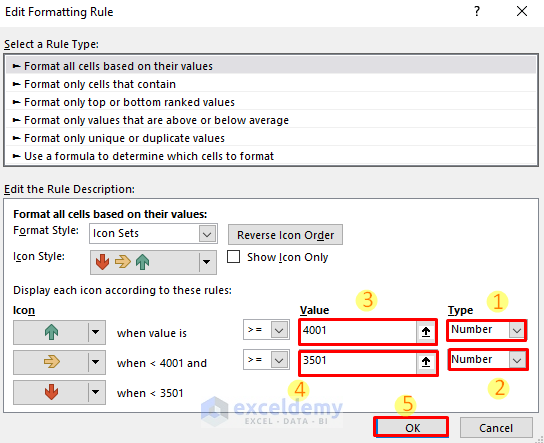
- The Edit Formatting Rule window appears.
- Select both types as Number in the Type option from the Icon group.
- For the green icon, enter 4001 in the Value box.
- For the yellow icon, enter 3501 in the Value box.
- Click OK.
- The Conditional Formatting Rules Manager appears again.
- Click OK.
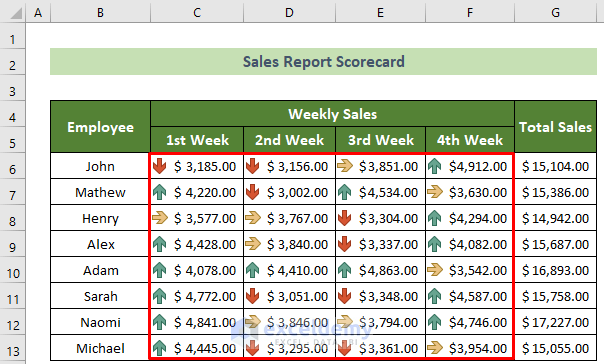
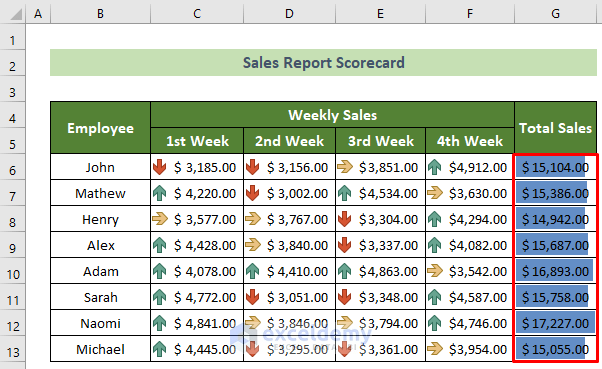
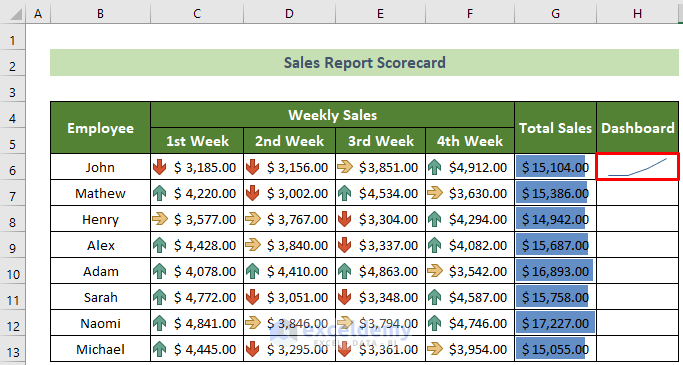
A weekly sales scorecard is created, which looks like this:
Step 2 – Create a Total Sales Scorecard Column Using Data Bars
- Select the range G6:G13.
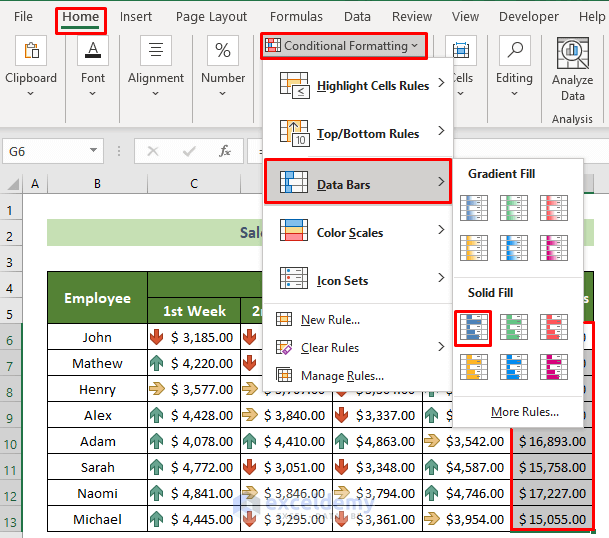
- Go to the Home tab.
- Select the Conditional Formatting tool.
- Select Data Bars from the drop-down.
- Select the first option from the Solid Fill option.
Data bars now appear in the Total Sales column:
Step 3 – Create a Dashboard to Record Sales Performance Trend with Sparklines
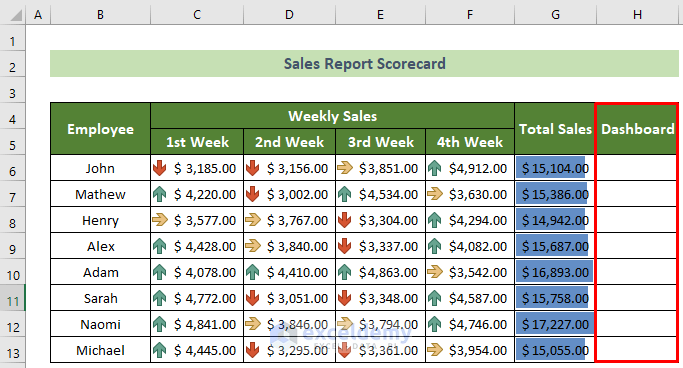
- Create a new column named Dashboard.
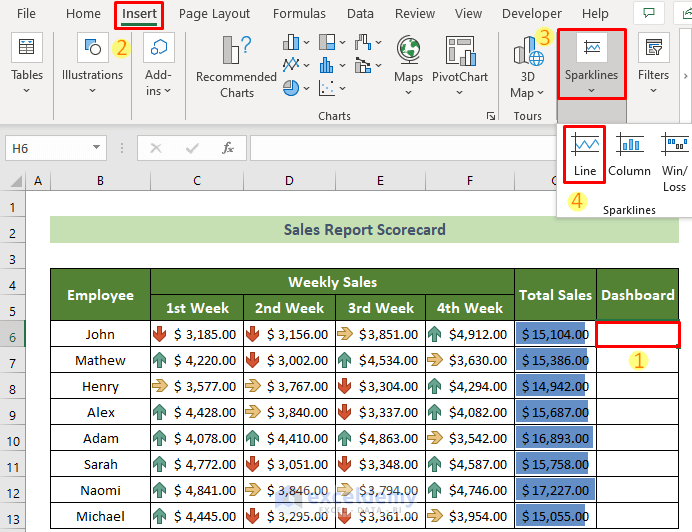
- Click on cell H6.
- Click the Insert tab.
- Click Sparklines.
- Select the Line tool from the drop-down.
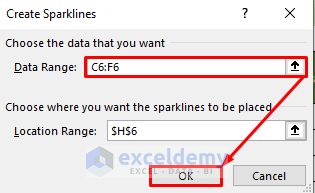
- The Create Sparklines window opens.
- In the Data Range: box, enter C6:F6.
- Click OK.
- The trendline for John appears in cell H6.
- Click on cell H6.
- Click the Sparkline tab.
- Tick options High Point and Low Point.
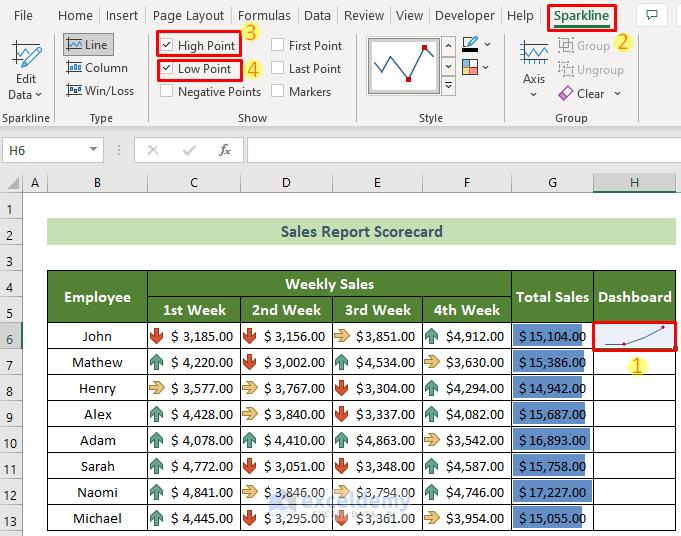
- The high and low points are now visible in the trendline.
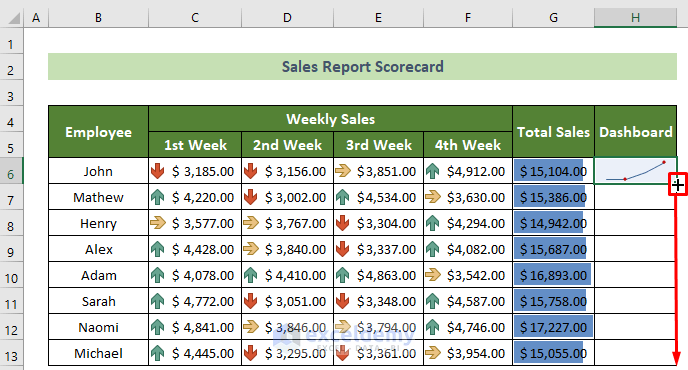
- Place your cursor on the bottom right position of cell H6.
- The Fill Handle appears. Drag it down to copy the trend to the other cells in the column.
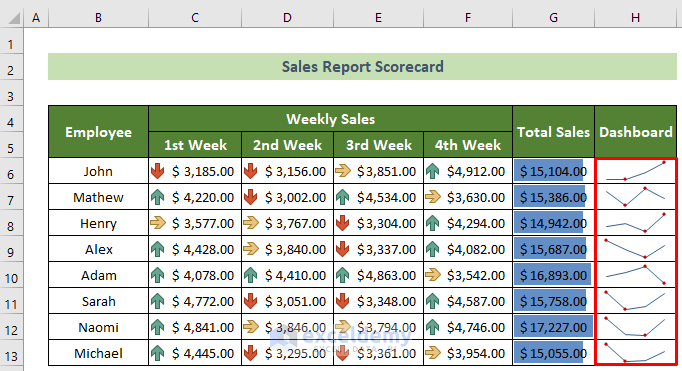
All employees’ trendlines are now visible and the scorecard is complete.
The final outcome should look like this:
<< Go Back to Scoring | Formula List | Learn Excel
Get FREE Advanced Excel Exercises with Solutions!

Thanks so much for all that you do to help to make us all more proficient at MS EXCEL!
Hello, Dan!
Thanks for your appreciation. It means a lot.
Regards
ExcelDemy
It’s very comprehensive tool.
Thanks,