Quality Score Overview
- Google Ads uses the Quality Score to evaluate the quality and relevance of your keywords, ad copy, and landing pages.
- The Quality Score is graded on a scale of 1 to 10, with 10 being the highest score.
- It impacts your Ad Rank and campaign performance.
Factors Considered for Quality Score
- Ad Relevance
- This evaluates how well your ad wording and related keywords match within your ad group.
- Avoid using the same ad for unrelated keywords (e.g., “content marketing agency” and “web design agency”).
- Check your keyword groups to ensure they are not too broad.
- Higher ad relevance leads to a better Quality Score.
- Landing Page Experience
- Assesses how well your landing page functions and its relevance to the user’s search.
- Five primary factors affect landing page experience:
- Relevant, useful, and original content.
- Transparency and trustworthiness.
- Easy navigation on all devices.
- Low landing page loading time.
- Site speed.
- Expected Click-through Rate (CTR)
- Predicts the likelihood that a user will click on your ad for a specific keyword.
- Assumes an exact match between the user’s search phrase and your keyword.
- Google adjusts this in real time based on search phrases, device type, and other auction parameters
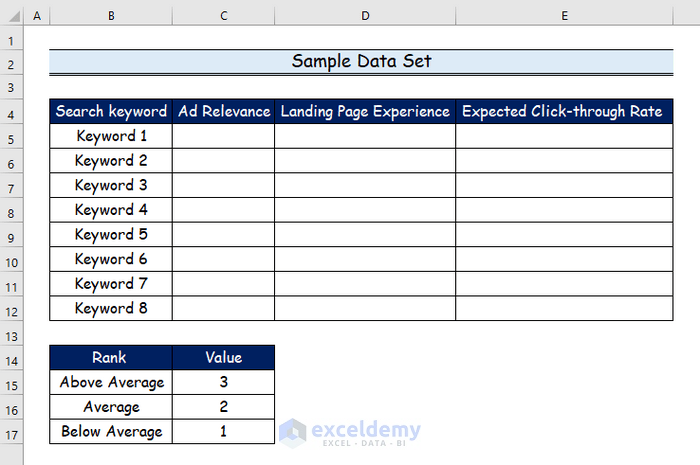
Sample Data Set for Excel Calculation
Let’s assume you have relevant data to calculate the Quality Score in Excel.
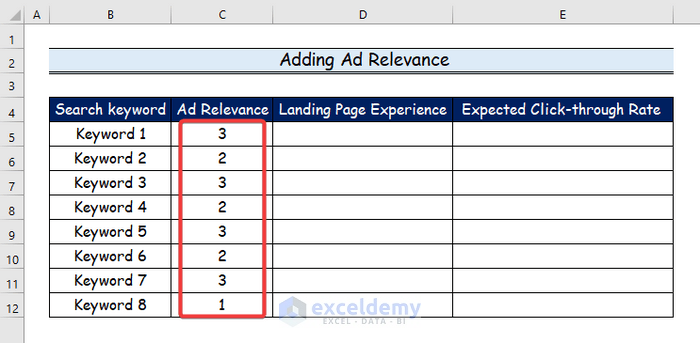
Step 1 – Ad Relevance
- Based on the favorable and unfavorable comments anticipated from the intended audience, an advertisement’s relevance score is determined.
- The more favorable interactions an ad is expected to receive, the higher its relevance score.
- We’ll add ad relevance values (e.g., above average, average, below average).
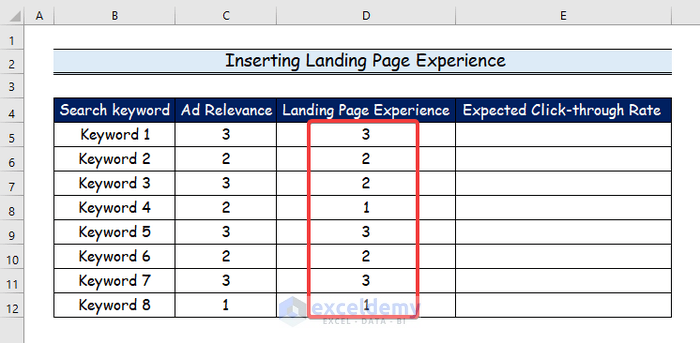
Step 2 – Landing Page Experience
- Google Ads uses a metric called landing page experience to assess how relevant and helpful your website’s landing page is for visitors who click on your ad.
- Higher-rated landing pages typically feature text relevant to user search queries.
- We’ll include landing page experience values (e.g., above average, average, below average).
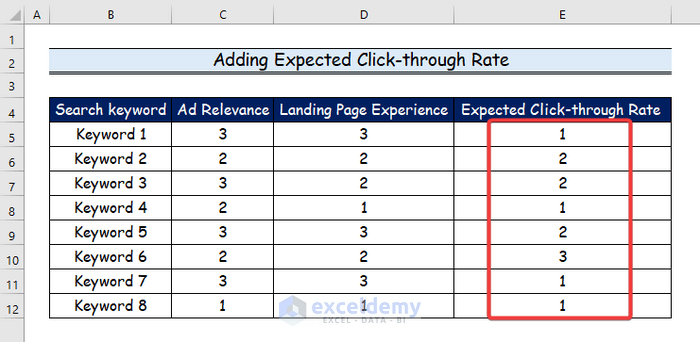
Step 3 – Expected Click-through Rate
- Expected CTR gauges the likelihood that your ads will be clicked when displayed for a given keyword, regardless of their position or other factors.
- We’ll list expected CTR values (e.g., above average, average, below average).
Step 4 – Calculating Total Weight
- Use the SUM function to calculate the total weight of ad relevance, landing page experience, and expected CTR for each keyword.
- For example, if your data is in cells C5 (ad relevance), D5 (landing page experience), and E5 (expected CTR) for keyword 1:
- In cell F5, enter:
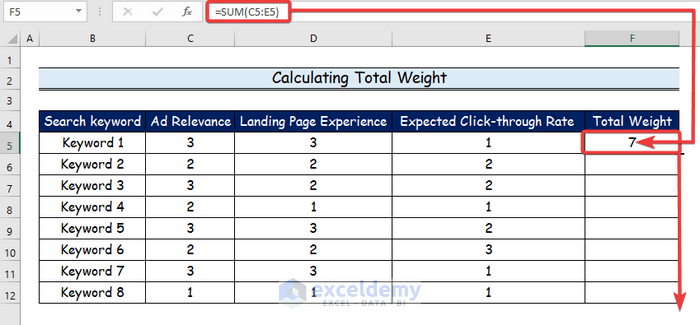
=SUM(C5:E5)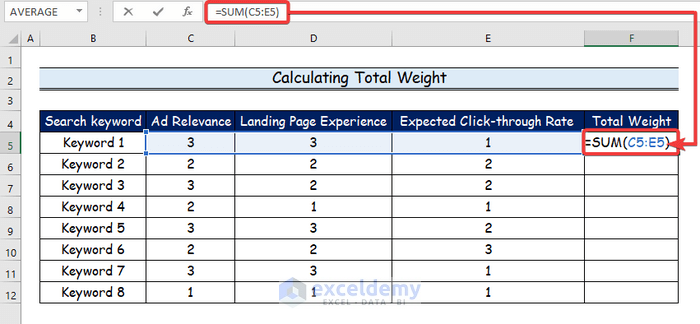
-
- Press Enter.
-
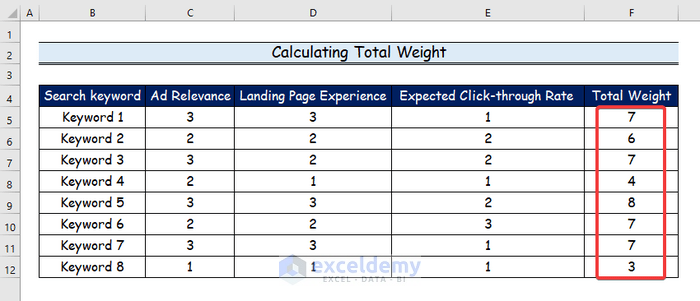
- Drag the formula down from F5 to F12 to get combined weights for all keywords.
- You will see the combined weights for each keyword’s ad relevancy, landing page experience, and anticipated click-through rate.
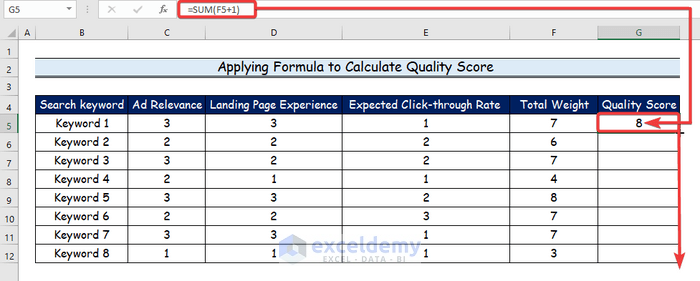
Step 5 – Applying Formula to Calculate Quality Score
- Quality Score (ranging from 1 to 10) helps gauge how well your ads compare to those of other advertisers.
- A higher Quality Score means your ad and landing page are more relevant and helpful.
- To calculate the Quality Score for keyword 1:
- In cell G5, enter:
=SUM(F5+1)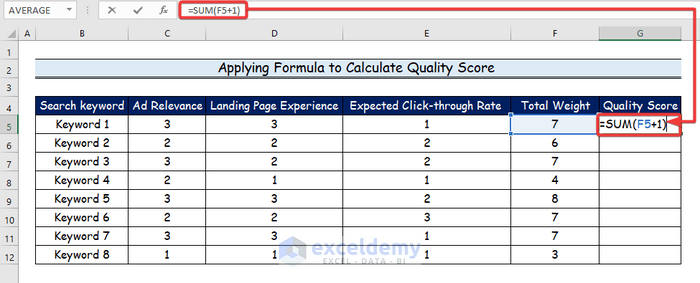
-
- Press Enter.
-
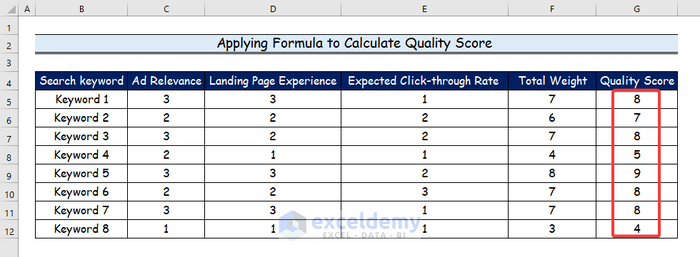
- Drag the formula down from G5 to G12 to get quality scores for all keywords.
- You will get the quality scores for each keyword’s ad relevance, landing page experience, and predicted click-through rate.
Download Practice Workbook
You can download the practice workbook from here:
<< Go Back to Scoring | Formula List | Learn Excel
Get FREE Advanced Excel Exercises with Solutions!
