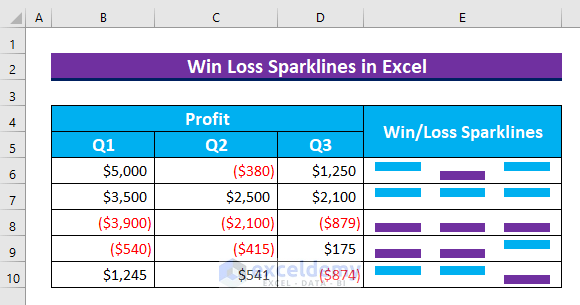
Sparklines show data patterns in a single cell in Excel. There are 3 types: Line, Column, and Win/Loss. These are a type of Column Chart showing only the positive and negative values with two colors. In this article, we are going to show you 2 methods to use the Win Loss Sparklines in Excel.
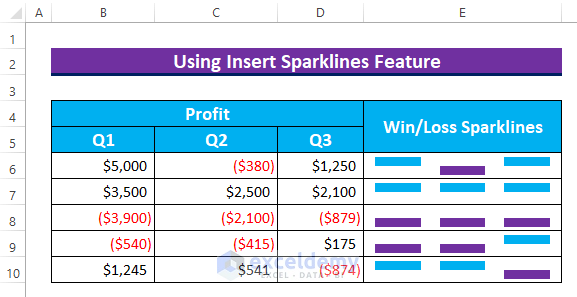
We will show you how to insert the Win Loss Sparklines and describe the various options that are available in this feature. To demonstrate our methods, we have picked a dataset with 4 columns that show Profits for 3 quarters and the Win/Loss Sparklines in the fourth column.
1. Utilizing Insert Tab to Use Win Loss Sparklines in Excel
In this section, first, we will show you how to use the Win Loss Sparklines by applying the Insert Sparkline command. Then, we will describe the available options for this feature.
Steps:
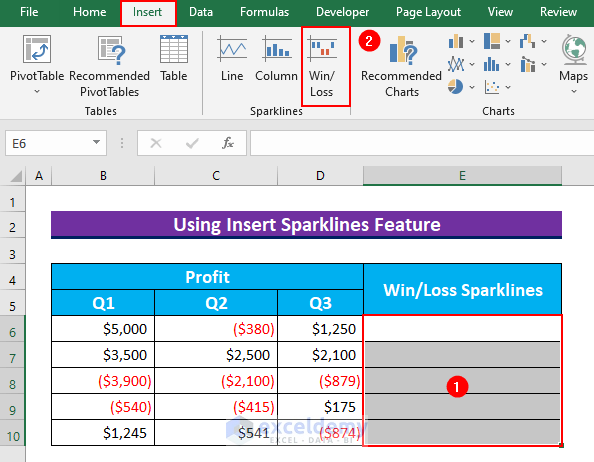
- At first, select the cell range E6:E10.
- Then, from the Insert tab → select Win/Loss.
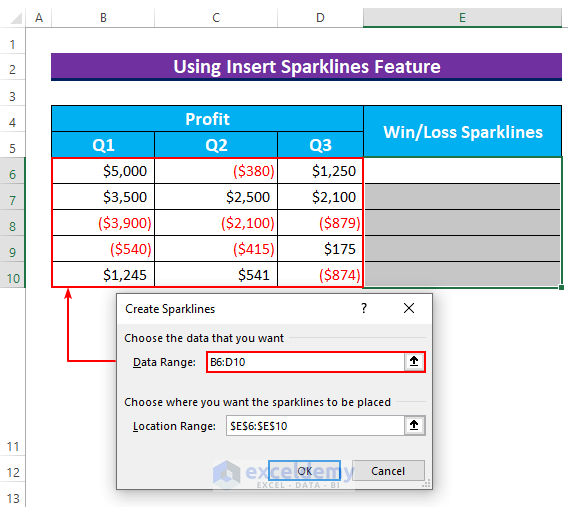
- So, the Create Sparklines dialog box will appear.
- It will set the selected range as the Location Range.
- Then, select the cell range B6:D10 as the Data Range and press OK.
- By doing so, the Win Loss Sparklines will appear for each cell. Here, the Blue color and the Red color denote positive and negative values respectively.
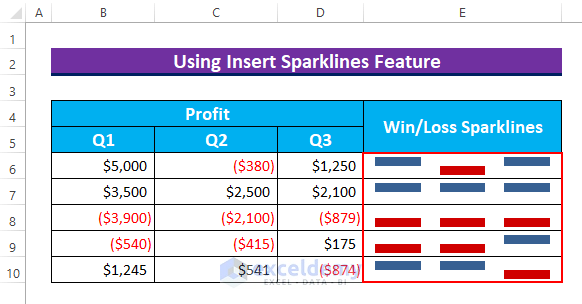
- Thus, we insert the Win/Loss Sparklines in Excel.
- Now, we will walk you through the features.
- Firstly, we have the option to edit the Location and Data Range of the Sparklines.
- Then, we can change the behavior of the Hidden & Empty Cells.
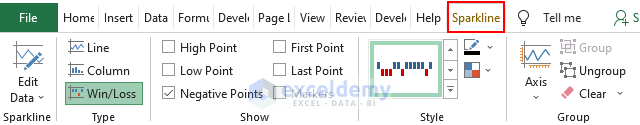
- After that, there is an option to change the Type of the Sparklines.
- Then, we can show the following in our Sparklines:
- High Point
- Low Point
- First Point
- Last Point
- Negative Points
- Markers
- Now, we click on the Hidden & Empty Cells option.
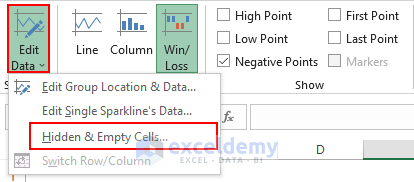
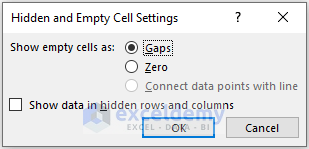
- So, a dialog box will pop up.
- Here, we have the option to show the empty cells as either Gaps or Zero. This option will not change the Win/Loss Sparklines, where a blank cell or 0 will yield only a gap in the Sparklines.
- Then, from the Style section, we can change the color of the Sparklines.
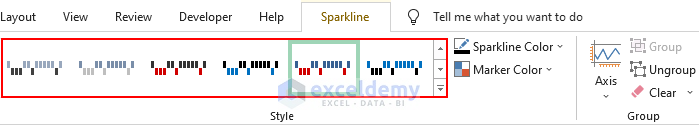
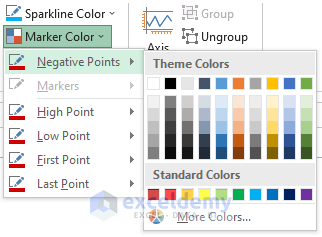
- After that, we have the option to change the Sparkline Color.
- Then, we can change the Marker Color of all points.
- Next, we change the color for both of them.
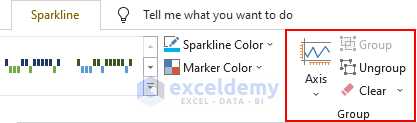
- Lastly, we can Ungroup the Sparklines using the Group section.
- Finally, after changing the colors the Win/Loss Sparklines will look similar to this.
Read More: How to Use Sparklines in Excel
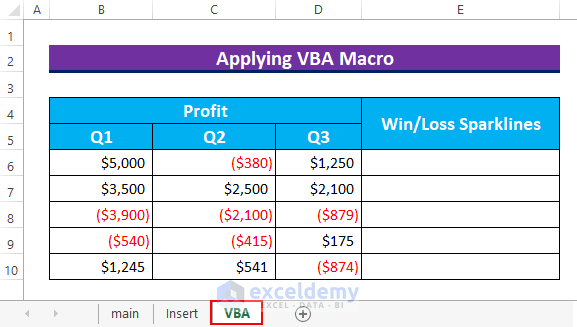
2. Applying VBA to Use Win Loss Sparklines in Excel
In this last method, we will show you how to apply an Excel VBA Macro to show the Win Loss Sparklines.
Steps:
- To begin with, press ALT+F11 to bring up the VBA window.
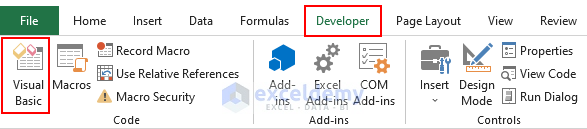
- Alternatively, we can do it by selecting Visual Basic from the Developer tab.
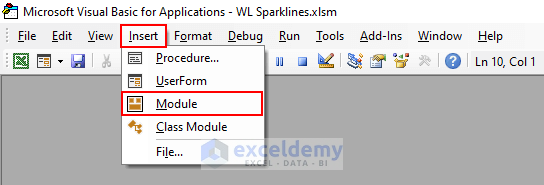
- Then, from Insert → select Module. We’ll type our code here.
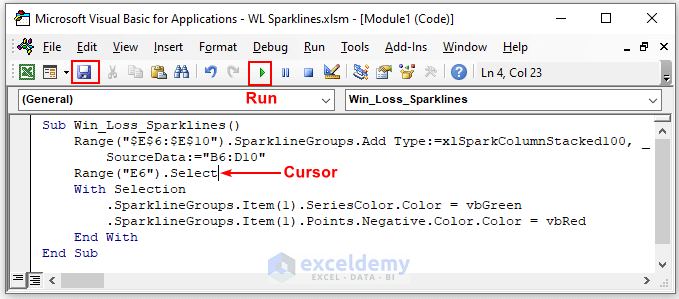
- Then, type the following code.
Sub Win_Loss_Sparklines()
    Range("$E$6:$E$10").SparklineGroups.Add Type:=xlSparkColumnStacked100, _
        SourceData:="B6:D10"
    Range("E6").Select
    With Selection
        .SparklineGroups.Item(1).SeriesColor.Color = vbGreen
        .SparklineGroups.Item(1).Points.Negative.Color.Color = vbRed
    End With
End Sub
VBA Code Breakdown
- First, we are calling our Sub procedure → Win_Loss_Sparklines.
- Next, we insert the xlSparkColumnStacked100 type Chart in the Active Sheet with the location range E6:E10 and the Data Range B6:D10.
- Then, we use the VBA With statement to change the colors of the Sparklines. Here, we have used the “vbGreen” for the positive values and the “vbRed” for the negative data points.
- Thus, this code works to create the Win/Loss Sparklines.
- Afterward, Save the Module.
- Then, put the cursor inside the first Sub procedure and press Run.
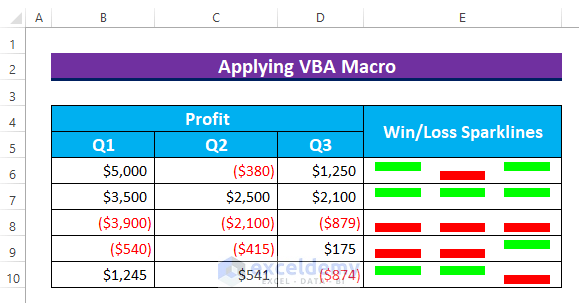
- So, our code will execute and it will create the Win Loss Sparklines in Excel.
Read More: How to Create Column Sparklines in Excel
Download Practice Workbook
Conclusion
We have shown you 2 handy approaches to how to use the Win Loss Sparklines in Excel. If you face any problems regarding these methods or have any feedback for me, feel free to comment below. Thanks for reading, keep excelling!
Related Articles
- Types of Sparklines in Excel
- How to Create Excel Sparkline for Multiple Data Ranges
- How to Add Markers to Sparklines in Excel
<< Go Back to Excel Sparklines | Learn Excel
Get FREE Advanced Excel Exercises with Solutions!
