Create a Bar Chart in Excel
Aug 13, 2024
This is an overview:
Step 1 - Preparing the Dataset
The sample dataset showcases sales data of the “iPhone 14 Plus” in December 2022 in ...
Jun 17, 2024
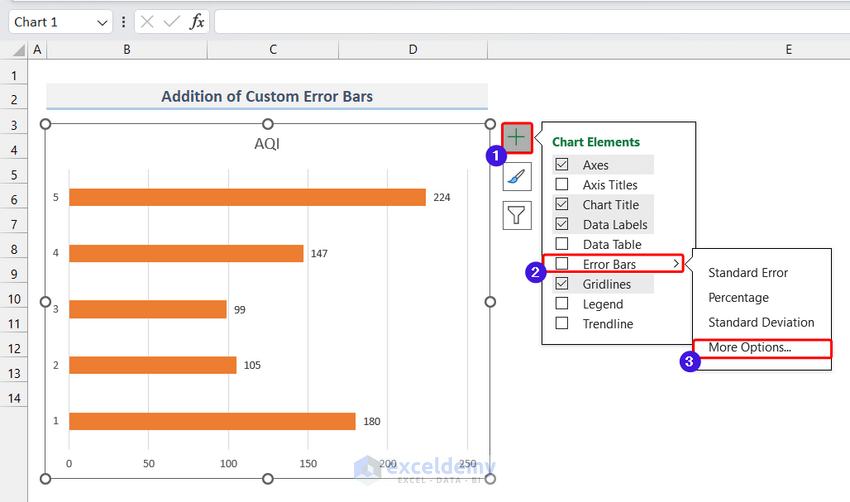
The dataset below contains measurements of the Air Quality Index of Kyiv, the capital of Ukraine.
To create a bar chart, select the AQI column ...
Jul 6, 2024
Step 1 - Prepare the Dataset
The dataset needs to contain the task schedule of a project.
Column B contains the various tasks.
...
Nov 11, 2025
Sometimes for data visualization, you may need to create a floating bar chart in Excel. So, if you are looking for how to make this chart in Excel, ...
Jul 6, 2024
Step 1 - Create Custom Combo Chart
Select the dataset.
Select “Create Custom Combo Chart” from the “Insert Combo Chart” menu under the ...
Jul 6, 2024
STEP 1 - Create Dataset for Bar Chart with Multiple Categories
Create a dataset for the bar chart that includes categories, sub-categories, and ...
Aug 8, 2024
Consider the Yearly Sales Data dataset, containing “Location”, and “Years 2020”, “2021” and “2022” .
Example 1 - Creating a 3D ...
Jul 15, 2024
Dataset Overview
We'll use the following dataset, representing the values of half-yearly sales in the years 2020 and 2021 of a company, to ...
Jul 4, 2024
Method 1 - Using the Insert Chart Feature to Create a Bar Chart with Multiple Bars
Step 1 - Inserting a 3-D Clustered Bar Chart
We ...
Jul 3, 2024
Method 1 - Insertion of Chart Using Dataset to Make a Double Bar Graph
We need to make the double bar graph of the following dataset.
Select ...
Jul 5, 2024
Watch Video – Make a Bar Graph Comparing Two Sets of Data
In the dataset, we have the profit amount of some products in the ...
Jul 6, 2024
Step 1 - Insert Data for Bar Graph
We will insert data for the Week and the Sales columns.
Select Range B5:C9.
Go to the Insert tab.
...
Aug 3, 2024
The dataset showcases products that were returned for different reasons and the Refund Status (set to Yes or No).
To create a Bar Graph using this ...
Aug 8, 2024
Types of Bar Graphs in Excel
There are two types of bar graphs: Horizontal (2-D/ 3-D bars) and Vertical (2-D/ 3-D Columns).
Bar ...
Nov 11, 2025
Looking for ways to know how to make a bar graph in Excel with 3 variables? Sometimes, we use bar graphs to visualize and compare our dataset more ...