This tutorial will demonstrate how to insert a sunburst chart in Excel. When dealing with lots of data, we often represent the data in a chart form in business meetings or to the viewers or readers. The commonly used chart is the sunburst chart in Excel. Sunburst Chart is actually for exhibiting hierarchical data. The chart represents a different portion of data in different outer rings which makes the data much more attractive and easy to understand for viewers and readers. So, it is essential to learn how to insert sunburst chart Excel.
What Is Sunburst Chart in Excel?
Sunburst Chart in Excel is the dominant way of publicizing data charts with many details. It can show every portion of the data by using rings. A different portion of rings represents different data values in the chart. The chart is an efficient way of visualizing how the outer rings are divided into many parts. We will demonstrate how to insert a sunburst chart in Excel in the next segment of our article.
We will demonstrate 2 easy examples to insert a sunburst chart in Excel. In this case, we have chosen the two most used cases. One is inserting charts for sales and the other is inserting charts for employees. The two examples are described below.
1. Inserting Sunburst Chart for Sales
We’ll use a sample dataset overview as an example in Excel to understand easily. If you follow the steps correctly, you should learn to insert a sunburst chart for sales in Excel.
Steps:
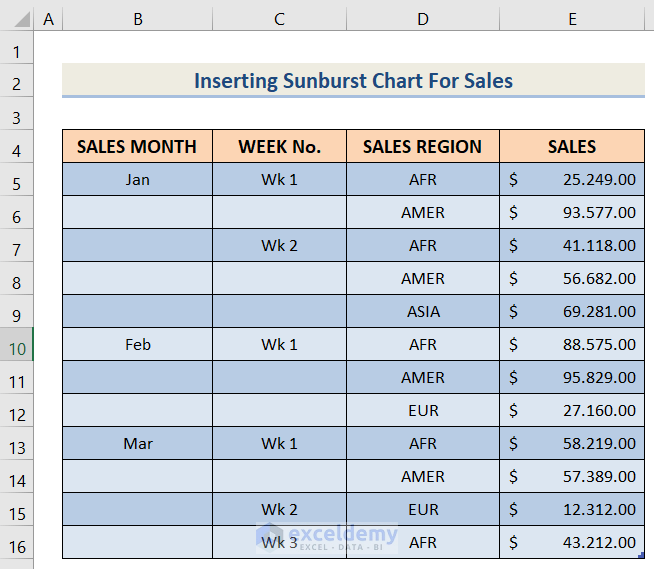
- Firstly, our goal is to arrange a dataset for inserting sunburst chart Excel. For this instance, we have the Sales Month in Column B, Week No., Sales Region, and Sales in sequential Columns C, D, and E. We will use this dataset for a better understanding of the next steps.
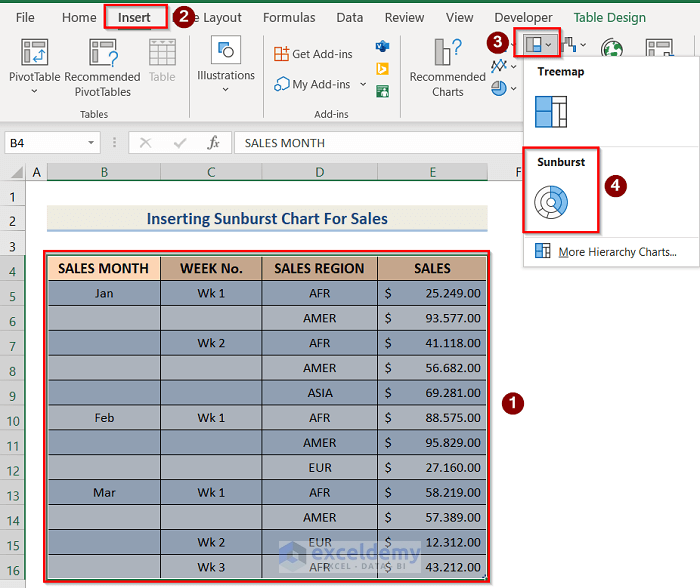
- Secondly, select the dataset and go to Insert >> Insert Hierarchy Chart >> Sunburst Chart options to insert the desired chart.
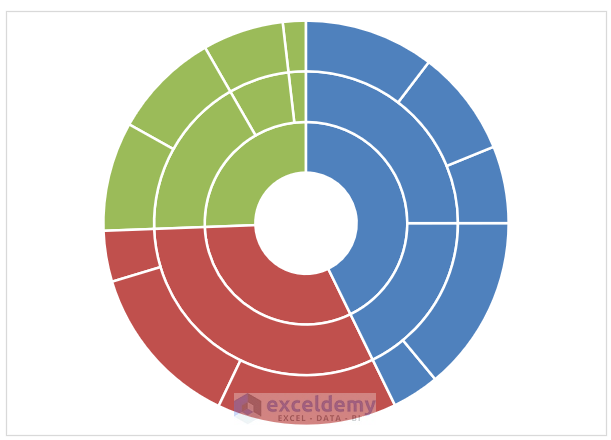
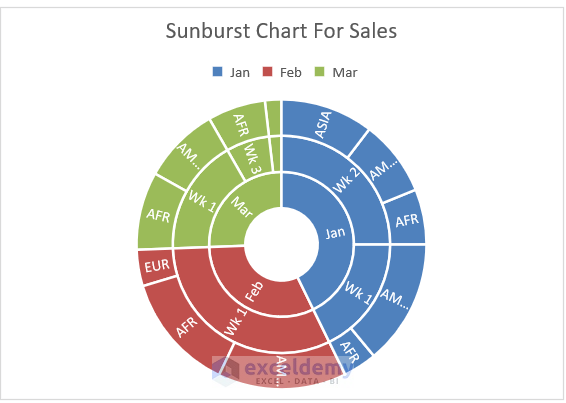
- Thirdly, you will get the desired chart.
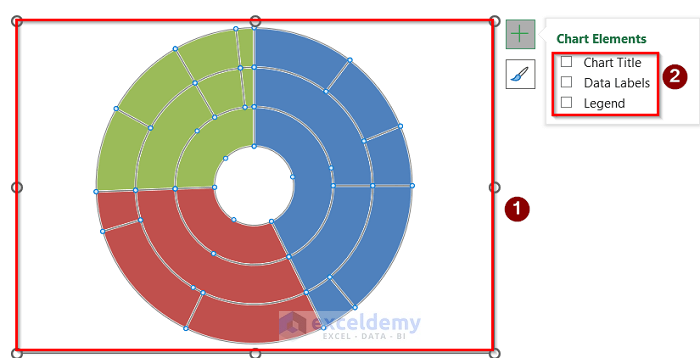
- Fourthly, after inserting the data sunburst chart, we have to add data labels and chart titles to represent the chart to the viewers or readers in a much more understandable way. We can easily do this by following the below steps. To begin with, select the inserted sunburst chart in Excel. Go to the Chart Elements option and select the Data Labels, Data Chart, and Legend options.
- Lastly, you will get the below result.
Read More: How to Insert Sunburst Chart with Conditional Formatting in Excel
2. Inserting Sunburst Chart for Employees
Now, we want to insert a sunburst chart for employees in Excel. If you follow the below steps correctly, you should learn how to insert sunburst chart Excel.
Steps:
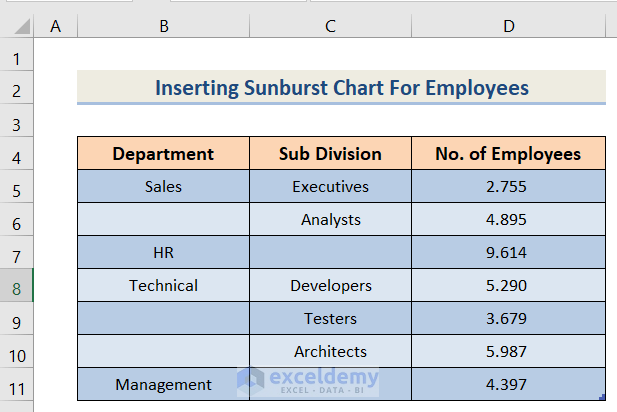
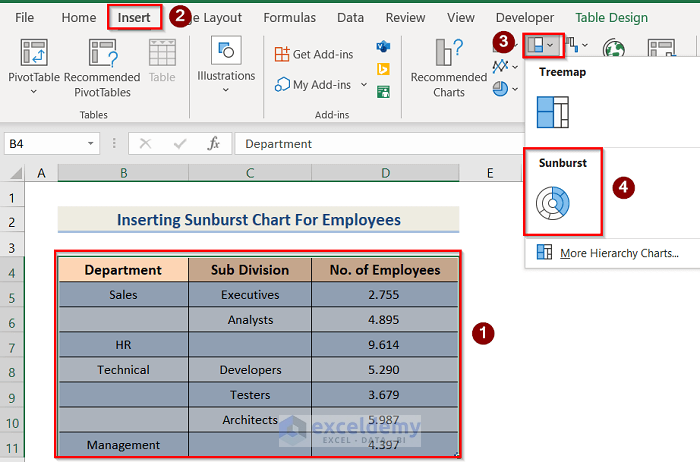
- In the beginning, our goal is to arrange a dataset for inserting sunburst chart Excel. For this instance, we have the Department in Column B, Sub Division, and No. of Employees, in sequential columns C and D. We will use this dataset for a better understanding of the next steps.
- Then, select the dataset and go to Insert > >Insert Hierarchy Chart> > Sunburst Chart options to insert the desired chart.
- Next, after that, like the previous method, if you add proper Chart Titles, Labels, and Legend, you will get the below result.

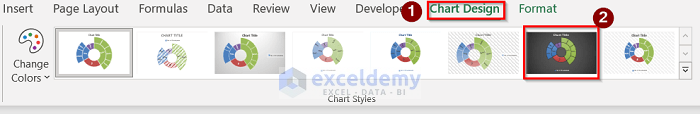
- Afterward, select the chart and go to the Chart Design option to select the proper chart design.
- Last, you will get the below result.

Read More: Create Sunburst Chart with Percentage in Excel
How to Rotate Sunburst Chart in Excel
In this case, our goal is to rotate the sunburst chart in Excel by following the below steps.
Steps:
- Firstly, arrange the dataset like the below image.

- In addition, follow the first method to insert a sunburst chart first like the below image.

- Besides, right-click on the data and then go to Sort >>Sort A to Z option to rotate the chart.

- Lastly, you will get the desired result.

Read More: How to Sort Excel Sunburst Chart Order
Things to Remember
- To find the Sunburst Chart option, you have to select the dataset and go to the Insert Tab, and select the Recommended Charts. The Sunburst Chart is located there.
- Data labeling and chart titles are essential in this chart. Otherwise, the chart can be misleading sometimes.
- You can format the chart as you wish by going to the Chart Design option.
- Legends in the chart must be put in a way that helps to understand the data.
Download Practice Workbook
You can download the practice workbook from here.
Conclusion
Henceforth, follow the above-described methods. Hopefully, these methods will help you to learn how to insert sunburst chart Excel. in excel. We will be glad to know if you can execute the task in any other way. Please feel free to add comments, suggestions, or questions in the section below if you have any confusion or face any problems. We will try our level best to solve the problem or work with your suggestions.
<< Go Back to Sunburst Chart in Excel | Excel Charts | Learn Excel
Get FREE Advanced Excel Exercises with Solutions!
