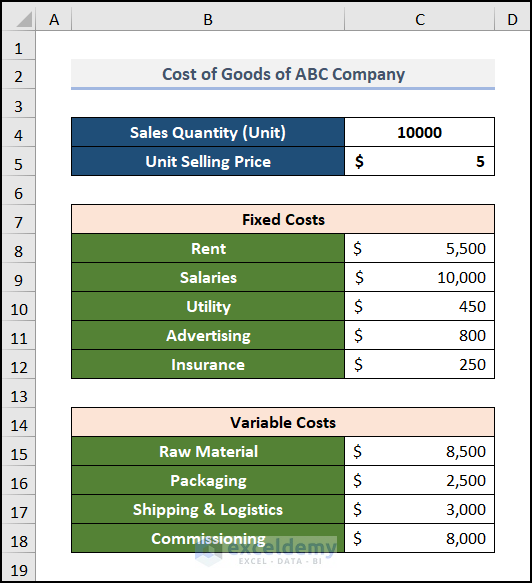
This dataset includes the Sales Quantity in units, the Unit Selling Price, the components of Fixed Cost, and the components of Variable Cost.
Step 1 – Calculate Different Cost Components
Steps:
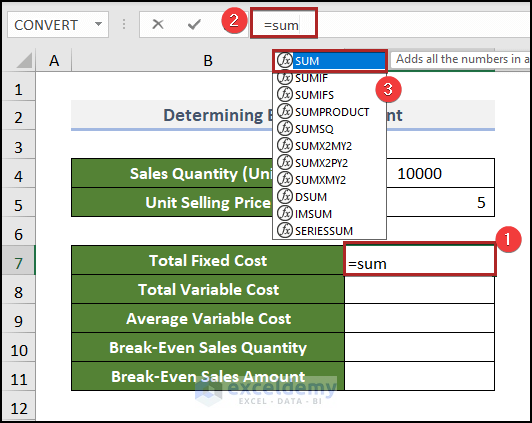
- Select C7 and enter the following.
=sum
- Double-click the SUM function to select it or press TAB.
- Select C8:C12 (the fixed cost).
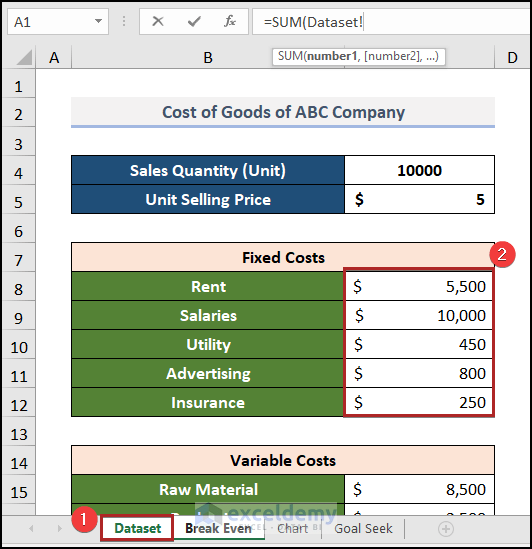
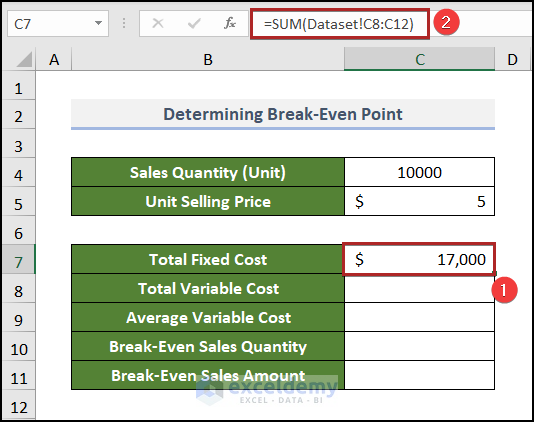
This is the formula for C7:
=SUM(Dataset!C8:C12)- Press ENTER.
Use this formula in C8 to find the Total Variable Cos.
=SUM(Dataset!C15:C18)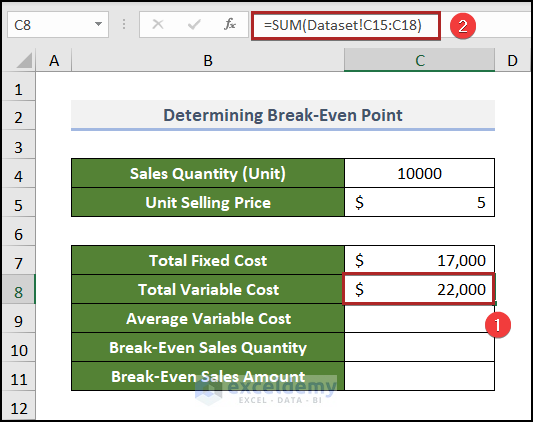
You can find the Average Variable Cost (the mean of the variable cost for each unit of product) by dividing the total variable cost by the total production unit. The formula is the following.
=C8/C4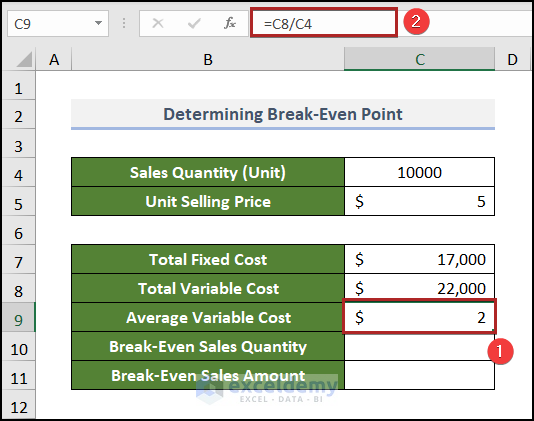
Read More: How to Calculate Break Even Analysis with Formula in Excel
Step 2 – Compute the Break-Even Point of Sales
Steps:
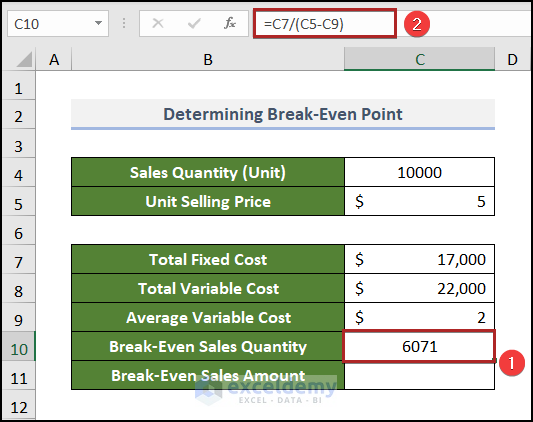
- Select C10 and enter the formula below.
=C7/(C5-C9)- Press ENTER.
- Go to C11 and enter the following formula.
=C7/((C5-C9)/C5)- Press ENTER.
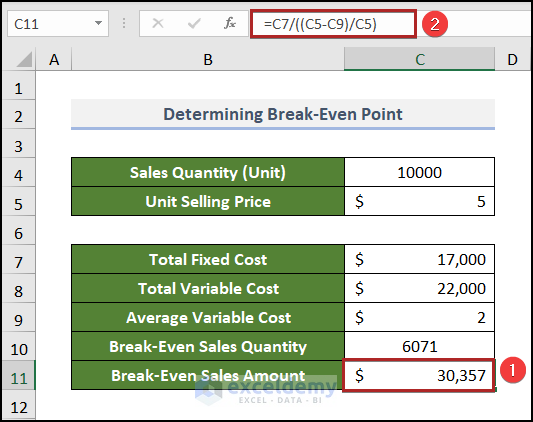
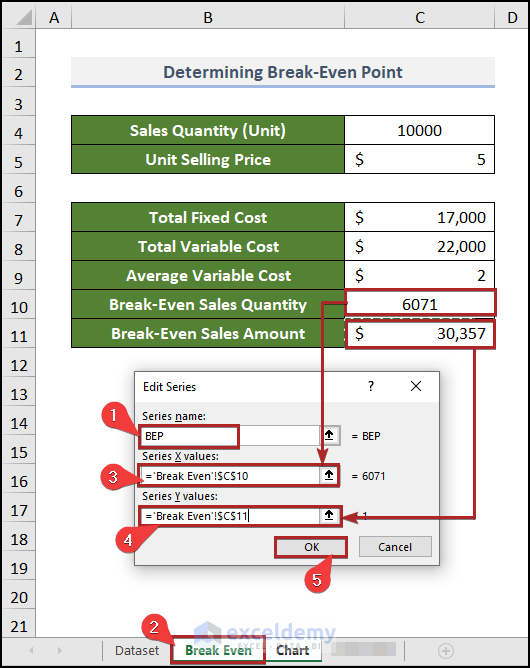
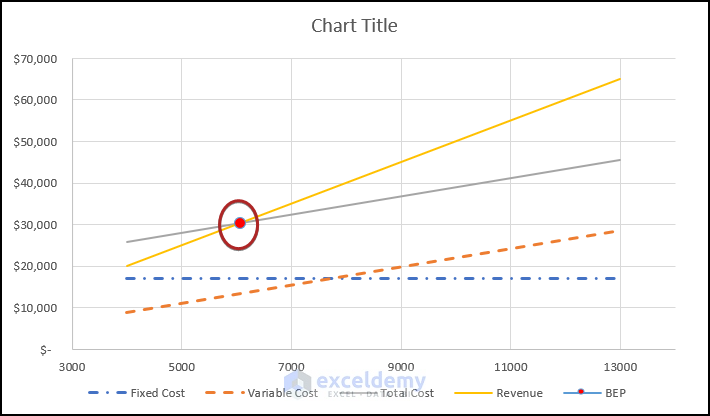
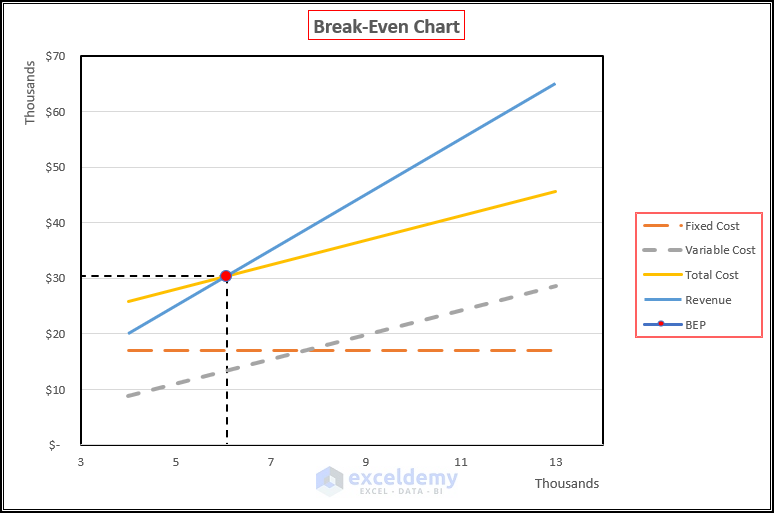
After selling 6071 units, the company will reach its break-even point. The sales amount will be $30,357.
Read More: How to Calculate Break-Even Sales with Formula in Excel
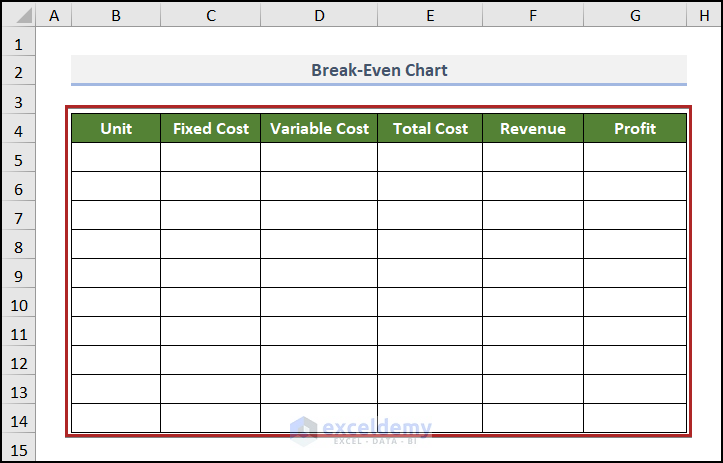
Step 3 – Create a Table of Costs, Revenue, and Profit
Steps:
- Create the basic outline of the table in B4:G14.
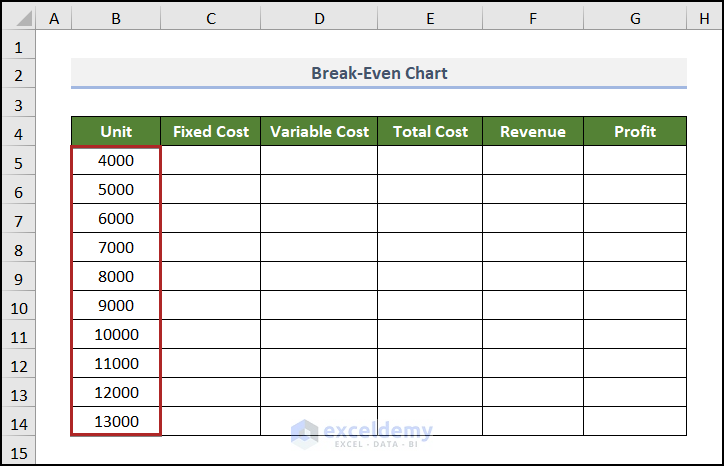
- Enter units in ascending order in the Unit column.
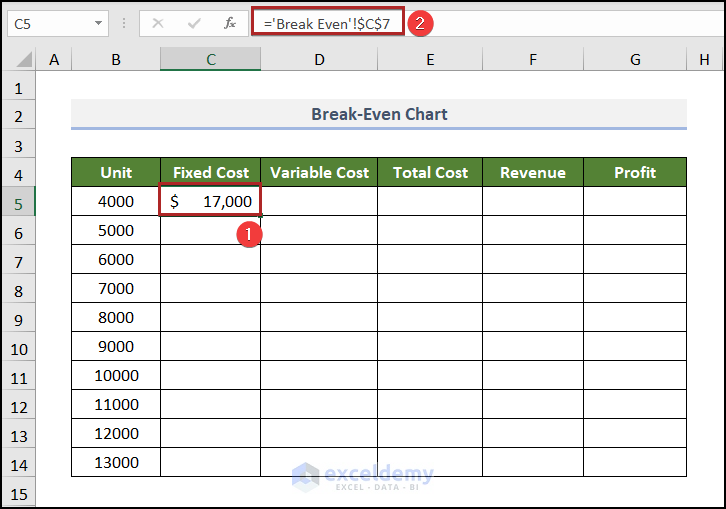
- Go to C5 and enter the following formula.
='Break Even'!$C$7- Press ENTER.
- Find the Fill Handle at the right-bottom corner of C5: a plus (+) sign.
- Double-click it.
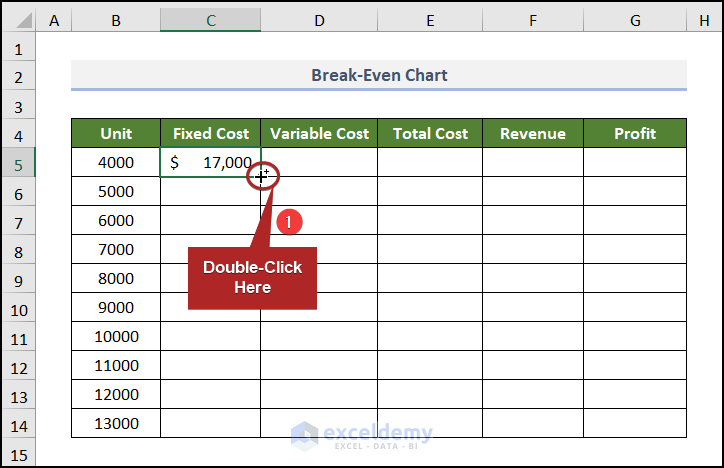
The other cells are automatically filled.

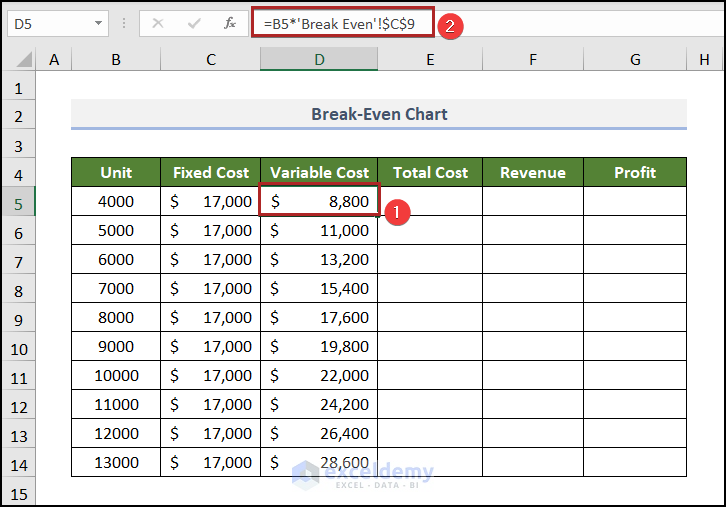
Select D5 and use the formula below.
=B5*'Break Even'!$C$9The number of Units was multiplied by the Average Variable Cost. An absolute cell reference was used.
Add the variable cost to the fixed cost to get the Total Cost in E5.
=C5+D5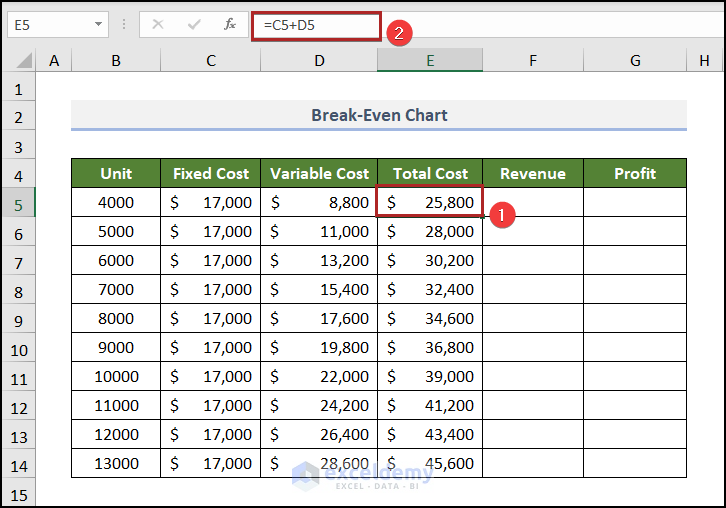
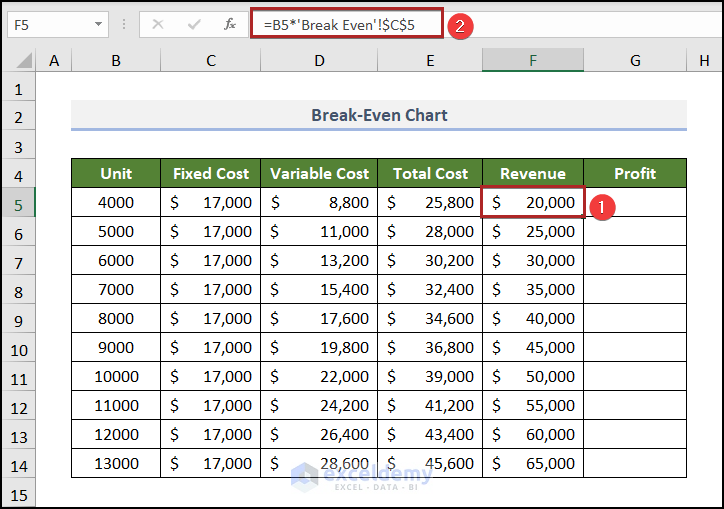
To find the Revenue, multiply the Units in B5 by the Unit Selling Price in C5 in the Break Even worksheet.
- Go to F5 and enter the formula below.
=B5*'Break Even'!$C$5- Press ENTER.
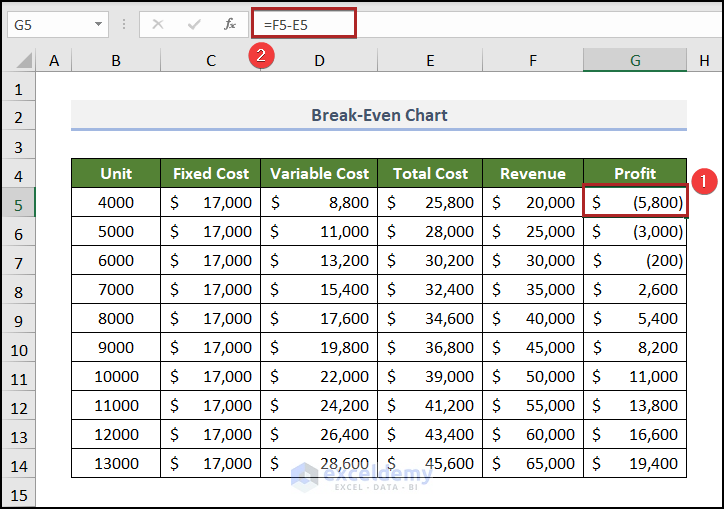
- Go to G5 and use the following formula.
=F5-E5- Press ENTER.
Step 4 – Insert Break-Even Chart
Steps:
- Select the table without the Profit column.
- In Insert, click Insert Scatter (X, Y) or Bubble Chart.
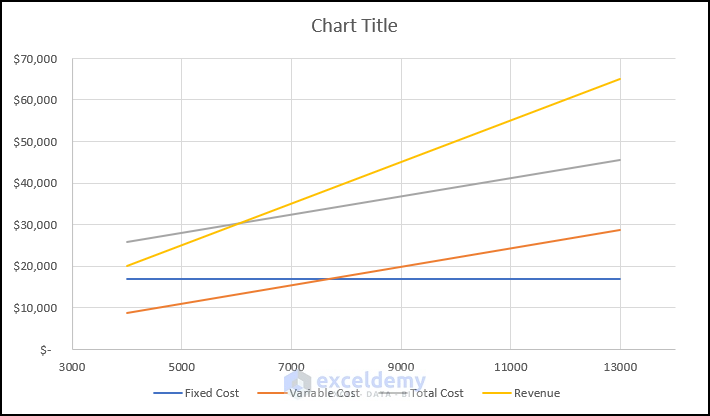
- Choose Scatter with Smooth Lines and Markers.
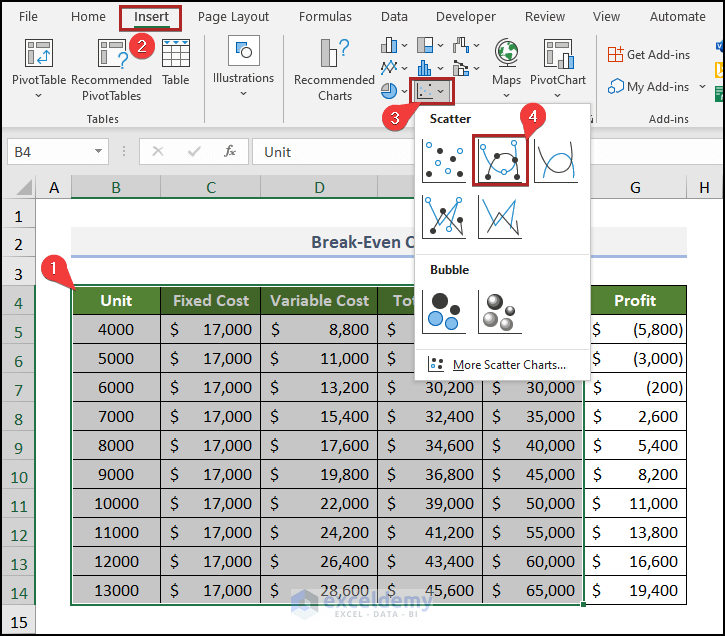
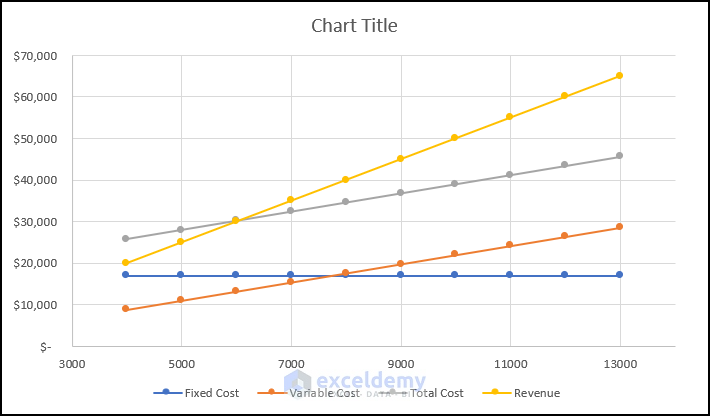
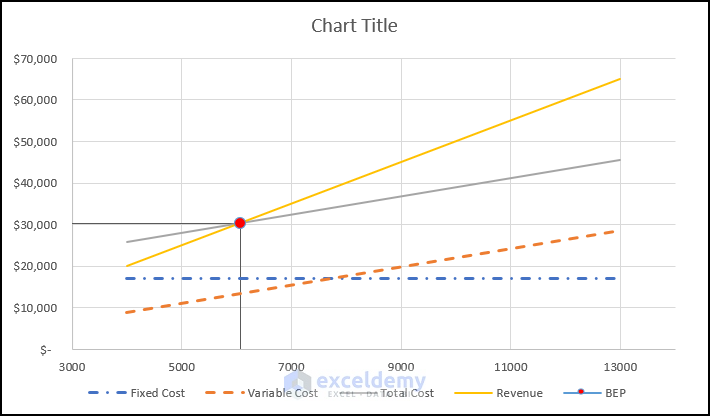
The chart will be displayed.
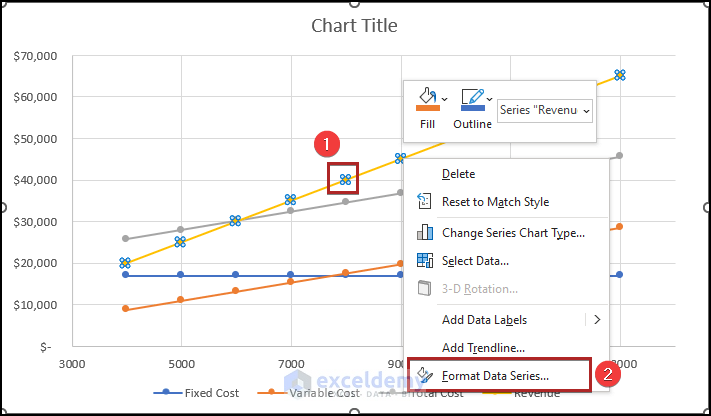
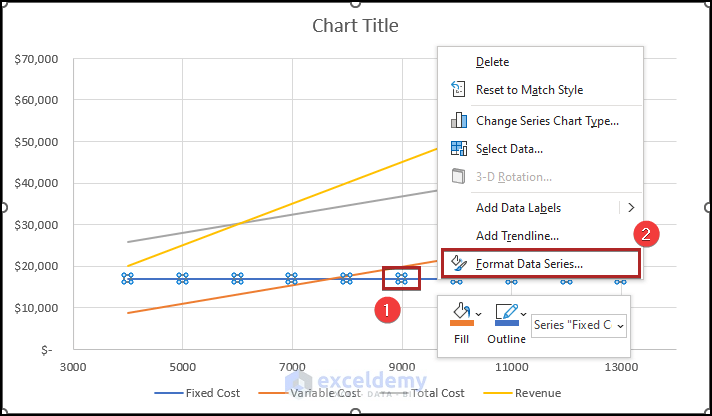
- Right-click the marker on the line of any series.
In the context menu:.
- Click Format Data Series… .
In Format Data Series :
- Click Fill & Line.
- Select Marker.
- Expand the Marker options and select None.
- Expand the Fill section and choose No fill.
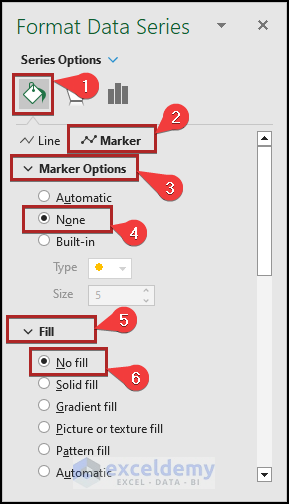
Follow the same procedure for the other series.
To distinguish the line of fixed and variable cost.
- Right-click the line of fixed cost.
- Select Format Data Series….
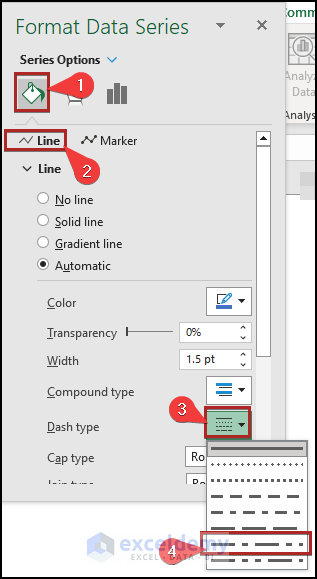
In Format Data Series:
- Click Fill & Line.
- In Line, set the Dash type as Long Dash Dot.
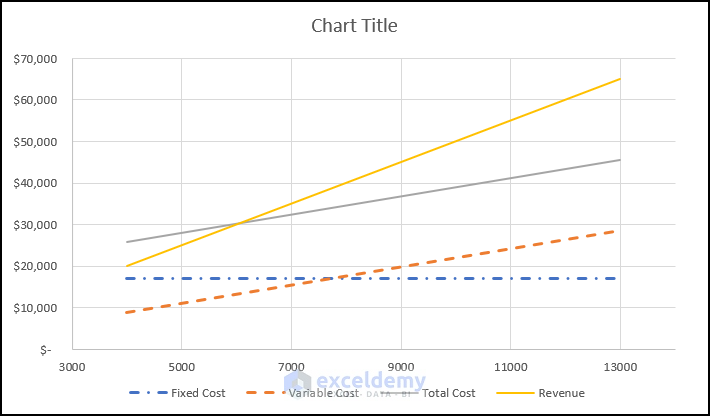
This is the output.
Step 5 – Determine the Break-Even Point in the Chart
Steps:
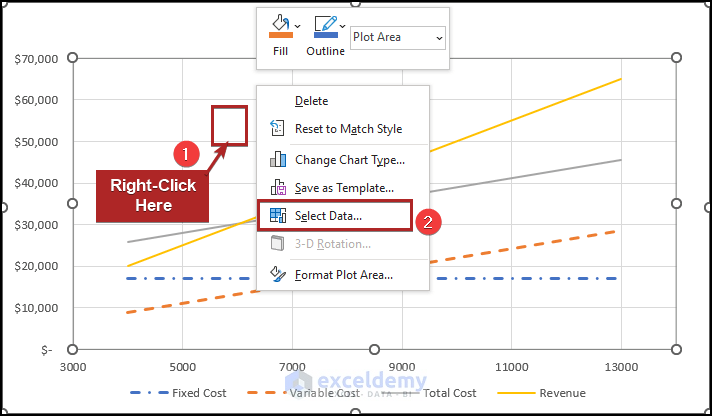
- Right-click inside the plot area.
- Choose Select Data… .
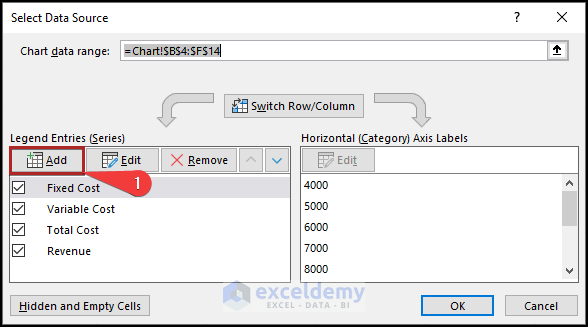
- Click Add in the Select Data Source dialog box.
In Edit Series:
- Enter BEP in Series name.
- Go to the Break Even worksheet and give the references of C10 and C11 in the Series X values and Series Y values.
- Click OK.
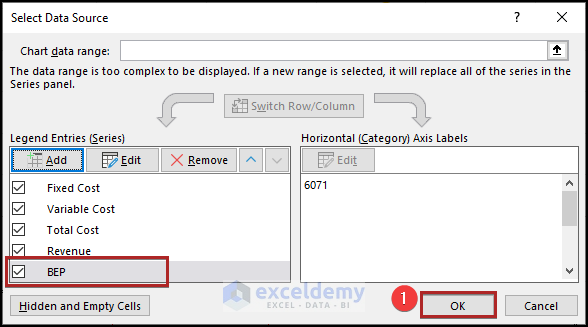
- Click OK.
- Open Format Data Series for the new series.
- Go to Marker options.
- Select Built-in and choose the circle marker in Type.
- Set the marker Size to 8.
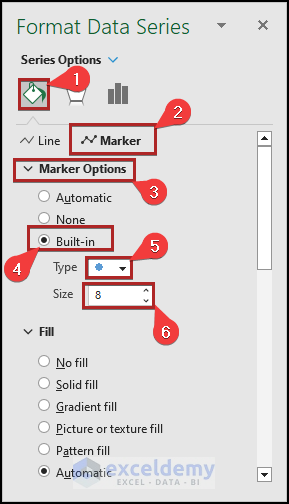
This is the output.
Step 6 – Apply a Break-Even Line
Steps:
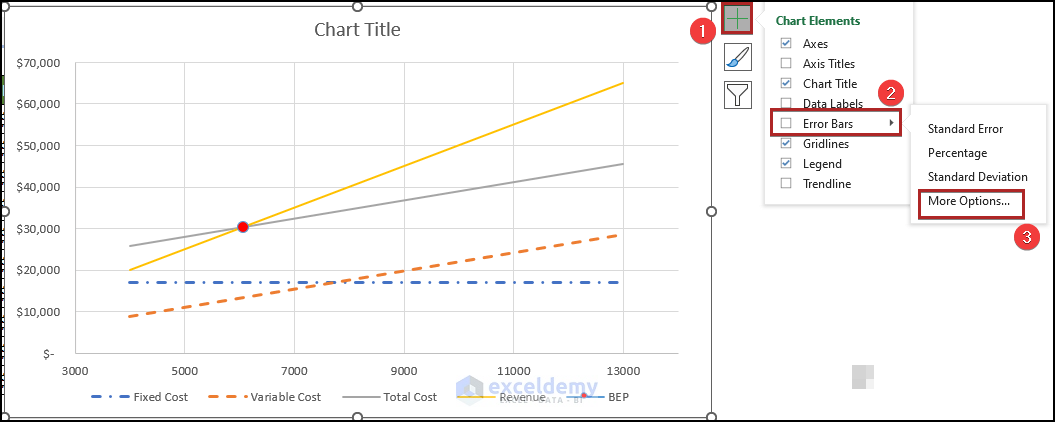
- Click the plus-shaped Chart Element icon.
- Click the arrowhead at the right of Error Bars.
- Select More Options….
In the Format Error Bars task pane:
- Select Error Bar Options.
- Choose Minus in Direction and No Cap in End Style.
- In Error Amount, select Percentage and set it to 100%.
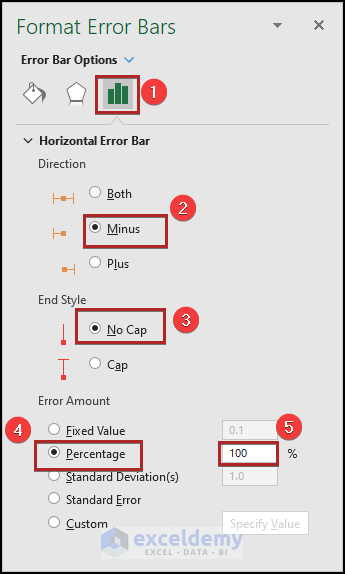
- Click the drop-down arrow in Error Bar Options.
- Select Series “BEP” Y Error Bars and follow the same procedure for the Vertical Error Bar.

This is the output.
Calculating the Selling Price at BEP (Break-Even Point) Using the Goal Seek Tool in Excel
To find the selling price of a product at the break-even point, you can use the Goal Seek feature of Excel.
Steps:
- To calculate the Revenue, enter the following formula in C9.
=C4*C5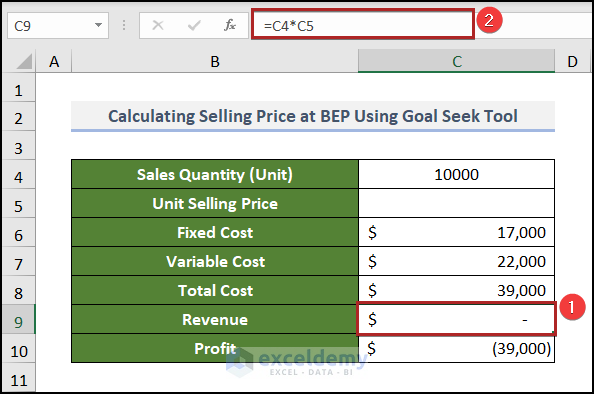
Use this formula to determine the Profit in C10.
=C9-C8
The break-even point is the condition of a company or business before it starts to gain profit.
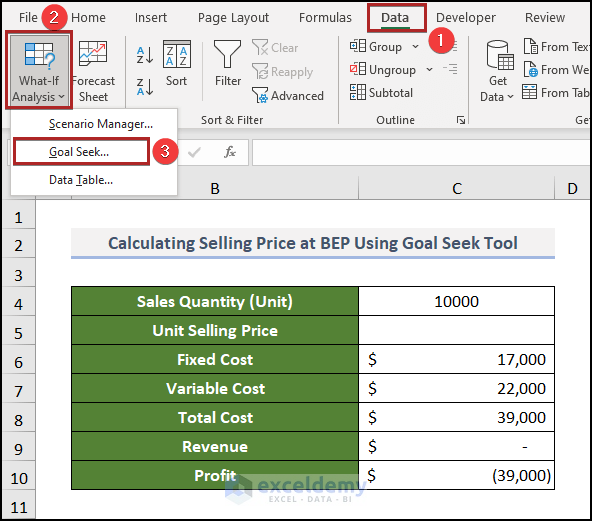
- Go to the Data tab.
- Click What-If-Analysis in Forecast.
- Select Goal Seek.
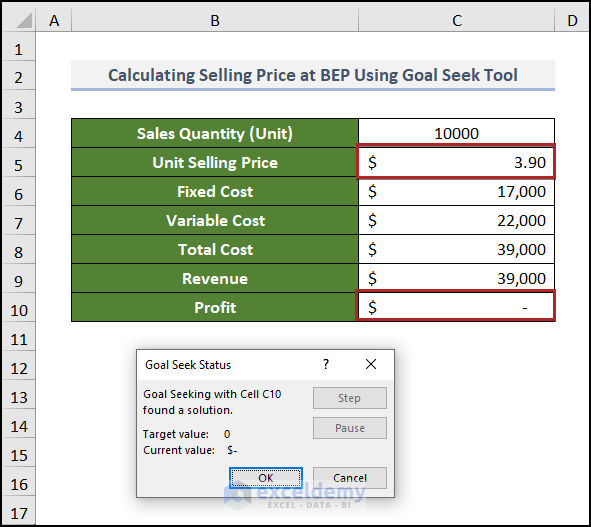
- In the Goal Seek dialog box, enter the references as shown below, and click OK.
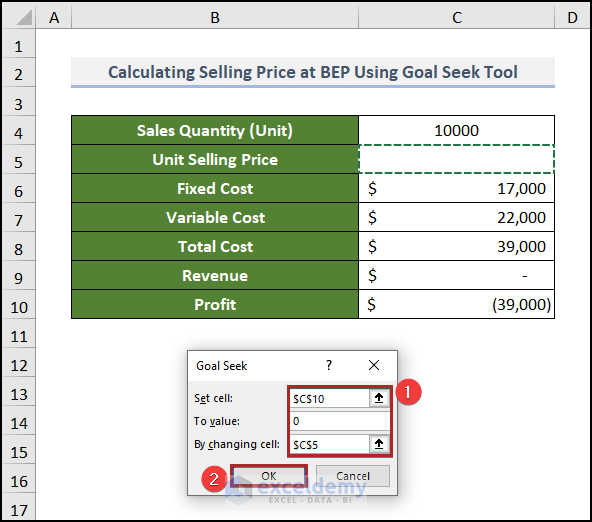
C10 is set as 0 by changing the value of C5.
The output is: 3.90 for Unit Selling Price.
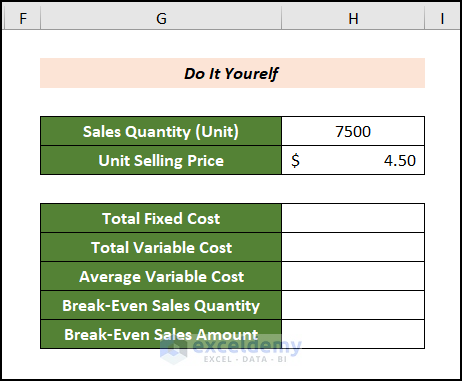
Practice Section
Practice here.
Download Practice Workbook
Download the following Excel workbook.
Related Articles
- Mortgage Break-Even Analysis in Excel
- How to Calculate Break-Even Points in Excel
- How to Do Multi-Product Break-Even Analysis in Excel
- How to Do Break-Even Analysis with Goal Seek in Excel
- How to Do NPV Break-Even Analysis in Excel
<< Go Back To Break Even Analysis Excel | Excel For Finance | Learn Excel
Get FREE Advanced Excel Exercises with Solutions!
