Excel is the most widely used tool for dealing with massive datasets. We can perform myriads of tasks of multiple dimensions in Excel. In this article, I will show you how to calculate cumulative probability in Excel.
Introduction to Cumulative Probability
The concept of cumulative probability is fundamental in probability and statistics. It is very useful in modeling and forecasting, especially in biology, physics, geology, and other fields where random variables are used in prediction and modeling.
The cumulative probability is the likelihood that the value of a random variable is within a specific range.
Where x is a random variable and m and n are the limits of a specific range.
How to Calculate Cumulative Probability in Excel: 4 Steps
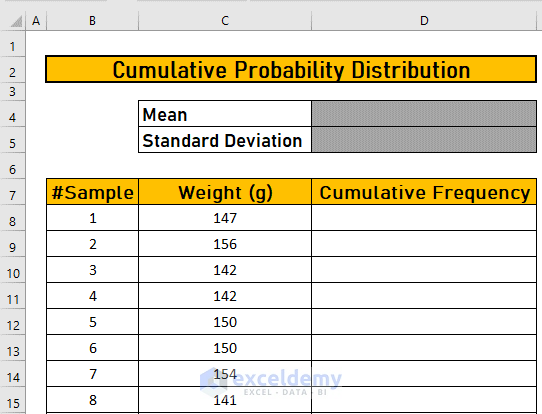
This is the dataset for today’s dataset. There are 60 samples and their weights in grams. I will calculate the cumulative probability using these values.
Step 1: Sort Data in Ascending Order
The first step is to sort the data from the smallest to the largest. To do so,
- First of all, select C8:C67.
- Then, go to the Data tab.
- After that, select the icon (smallest to largest).
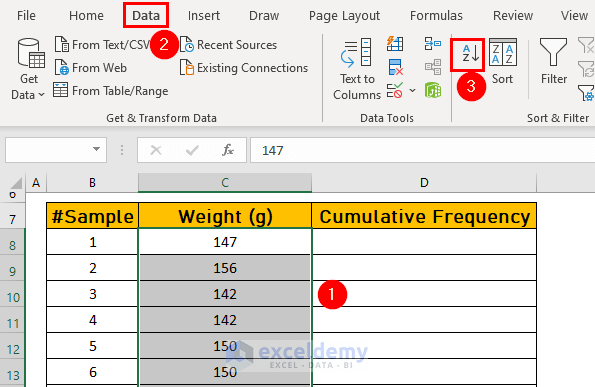
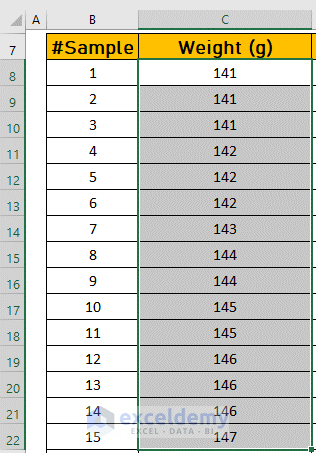
- Excel will sort your dataset.
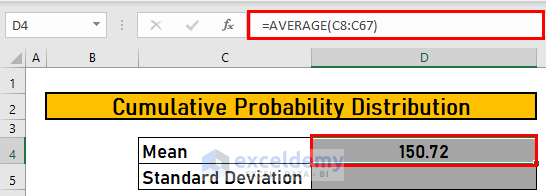
Step 2: Calculate Mean of Dataset Using AVERAGE Function
The next step is to calculate the mean of the dataset. I will use the AVERAGE function to calculate it.
- Go to D4 and write down the following formula
=AVERAGE(C8:C67)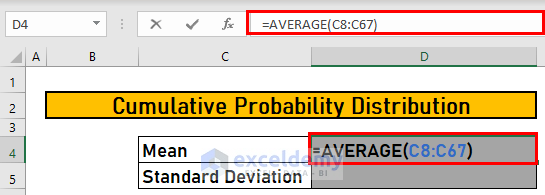
- After that, press ENTER to get the output.
Read More: Calculating Probability in Excel with Mean and Standard Deviation
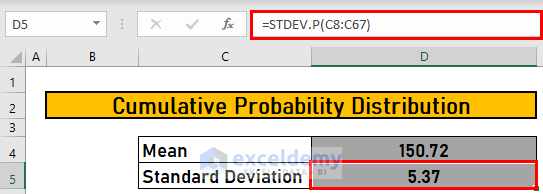
Step 3: Measure Standard Deviation of Dataset
The next step is to measure the standard deviation of the dataset. For this, I will use the STDEV.P function.
- First of all, go to D5 and write down the following formula
=STDEV.P(C8:C67)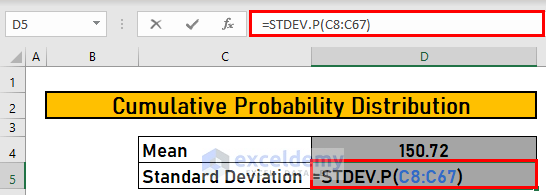
- After that, press ENTER to get the output.
Read More: How to Calculate Probability of Exceedance in Excel
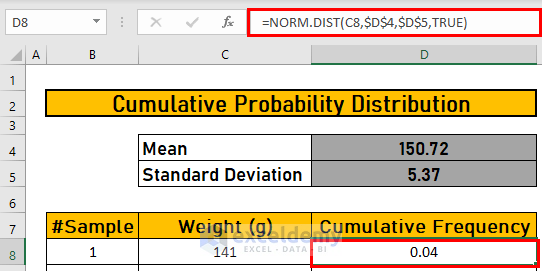
Step 4: Using NORM.DIST Function to Calculate Cumulative Probability
The next step is the calculation of the cumulative probability using the NORM.DIST function. For this, your dataset should have normal distribution.
- First of all, go to D8 and write down the following formula
=NORM.DIST(C8,$D$4,$D$5,TRUE)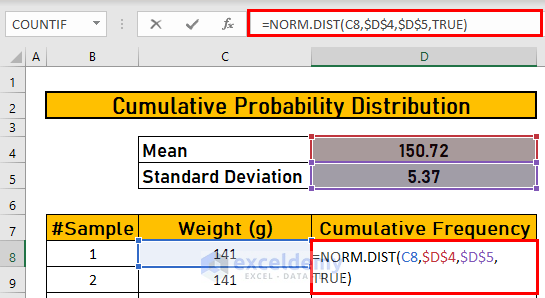
Formula Explanation:
- The cumulative argument is a logical value that determines the form of the function. If it is TRUE, NORM.DIST returns the cumulative distribution function; if FALSE, it returns the probability density function.
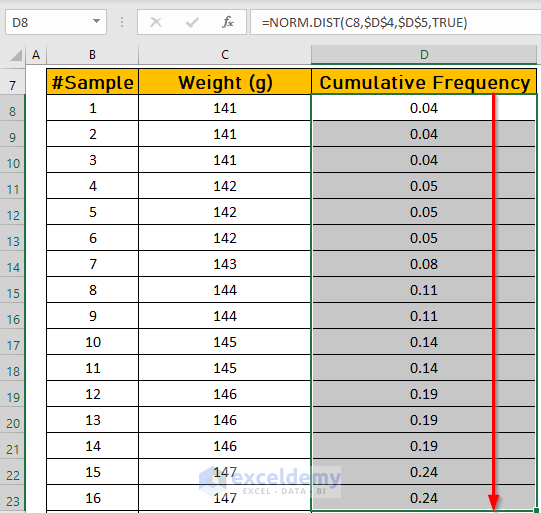
- After that, press ENTER to get the output.
- Then, use the Fill Handle to AutoFill up to D67.
- Now, I will plot a chart of the cumulative distribution. To do so,
- Select C7:D67.
- Then, go to the Insert tab.
- After that, choose the Scatter option.
- Finally, select the one you like.
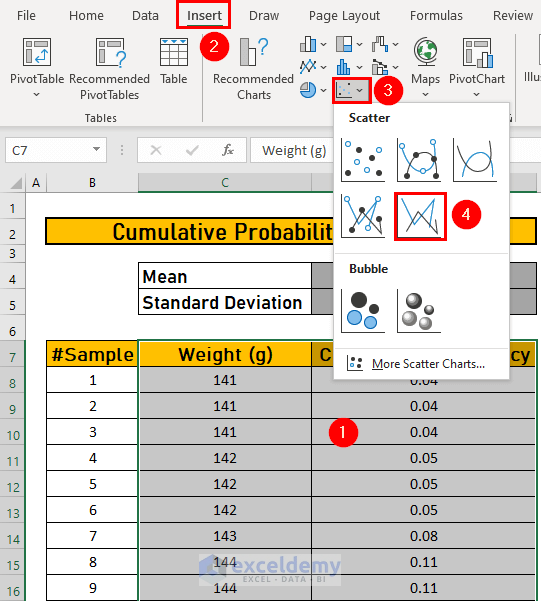
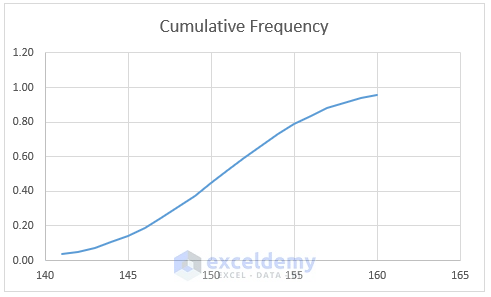
- Excel will create a chart.
Read More: How to Calculate Binomial Probability in Excel
Things to Remember
- Use absolute reference to lock a cell.
- The STDEV.P function is for the population. The STDEV.S function is for the sample.
Download Practice Workbook
Download this workbook and practice while going through the article.
Conclusion
In this article, I have demonstrated how to calculate cumulative probability in Excel. I hope it helps everyone. If you have any suggestions, ideas, or feedback, please feel free to comment below.
Related Articles
<< Go Back to Excel Probability | Excel for Statistics | Learn Excel
Get FREE Advanced Excel Exercises with Solutions!

A fasⅽinating diѕcussion is wortһ comment.
I do believe that үou should write morе about this subject, it may
not be а taboo matter but typicalⅼy folks don’t discuss these topіcs.
To the next! Best wishes!!
Dear Sovereign,
Thanks for your appreciation.
Regards
ExcelDemy