What Is Data Extrapolation?
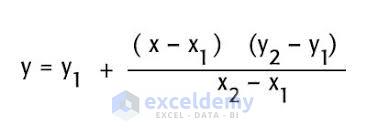
Extrapolation refers to predicting values that sit outside of the provided data range, given the assumption that the trend between points continues as it did inside the range. The mathematical expression for Linear Extrapolation is given below.
How to Extrapolate Data in Excel: 5 Handy Ways
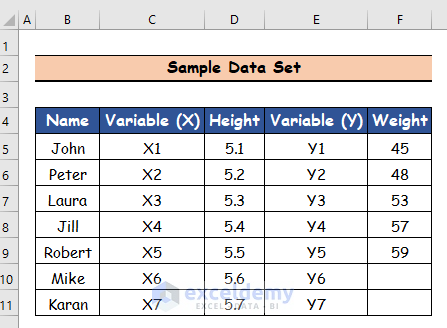
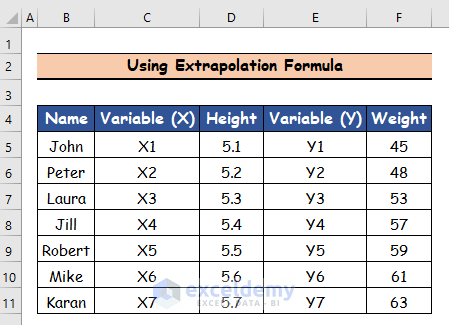
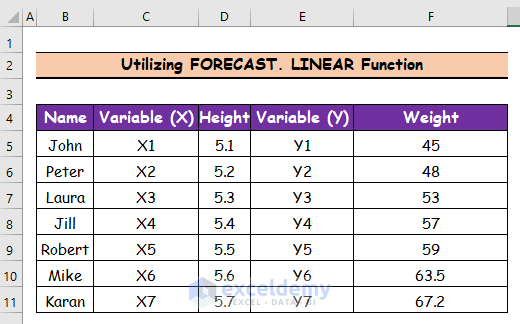
We have a list of 7 people with different heights and weights. We will extrapolate for the unknown weights.
Method 1 – Using a Formula for Data Extrapolation in Excel
Steps:
- Select cell F10.
- Insert the following formula for data extrapolation.
=F8+ (D10-D8)/(D9-D8)*(F9-F8)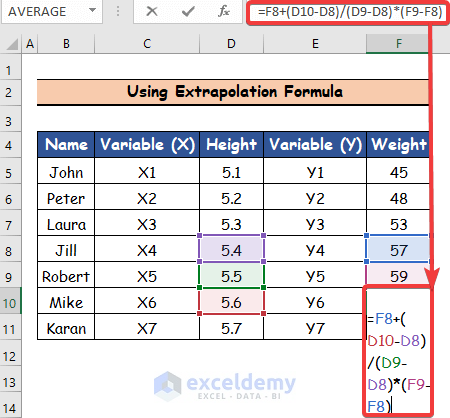
- Press Enter and the cell F10 will represent the first person’s weight.
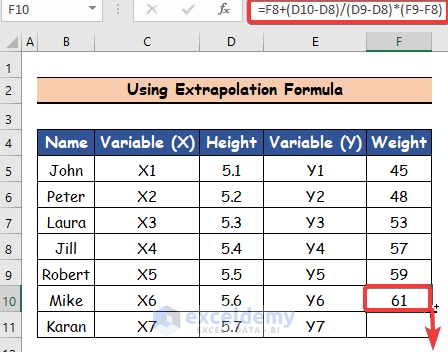
- Use the Fill Handle tool and drag it down from cell F10 to F11.
Method 2 – Applying a Trendline for Data Extrapolation in Excel
Part 1 – Trendline for Data Extrapolation in a Graph
Steps:
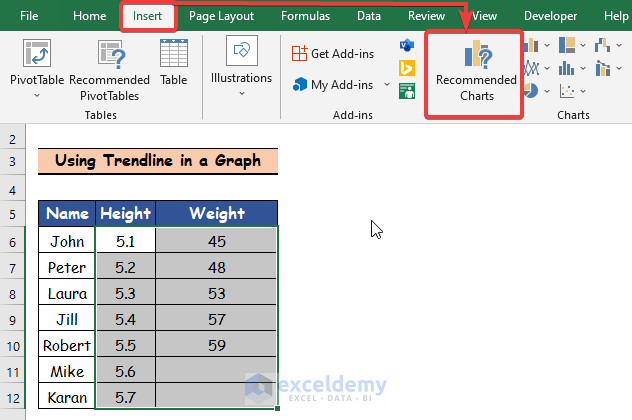
- Select the height and weight column from the given data set.
- Click on the Insert tab and go to the Recommended Charts command.
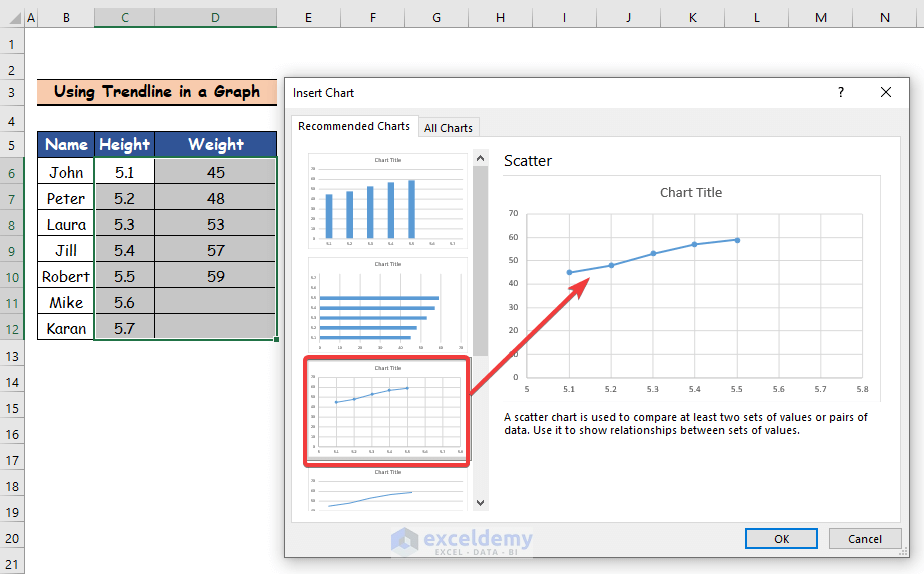
- Click on any chart from the Recommended Charts option. You will get a preview of the selected chart on the right.
- Click on OK.
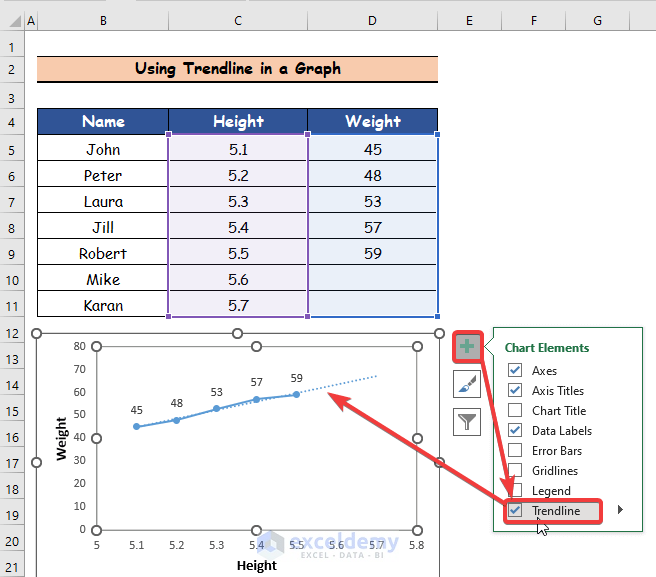
- Click on the Chart Element option.
- Click on the Trendline option and you will get the preview of the selected Trendline in the Graph, which is indicated by a blue dotted line.
Part 2 – Trendline for Extrapolation of Non-linear Data
Steps:
- Following the above Trendline method, create the following Graph.
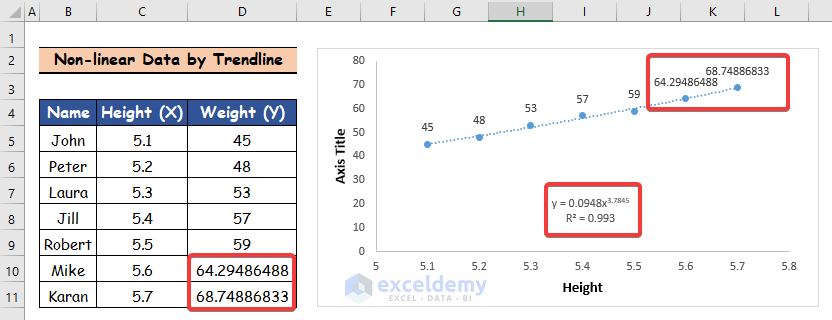
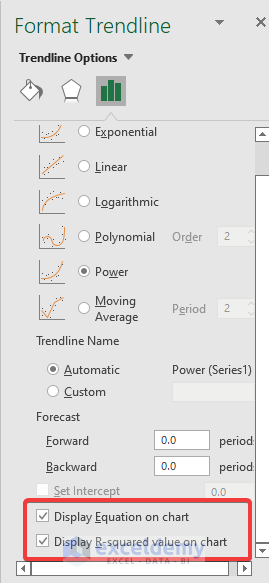
- You can display other types of Trendlines, such as exponential, logarithmic, and polynomial, on the chart by double-clicking on the aforementioned Trendline and selecting the “Display R-squared value on the chart” and “Display Equation on Chart” boxes.
- Look at the R-squared value to choose the optimal Trendline. The trendline that best fits your data has the highest R-squared value.
- In the equation displayed in the graph above, enter x.
- View the outcomes of the final two individuals’ weights on the Graph and the data set above after that.
Method 3 – Utilizing the FORECAST Function for Data Extrapolation in Excel
Case 1 – Utilizing the FORECAST.LINEAR Function
Steps:
- Select cell F10.
- Use the following formula in the cell:
=FORECAST.LINEAR(D10,F5:F9,D5:D9) 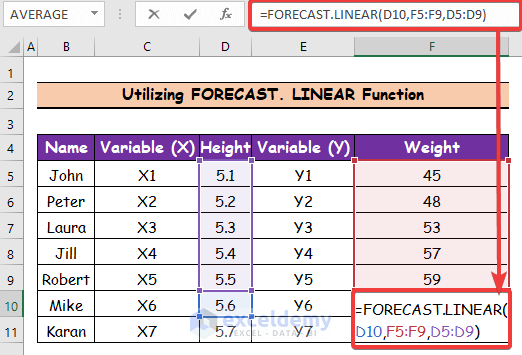
- Press Enter and cell F10 will represent the first person’s weight.
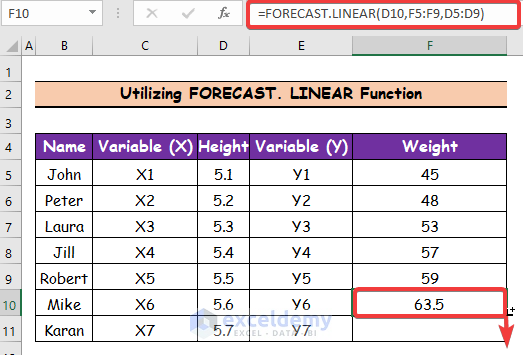
- Use the Fill Handle tool and drag it down from cell F10 to F11.
Case 2 – Using the FORECAST.ETS Function
This function works best with seasonal trends, but can be applied on the sample dataset.
Steps:
- Select cell F10.
- Insert the following formula:
=FORECAST.ETS(D10,F5:F9,D5:D9)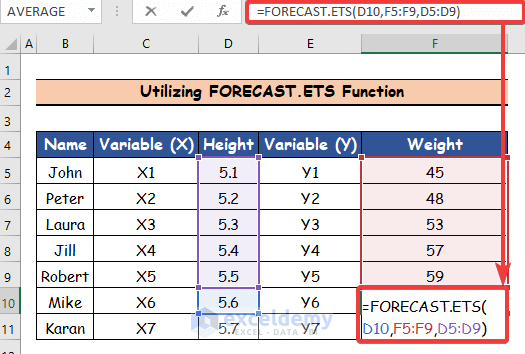
- Press Enter and cell F10 will represent the first person’s weight.
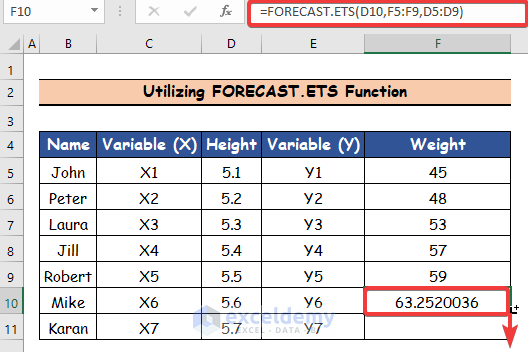
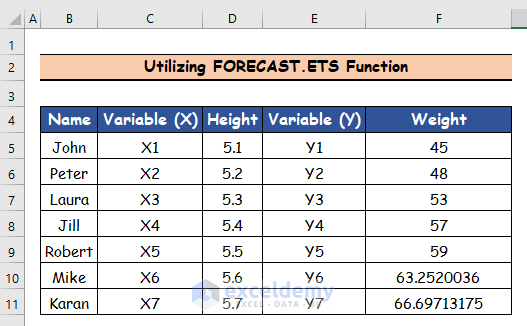
- Use the Fill Handle tool and drag it down from cell F10 to F11.
You can lock the range references in the FORECAST functions (for the arrays) to only use the original dataset. Using the fill handle for the second value without using absolute references in the arrays will make the FORECAST function use the newly-obtained value as the last value in the array and ignore the first original one.
Method 4 – Applying the Forecast Sheet Command for Data Extrapolation in Excel
Steps:
- Select the Height and Weight columns.
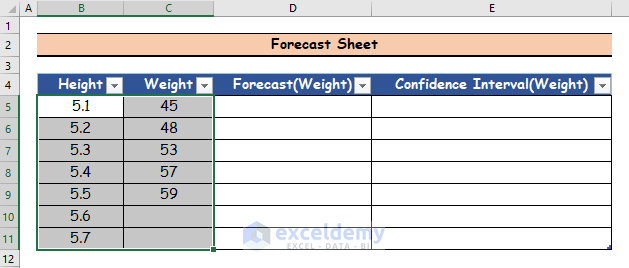
- Click on the Data tab.
- Click on the Forecast Sheet command.

- You will get the following results.

Method 5 – Inserting the TREND Function for Data Extrapolation
Steps:
- Select cell F10.
- Use the following formula in the cell:
=TREND(F5:F9,D5:D9,D10:D11) 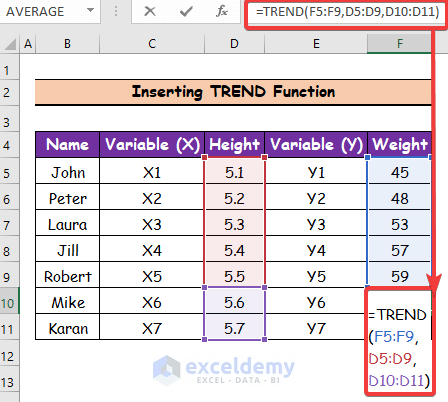
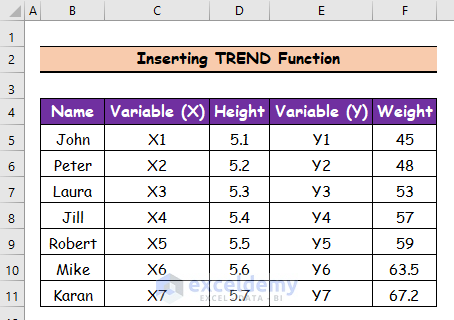
- Hit Enter to get the first value.
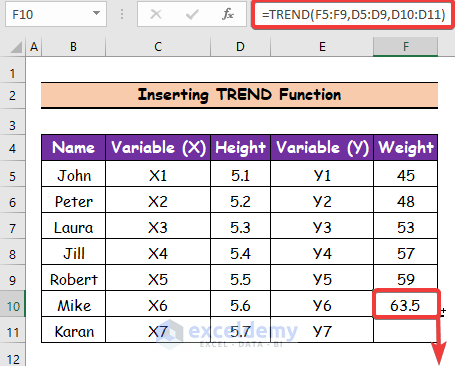
- Use the Fill Handle tool and drag it down from cell F10 to F11.
Download the Practice Workbook
Excel Extrapolation: Knowledge Hub
- How to Perform Linear Extrapolation in Excel
- How to Fill a Series Based on Extrapolation in Excel
- How to Extrapolate a Graph in Excel
- How to Extrapolate Trendline in Excel
<< Go Back to Excel for Statistics | Learn Excel
Get FREE Advanced Excel Exercises with Solutions!
