While working in Microsoft Excel sometimes we need to plot row numbers instead of values for working advantage. This might seem difficult to you if you are not aware of the actual process of doing it. There are various plotting row numbers instead of values in Excel. Today, in this article, I will share with you how to plot row numbers instead of values in Excel.
Plotting Row Number Instead of Value in Excel: 3 Easy Steps
In the following, I have shared a step-by-step procedure to plot row numbers instead of values in Excel.
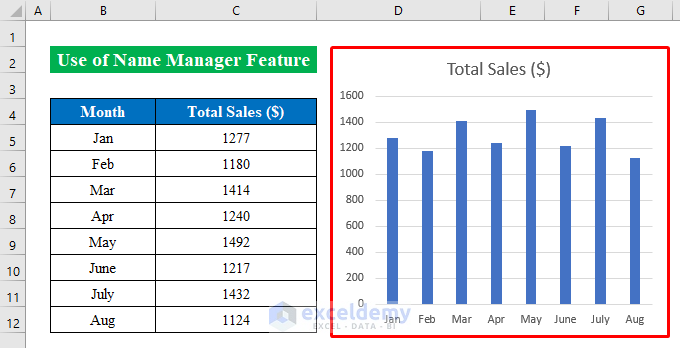
Suppose we have a dataset of a company’s Monthly Sales. Now we will plot a graph and then add row numbers instead of values.

Step 1: Plot Column Chart from Insert Tab
- Above all, select the whole dataset and go to the “Insert” option to choose a desired 2-D Column chart from the list.
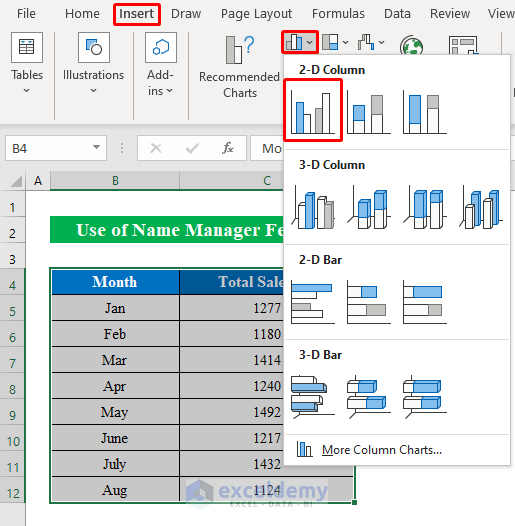
- Thereafter, a 2-D chart will be created inside the worksheet.
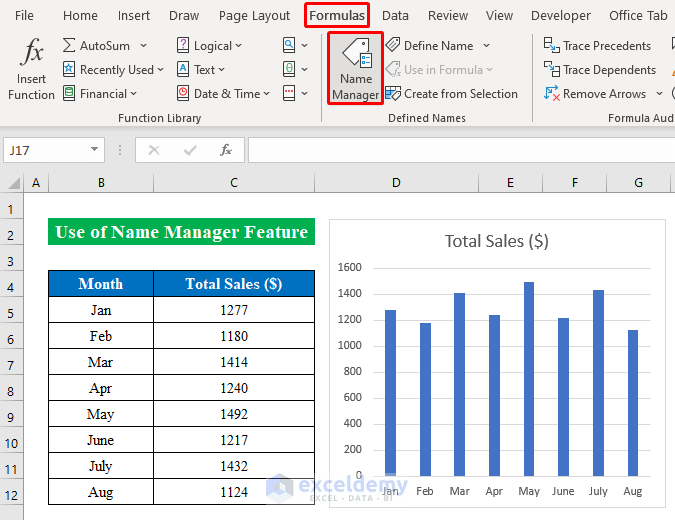
Step 2: Use Name Manager Feature from Formula Tab
- Now, simply select the “Formulas” option and choose “Name Manager” from the list.
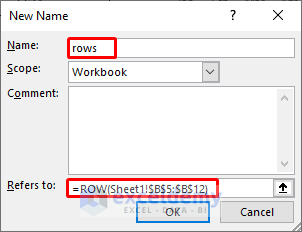
- Next, press “New” from the “Name Manager” window.

- Therefore, provide a name and write down the following formula-
=ROW(Sheet1!$B$5:$B$12)- Gently, press OK.
- As you can see we have finally created a name manager in the list.

Step 3: Edit Data to Plot Row Number
- In this final step, we will add row numbers to the chart. To do so-
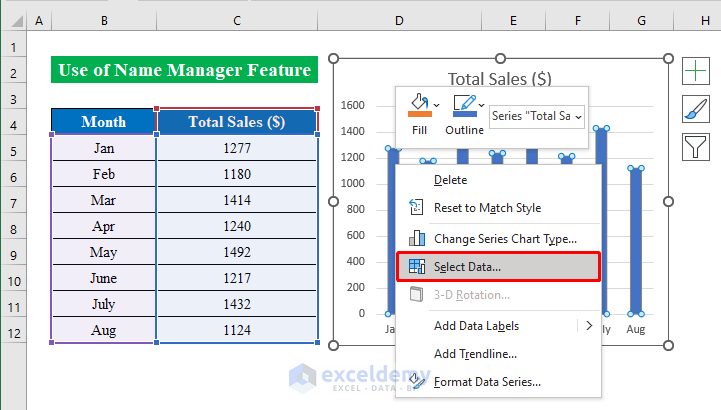
- Select the chart and right-click the mouse button to get options.
- From the options choose “Select Data”.
- Hence, from the new appeared window click “Edit”.

- Now, put the below formula in the “Axis label range” box-
=Sheet1!rows
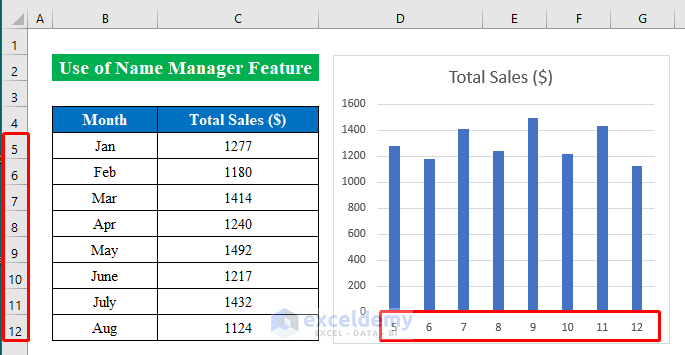
- In summary, you will get the row numbers instead of values in Excel without any hesitation.
Read More: [Solved]: Excel Graph Is Not Showing All Dates
Things to Remember
While putting the axis label range don’t forget to put the name similar to the added name in the name manager list.
Download Practice Workbook
Download this practice workbook to exercise while you are reading this article.
Conclusion
In this article, I have tried to cover all the methods to plot row numbers instead of values in Excel. Take a tour of the practice workbook and download the file to practice by yourself. I hope you find it helpful. Please inform us in the comment section about your experience.
Related Articles
<< Go Back to Excel Chart Not Working | Excel Charts | Learn Excel
Get FREE Advanced Excel Exercises with Solutions!

Thanks, my problem is the reverse, the X axis is the row number rather than the column values. Any idea why that happens?
Hello Mike G,
This usually happens when Excel doesn’t recognize your intended X-axis values or when the chart type is set to use default row numbers.
You can fix it by manually assigning the correct X-axis range:
1. Click on the chart.
2. Go to Chart Design → Select Data.
3. Under Horizontal (Category) Axis Labels, click Edit.
4. Select the cells that contain your actual column values for the X-axis.
5. Click OK.
Also make sure the X-axis data is formatted as numbers (not text). If Excel reads them as text, it may default to row numbers instead.
Regards,
ExcelDemy