Method 1 – Using Data Analysis ToolPak
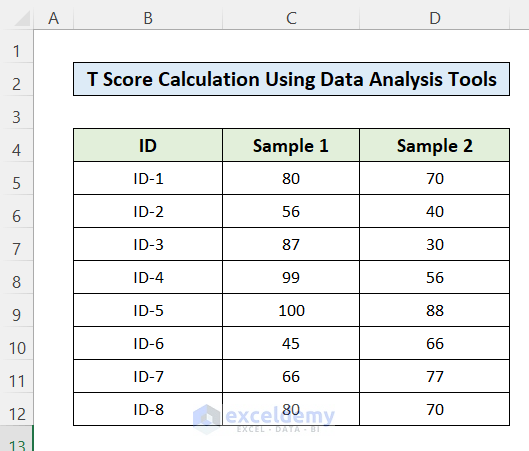
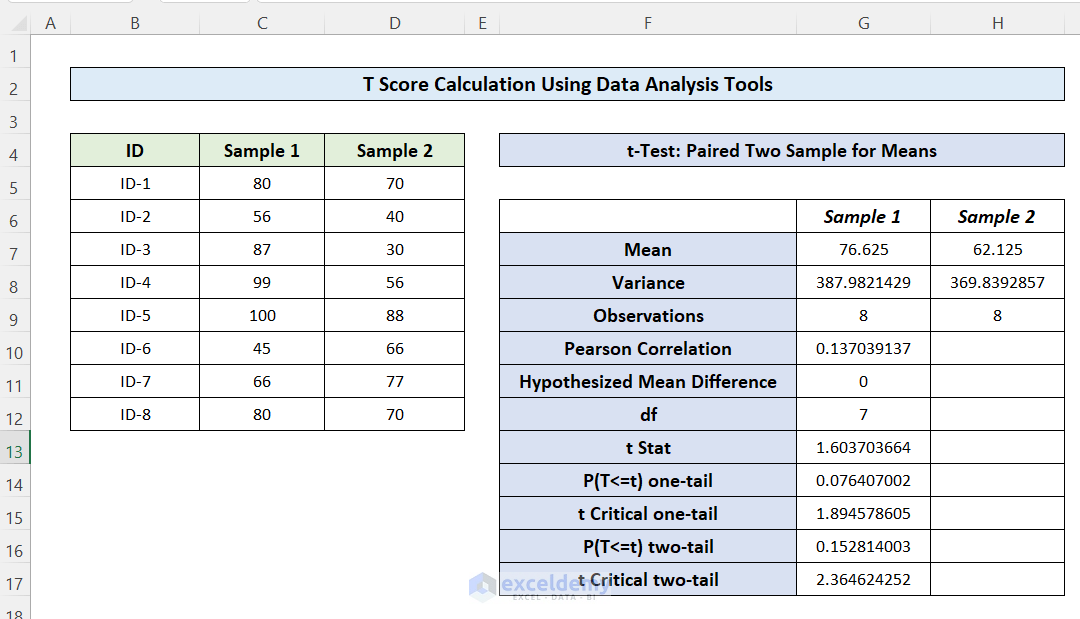
We have a dataset containing the Students’ IDs and each student’s Math and Physics scores. Let’s walk through the steps to do a t-Test: Paired Two Sample for Means analysis.
Steps:
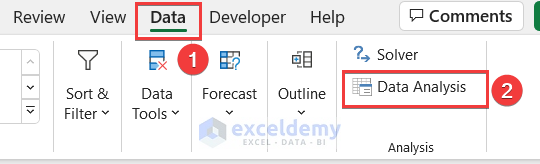
- Go to the Data tab in the top ribbon.
- Select the Data Analysis
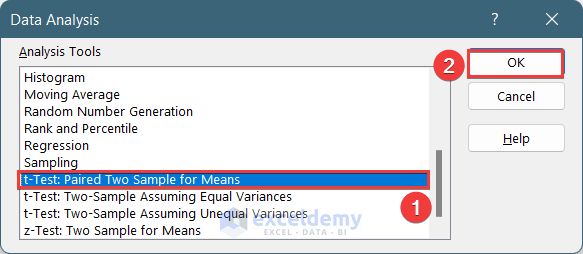
- Select the t-Test: Paired Two Samples for Means
- Click on OK.
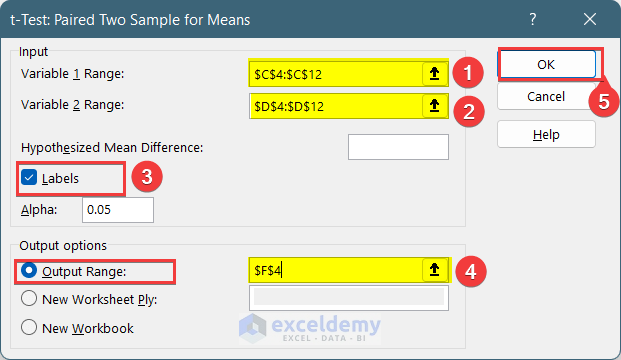
In the t-Test: Paired Two Sample for Means pop-up box,
- Insert data in the Input box, and provide the data ranges in the Variable 1 Range and Variable 2 Range
- Select the data cell you want your calculated data to store by dragging through the column or row.
- You can also show the output in the new worksheet by selecting New Worksheet Ply and see the output in the new workbook by selecting New Workbook.
- Check the Labels to see if the input data matches the label.
- Click on OK.
You will get the following result of the t-Test: Paired Two Sample for Means.
Method 2 – Using T.TEST and T.INV.2T Functions
Steps:
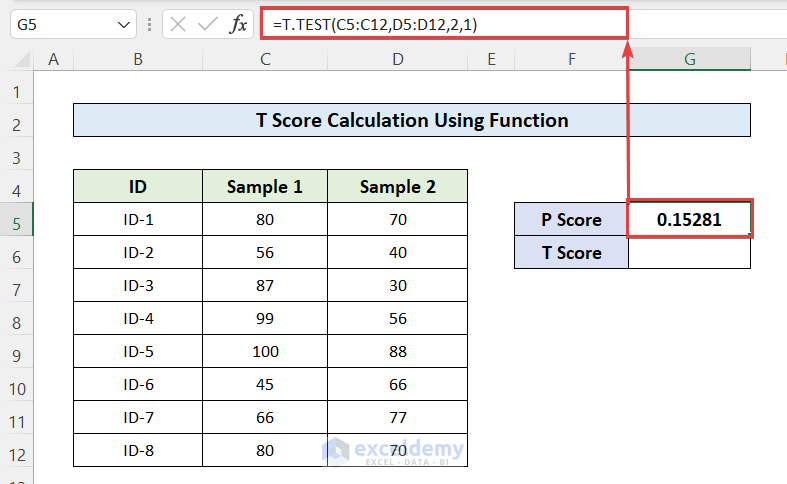
- Calculate the P value of the paired sample datasets. Use the T.TEST function to calculate the P score.
- Enter this formula into the cell G5 to get this:
=T.TEST(C5:C12,D5:D12,2,1)Formula Explanation:
▶ Syntax: =TTEST(array1,array2,tails,type)
- Array1 = C5:C12: The first data set
- Array2 = D5:D12: The Second data set
- Tails = 2: The number of distribution tails is defined. 1 for one-tailed distribution and 2 for two-tailed distribution
- Type = 1: 1 for Paired. 2 for Two-sample equal variance (homoscedastic), 3 for Two-sample unequal variance (heteroscedastic).
- Use the T.INV.2T function to calculate the T score from the P value of the dataset.
- Enter this formula into cell G6:
=T.INV.2T(G5,7)Formula Explanation:
▶ Syntax: =T.INV.2T(probability, deg_freedom)
Where,
Probability= G5: The probability or P score that has been used.
Deg_freedom= 7: It is the value degree of freedom which is 1 minus of total count of sample data.
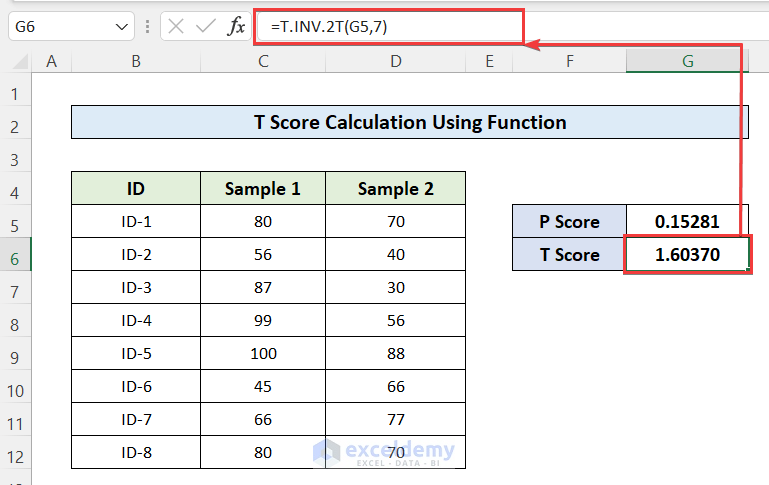
You have calculated the P score of a paired dataset using Excel Functions.
Method 3 – Using Generic Formula to Calculate T-Score
Steps:
- Insert the values in the cells from C3 to C6.
- Enter this formula into the cell C8 to get the T score:
=(C3-C4)/C5/SQRT(C6)
- You have the T score for the sample dataset compared with the full population.
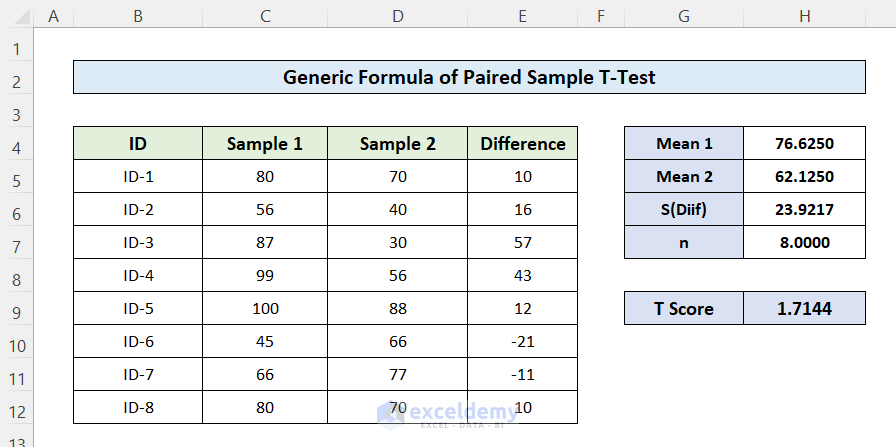
Method 4 – Using a Generic Formula of Paired Sample T-Test
Steps:
- Calculate the mean 1 and mean 2 using the AVERAGE function.
- Enter this formula into cell H4 for mean 1:
=AVERAGE(C5:C12)- In cell H5 for a mean 2
=AVERAGE(D5:D12)- Calculate the Standard deviation using the STDEV.P function.
- Enter this formula into cell H6:
=STDEV.P(E5:E12)- Calculate the total size of the sample dataset using the COUNT function.
- Enter this formula into cell H7:
=COUNT(E5:E12)- Enter this formula in cell H9 to get the T score:
=(H4-H5)/(H6/SQRT(H7))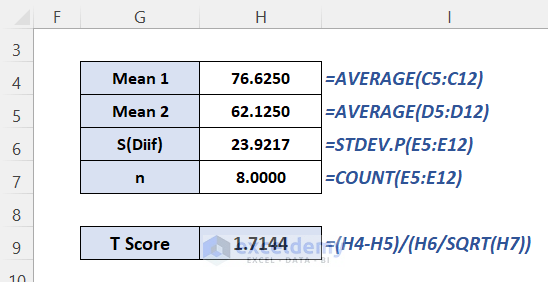
You have got the T score of the sample datasets.
Download the Practice Workbook
You can download the practice workbook from here:
<< Go Back to Scoring | Formula List | Learn Excel
Get FREE Advanced Excel Exercises with Solutions!
