It‘s mandatory to calculate share price volatility while you are going to invest in the share market. It will help to determine the risk. In Excel, we can do the calculation quite easily. You will learn 2 easy ways to calculate share price volatility in Excel with proper images and sharp steps.
What Is Share Price Volatility?
The rate at which the price of a stock rises or descents over a certain time is called volatility. The higher the volatility often means the higher the risk. It helps to determine the fluctuation which may occur in the future. The main volatility formula is-
Annual Volatility = Standard Deviation * √252Here, 252 is the average trading day of a year.
First, get introduced to our dataset. It represents the closing prices for 10 days in a share market.

1. Using Manual Formula to Calculate Share Price Volatility in Excel
Before calculating the volatility of share price, we have to calculate the closing return for each day first. It will compare the difference between any price with the previous price in percentage. Then by using the closing returns, we’ll calculate the daily and annual volatility of the share price.
Steps:
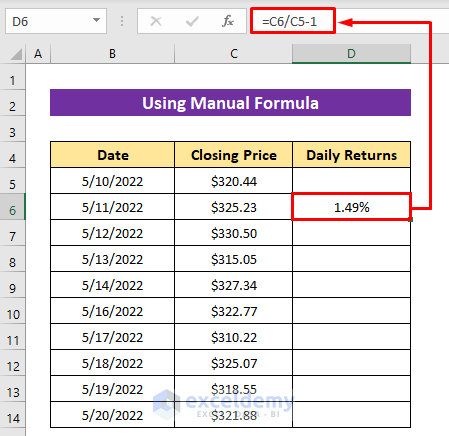
- Activate Cell D6 and insert the following formula into it-
=C6/C5-1Kept the first cell empty because we’ll compare any cell with its previous cell, that’s why we started from the second cell.
- Then just hit the ENTER button for the output.
Note: Format the cells in Percentage format to get the output directly in percentage.
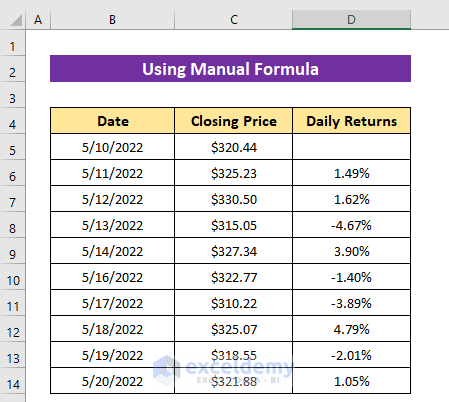
- Next, drag down the Fill Handle icon to copy the formula for the other cells.

Now we have got all the closing returns.
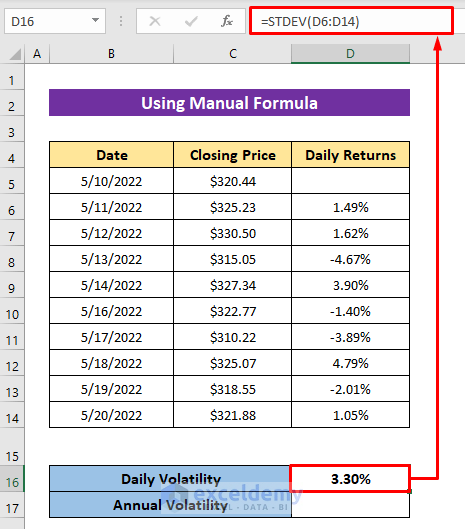
First, we’ll calculate the daily volatility here using the STDEV function.
- Type the following formula in Cell D16–
=STDEV(D6:D14)- Later, just press the ENTER button to get the daily volatility of the share price.
To get more accurate volatility, we will have to find the annual volatility. For that, we’ll have to multiply the daily volatility by the square root of all trading days of a year. So, we’ll use the SQRT function in this regard. In general, a year has 252 trading days on average in a year.
- Insert the following formula in Cell D17–
=D16*SQRT(252)- After that, press the ENTER button to get the annual volatility of the share price.

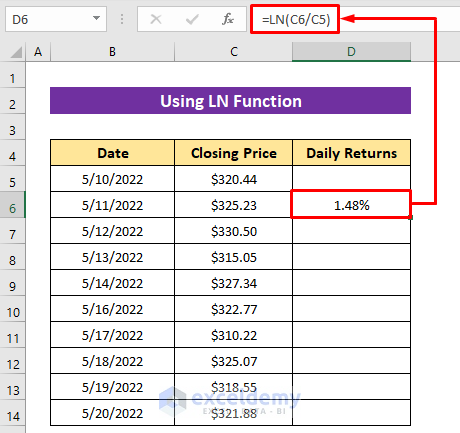
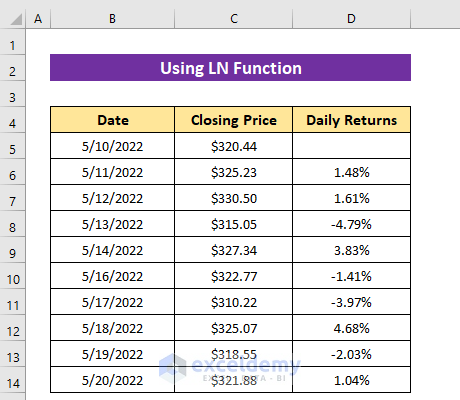
2. Calculating Share Price Volatility Using Excel LN Function
Instead of using the manual formula, we can use the LN function to get the daily returns. It will return the natural logarithm of a number. And the result will be the same as the manual formula. We’ll input any price as a numerator into the LN function and the previous price as a denominator.
Steps:
- In Cell D6, insert the following formula-
=LN(C6/C5)- Later, hit the ENTER button to get the daily returns.
- Next, use the Fill Handle tool to copy the formula for the rest of the cells.
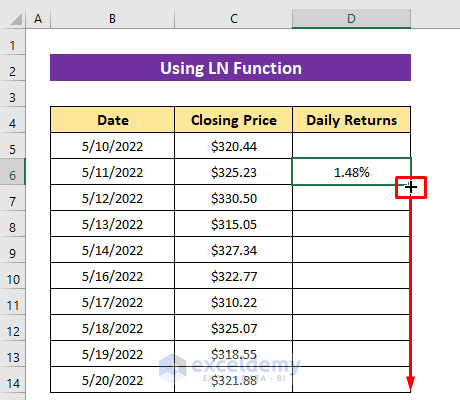
See, we have got the same output as the previous manual formula.
- Now to find the daily volatility, insert the following formula in Cell D16–
=STDEV(D6:D14)- Then press the ENTER button to finish.

- For annual volatility, write the following formula in Cell D17–
=D16*SQRT(252)- Finally, hit the ENTER button, and soon after you will get the annual volatility.

Advantages of Calculating Volatility
- It helps to measure the fixed risk and returns framework.
- If the returns graph doesn’t get symmetrical then the investor can assume the risk level.
- It can help to reduce the loss of a random fluctuation in the stock market.
- It can be useful to increase profit.
- Volatility calculation helps to manage different share businesses and determine the overall loss or profit.
Download Practice Workbook
You can download the free Excel workbook from here and practice on your own.
Conclusion
That’s all for the article. I’ve tried to discuss the calculating process of share price volatility, hope the procedures described above will be good enough to calculate share price volatility in Excel. Feel free to ask any question in the comment section and please give me feedback.
<< Go Back to Dividend | Formula List | Learn Excel
Get FREE Advanced Excel Exercises with Solutions!

“Instead of using the manual formula, we can use the LN function to get the daily returns. It will return the natural logarithm of a number. And the result will be the same as the manual formula.”
Numbers in daily returns column are different though?
Hello, NICK!
Hope you are doing well. Thank you for your query.
As we have used different functions in the two methods, the answer varied a little bit, it’s true. But as you can see, this variation is minimal. The final answer is almost equal in both methods. Moreover, the little variation is after the decimal part in a percentage format. So you can neglect this small difference most of the time to calculate the following approximate result.
But if you need a 100% accurate answer, I would suggest you use the manual method.
Regards,
Tanjim Reza