Method 1 – Conditional Formatting to Calculate the Percentage Above Average
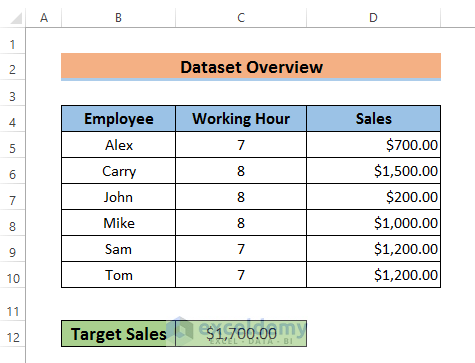
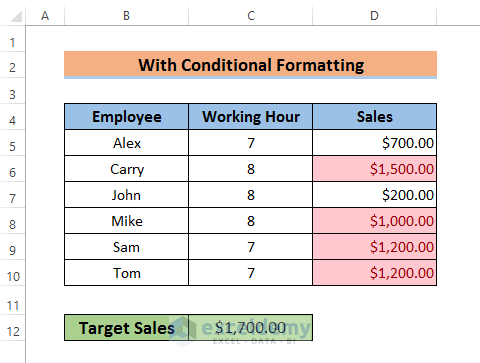
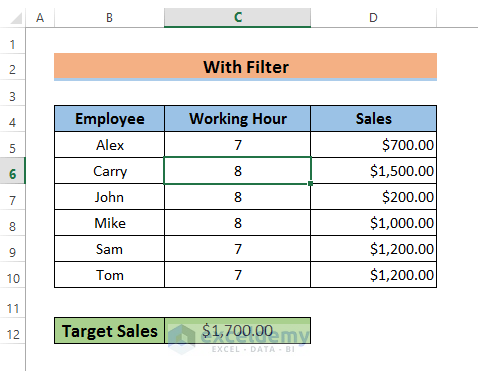
We will use a dataset of three columns that contains the Sales, Target Sales, and Working Hour information of some employees.
STEPS:
- Select the range of cells that contains the values. We have selected Cell D5 to Cell D10.
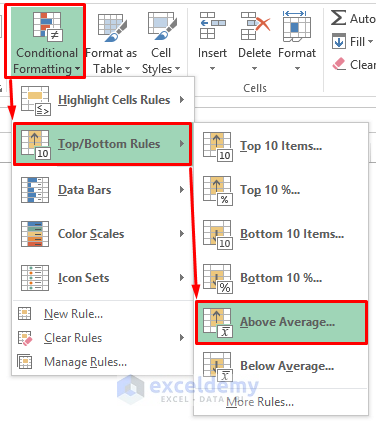
- Go to ‘Conditional Formatting’ from the Home tab.
- Select ‘Top/Bottom Rules’ and ‘Above Average’ from the drop-down menu.
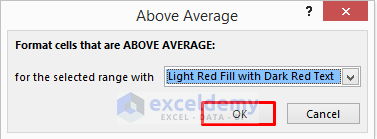
- The ‘Above Average’ window will open. You format the selected cells with different colors from here.
- Click OK to proceed.
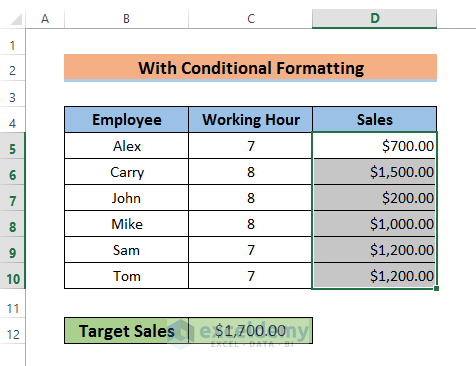
- The cells that contain above average values will be colored like below.
- Create a column that will display the percentage.
- Use the following formula in Cell E5.
=(D5/$C$12)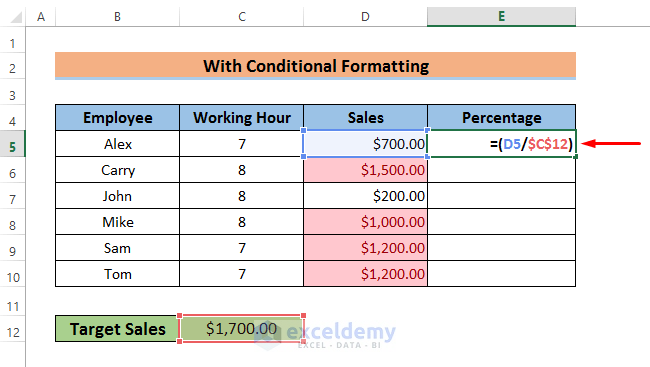
We are dividing the cells with a constant cell. We have locked it by using the dollar ($) sign, or absolute reference.
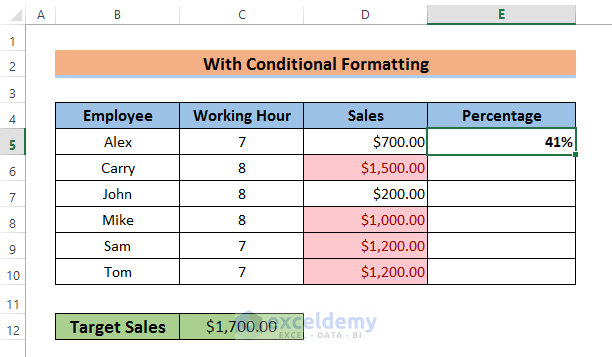
- Go to the ‘Format Number’ tab and change it to ‘Percentage’.

- Press Enter to see the result.
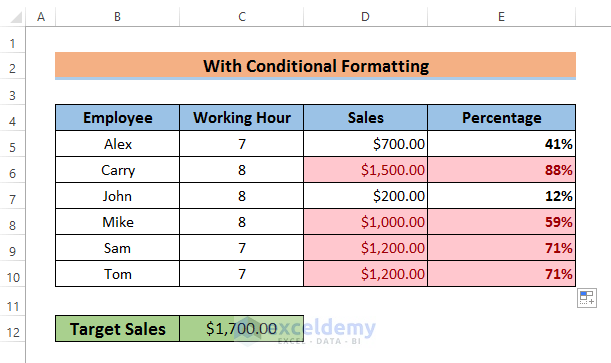
- Use the Fill Handle to see the results in all cells.
Read More: How to Apply Percentage Formula in Excel for Marksheet
Method 2 – Filter Data to Calculate Percentage above Average in Excel
STEPS:
- Select any cell in your dataset. We have selected Cell C6 here.
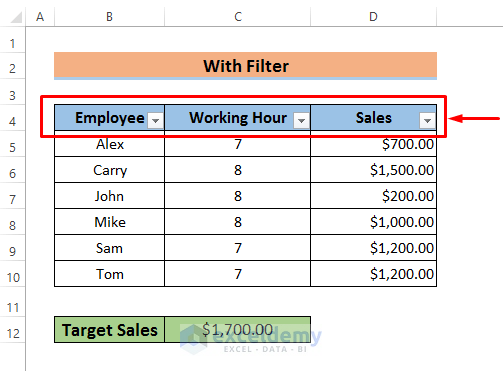
- Go to the Data tab and select Filter.

- The header of the columns will have filters like below.
- Create a column to display the percentage.
- Use the formula below in the cell E5.
=D5/$C$12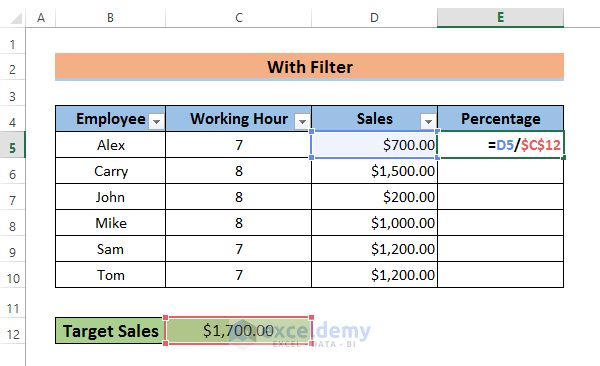
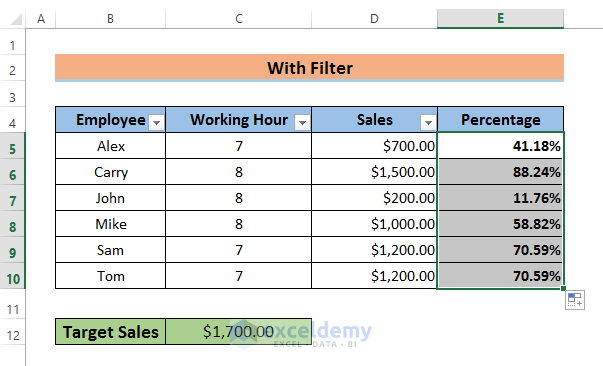
- Go to the ‘Format Number’ tab and change it to ‘Percentage’.

- Hit Enter and use the Fill Handle to see results in all cells.
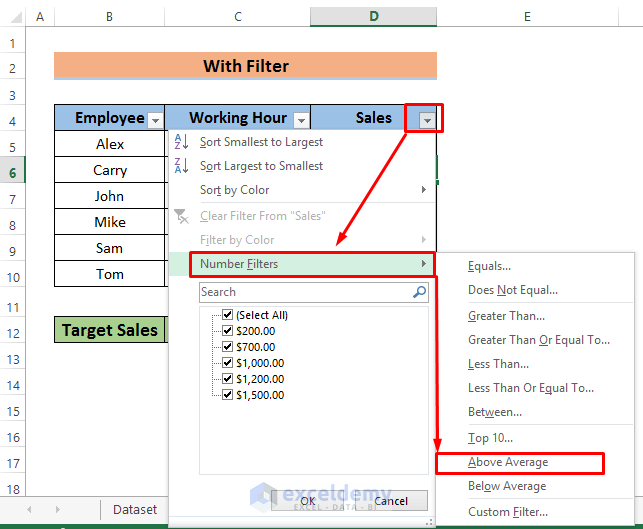
- Select the header of the ‘Sales’ column.
- Select ‘Number Filters’ and ‘Above Average’ from the drop-down menu.
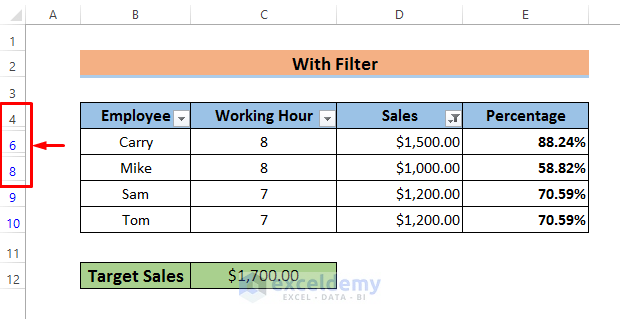
- You will see the percentage of the above average values below.
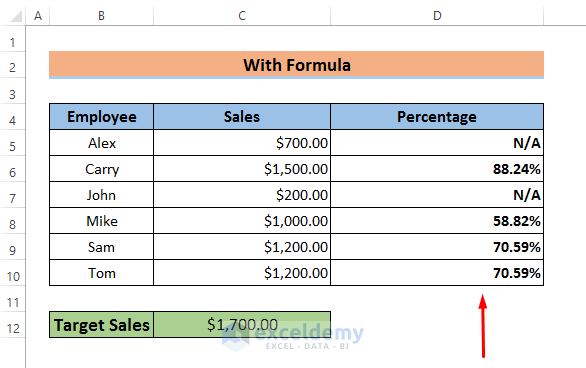
Method 3 – Determine the Percentage above Average with a Formula in Excel
STEPS:
- Select Cell D5 and insert the following:
=IF(C5>AVERAGE($C$5:$C$10),C5/$C$12,N/A)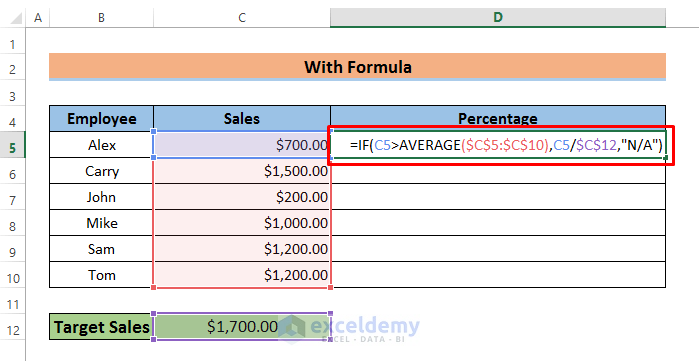
The AVERAGE function calculates the average of the cells C5 to C10. As it will be fixed for other cells too, we have locked it using the dollar ($) sign. The IF function compares the cell value with the average value and gives a percentage as output if it is true. Otherwise, it displays N/A as output.
- Hit Enter to see the result.
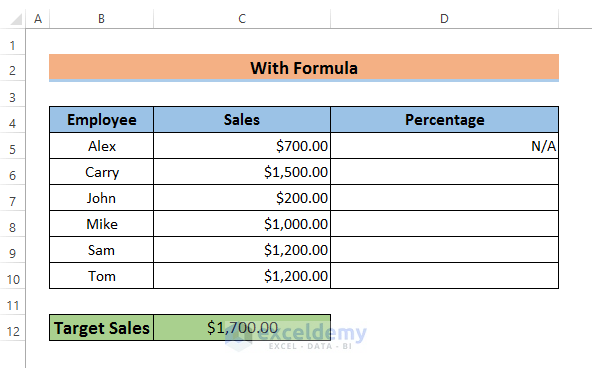
- Use the Fill Handle to see results in the rest of the cells.
Download the Practice Workbook
Related Articles
- Calculate Percentage Using Absolute Cell Reference in Excel
- Calculate Percentage in Excel VBA
- How to Calculate Percentage of Filled Cells in Excel
- How to Apply Percentage Formula for Multiple Cells in Excel
- IF Percentage Formula in Excel
- How to Calculate Contribution Percentage with Formula in Excel
- How to Calculate Percentage for Multiple Rows in Excel
- How to Use Food Cost Percentage Formula in Excel
- How to Calculate Variance Percentage in Excel
<<Go Back to Calculate Percentage with Criteria in Excel | Calculating Percentages in Excel | How to Calculate in Excel | Learn Excel
Get FREE Advanced Excel Exercises with Solutions!
