Latest Posts From Nasir Muhammad Munim

What Is VBA Cells Property? Cells property refers to a cell for any operation in VBA. It can access or modify cells based on row and column indexing. Cells ...

Method 1 - Calculate Standard Deviation with Single IF Condition Steps: Select the desired cell where we want to get the result as shown in the image ...

This is an overview: Method 1 - Using the Goal Seek Feature to Create a Reverse EMI Calculator in Excel Step 1: Establishing the ...

Excel has one of the best usages in statistics. Average Deviation is an important term in statistics that can be directly measured in Excel with the AVEDEV ...

One of the most useful features of Excel is having a dictionary that enables us to check for meaning and spelling. In this article, we will learn about Excel ...

Radio Button in Excel Without Macro: Step-by-Step Guide to Insert Step 1 - Add the Developer Tab in the Ribbon Right-click anywhere in the blank space of ...

Method 1 - Creating a Custom Catalog for Books Steps: Select the headings. Separate the columns with a borderline. Select a column. ...

Method 1 - Remove Inverted Commas in Excel Using a Multiplication Steps: Enter 1 in any random cell in the worksheet and copy the cell by pressing ...

One of the very popular uses of Excel is to calculate time and time differences. We may need to add or subtract time in Excel for a schedule or use custom time ...

We often need to use the same table in multiple sheets for calculation and analysis. Copying the entire table and pasting it wherever we need is a very ...
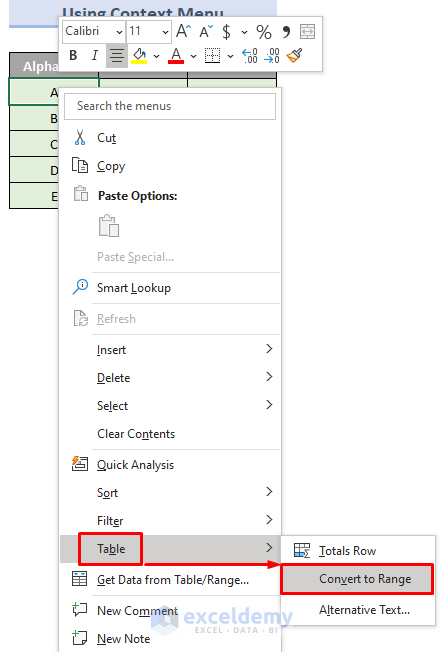
Method 1 - Undo a Table by Converting to Range Steps: Select any of the cells in the table. In the ribbon, a tab named Design or Table Design will ...
Excel is a versatile software with many features. One of the most used features is generating graphs with it and then showing the data related to arrow signs ...
To sum positive and negative numbers in the dataset: Method 1 - Sum Only Positive Numbers 1.1 Using SUMIF Function Sum all numbers above 0. The ...
Method 1 - Using a File Stored in the System Memory Steps: Go to Data > Get Data > From File. Select From XML. In the selection box, ...
Method 1 - Using Excel Ribbon to Group and Hide Columns in Excel Steps: To hide the Product ID and Sold Amount, you need to group them first. Go ...
See Our Reviews at


Dear KAREN CAYANAS,
Thanks for reaching out to us with your problem.
This problem occurs when you do not have enough view area on the monitor. While there is no particular fix to your problem, if you want to keep the cell styles in the Ribbon, you may consider removing some unnecessary groups from the Home tab.
To do so follow these steps:
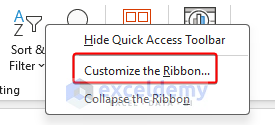
1. Right-click on the empty area of the Ribbon.
2. Select “Customize the Ribbon“.
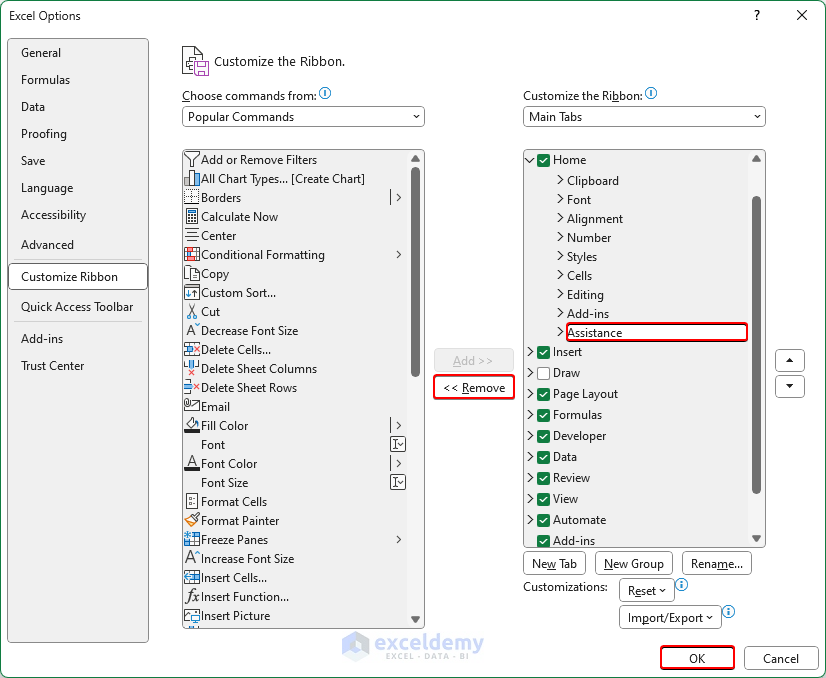
3. From the Home tab dropdown, select and remove unnecessary groups one by one.
4. Click on OK to finish the process.
After removing the groups, cell styles will be visible without the “Cell Styles” drop-down if there is enough room in the Ribbon.
Regards,
Exceldemy
Hi Arthur,
Thank you for finding out about this issue. We have updated the VBA code to avoid the “Sub or Function Not Defined” error. Please try again with this new code and let us know if this problem still exists or not.
Regards,
Team Exceldemy
Dear AVI,
We can assure you that if you followed the steps correctly, everything should be fine with the tutorial. Moreover, both of these formulas are single-cell output formula. So, the procedure for the array formula implementation or pressing CTRL+SHIFT+ENTER is not required here.
If you want to take all the data to find out the standard deviation without conditions or avoid taking the false as 0, you should have a look at our article How to Calculate Average and Standard Deviation in Excel.
Regards,
Exceldemy
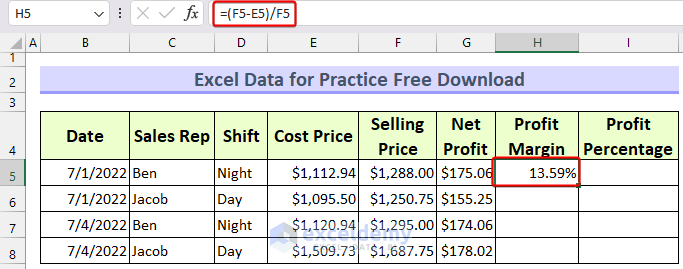
Dear Fardeen,
The profit margin is the percentage you get from the selling price. The formula for profit margin is: (Selling Price-Cost Price)/Selling Price or, Net Profit/Selling Price
The profit margin is calculated in the worksheet with the formula: =(F5-E5)/F5
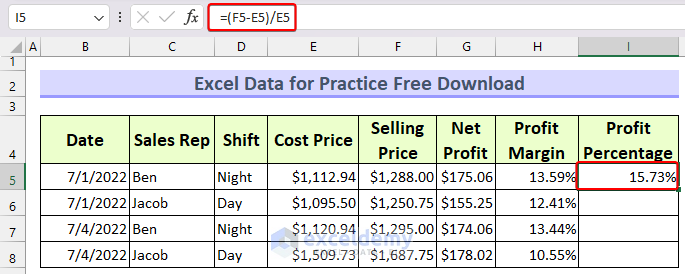
On the other hand, the profit percentage is calculated based on the Cost Price. The formula for profit percentage is: (Selling Price-Cost Price)/Cost Price or, Net Profit/Cost Price
The profit percentage is calculated in the worksheet with the formula: =(F5-E5)/E5
Regards
Exceldemy