Latest Posts From Alif Bin Hussain

This is an overview. Step 1 - Enter the Date and the Odometer Reading Insert two columns: Date and Odometer Reading. Enter the dates and the ...
![[Fixed!] Sort Largest to Smallest Not Working in Excel](https://www.exceldemy.com/wp-content/uploads/2023/01/Sort-Largest-to-Smallest-Not-Working-in-Excel-12.png?v=1697456043)
Reason 1 - Numerical Data Converted into Text Format The issue can occur if the data we are trying to sort is in Text format. We can only sort data from ...

We will use the following dataset to demonstrate how to use the ISNUMBER function for IF statements. Example 1 - Check If a Cell Starts with a ...

Interpolation is the process of determining the value of an unknown point that lies between two known data points. While calculating linear interpolation is an ...
The Format Painter tool is handy for copying the format of cells to single or multiple rows. It's like copying the style of one row and painting it onto ...
Example 1 - Insert a Pie Chart for Grade Distribution Steps: Insert a column named “Grades”. To find out the grade, select cell D5 and enter the ...

When working with a large number of data in Excel, it may be difficult to locate a value or a piece of data. Using VBA code this difficulty can be solved which ...
We will use the following dataset, which contains two columns named Student Name and Test Score. A bar chart is inserted using these two columns. ...

This is an overview. Unchecking the AutoCorrect Dialog Box Steps Click the arrow button above the ribbon and select More Commands. ...

An individual might need to sum up only the values that satisfy certain criteria from a large dataset. The DSUM function can be very useful if we want to add ...
Excel is a very useful tool for plotting different kinds of charts. Excel offers various options to format the plotted charts to make it look more attractive. ...

While working in Excel, we often use the AND function. Sometimes we also use the OR function. There are times when we might need to use both the AND and OR ...

Drawing pictures or shapes can help an individual to enhance the appearance of his presentation. Excel offers various options to draw pictures or anything ...

Looking for a way to calculate VaR using the Delta-Normal method in Excel? Well, you have come to the right place. In this article, we will walk you through ...

Trendlines help an individual to determine the current market price direction. It is important to make decisions about trading products, investing money in ...
See Our Reviews at


Hello FAIS,
Follow these steps to get your desired result.
=LN(C6/C4)/LN(1+C5)In the formula, C6 refers to the desired salary (75000000), C4 refers to the current salary (307584) and C5 refers to the increment percentage (10%).
=INT(C8)&" years " & INT(MOD(C8*12,12))&" months"Here, C8 refers to the required time in years.
Hello Tom,
The upward arrow between C9 and C10 in the formula indicates the exponent operation of mathematics. In the formula, C9 raised to the power of C10 is written as C9^C10. A simple example would be “Two Squared” which is written as 2^2 = 4, where 2 is raised to the power of 2, resulting in 4.
Hello Claire,
Follow these steps to make the stacked bar charts of Likert scales.
Insert >> Charts >> 100% Stacked Column
Hello Torsten,
Thank you for bringing this matter to our attention. We will look into the VBA function to see if it can be updated to minimize the deviation of the orange line from the given points.
Besides, I would like to address your concern regarding interpolation methods. There are some interpolation methods that go through all the given points such as Lagrange interpolation or polynomial interpolation etc. However, interpolation method such as cubic spline interpolation does not necessarily pass through all the given data points.
Hello SANJAY DANGI,
Thank you for reaching out. You can add attachment to the email in the first method easily. Follow these steps to do it.
Sub ExcelToOutlookSR() Dim mApp As Object Dim mMail As Object Dim SendToMail As String Dim MailSubject As String Dim MailBody As String Dim FileName As String Dim Path As String 'Declare variable for file path Path = "D:\Exceldemy\" 'Set file path For Each r In Selection SendToMail = Range("C" & r.Row) MailSubject = Range("F" & r.Row) MailBody = Range("G" & r.Row) FileName = Range("H" & r.Row) 'Get file name from H column Set mApp = CreateObject("Outlook.Application") Set mMail = mApp.CreateItem(0) With mMail .To = SendToMail .Subject = MailSubject .Body = MailBody .Display .Attachments.Add (Path & FileName) 'Add attachment End With Next r Set mMail = Nothing Set mApp = Nothing End SubHello Theo,
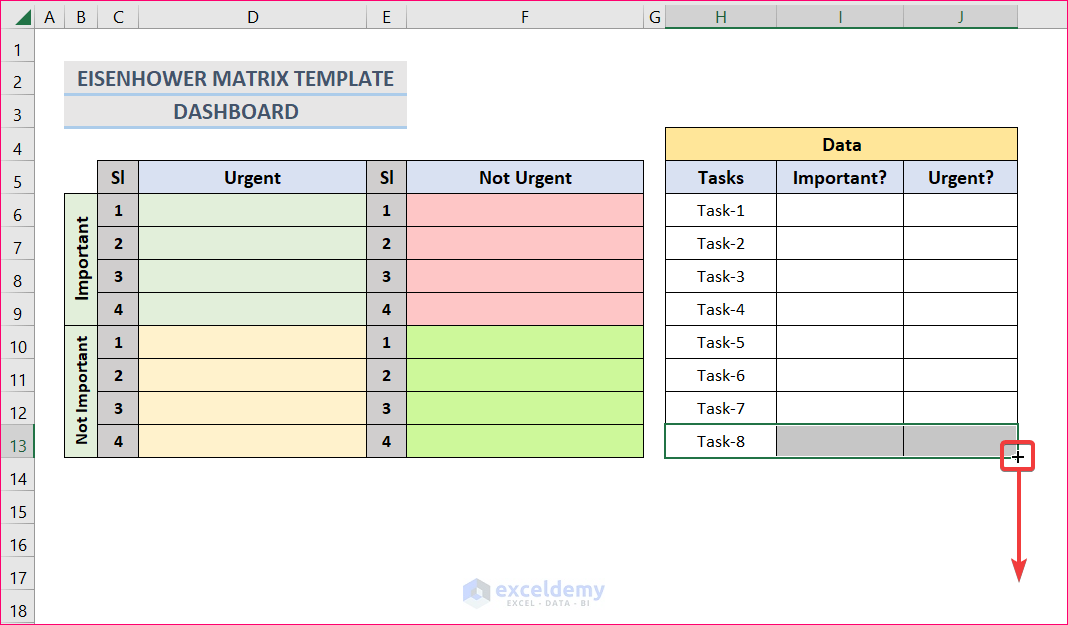
Follow these steps to adjust ranges to make a longer list without any error.
1. First, to make the task list longer, select cells H13 through J13. Then drag the fill handle down to add new task.
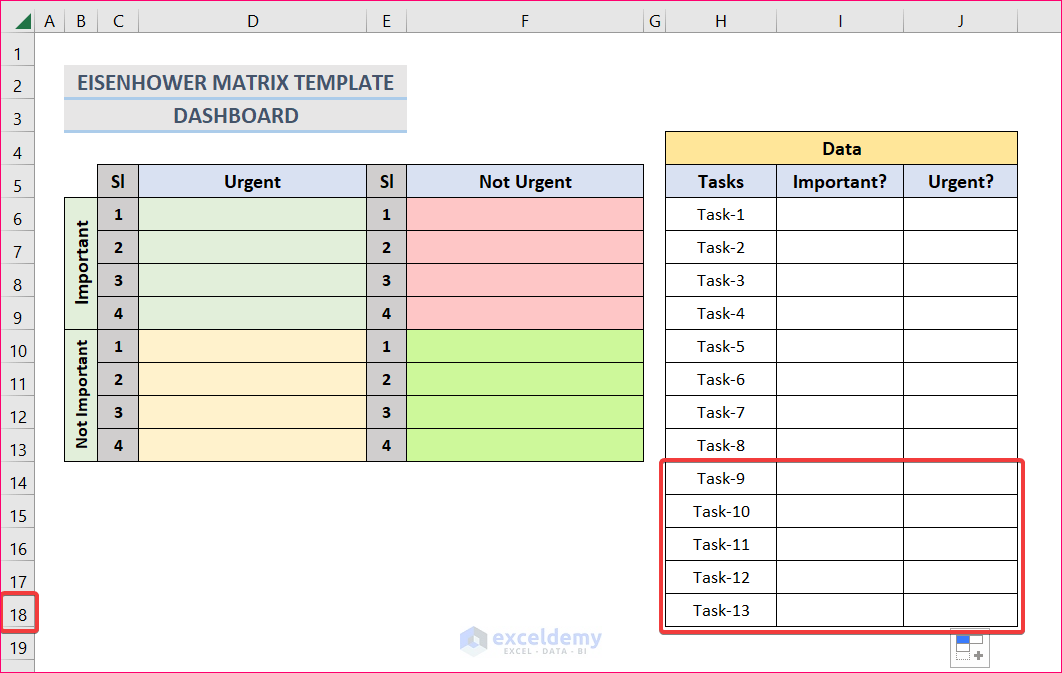
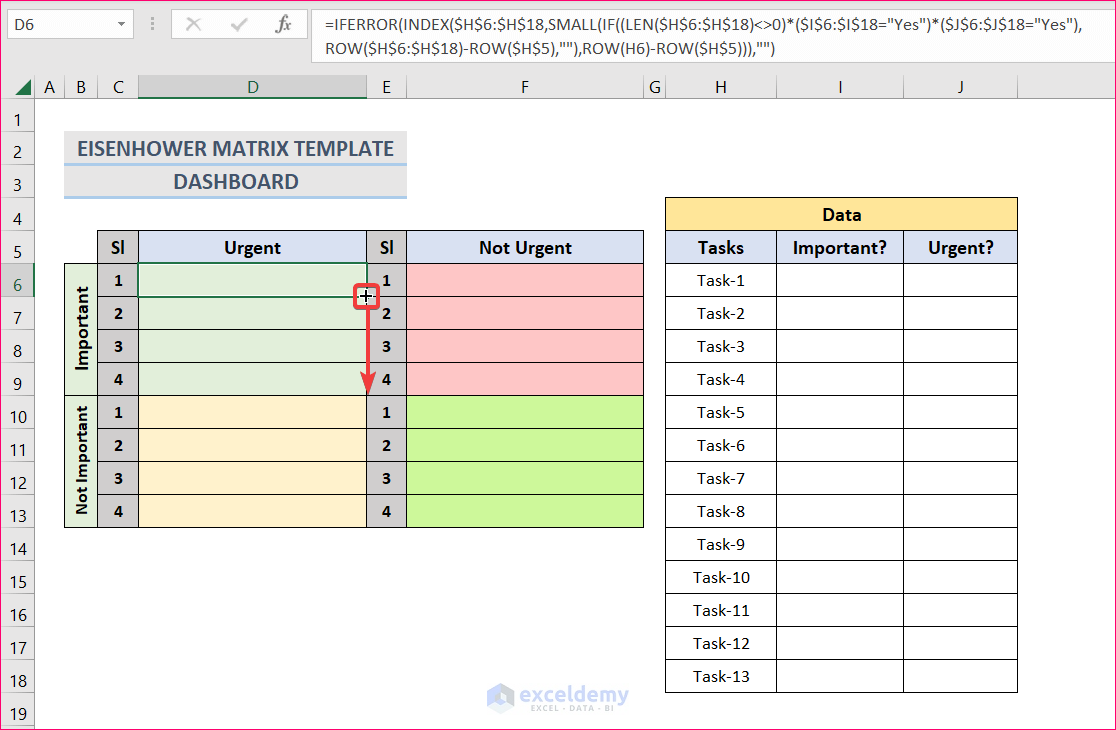
2. In this example, we added five new tasks. Therefore, the new ranges for column H, I and J are H6:H18, I6:I18 and J6:J18 respectively.
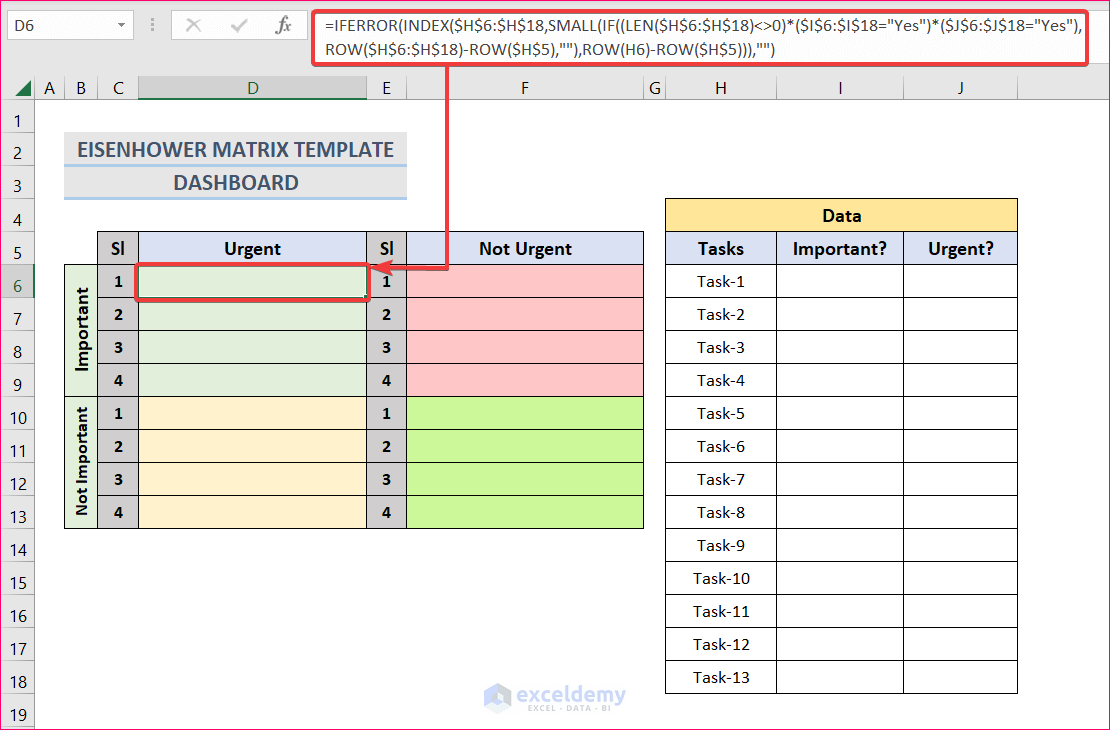
3. Then select cell D6 and change the ranges of H,I and J cells in the formula bar and press Enter. After that, Autofill formula up to cell D9.
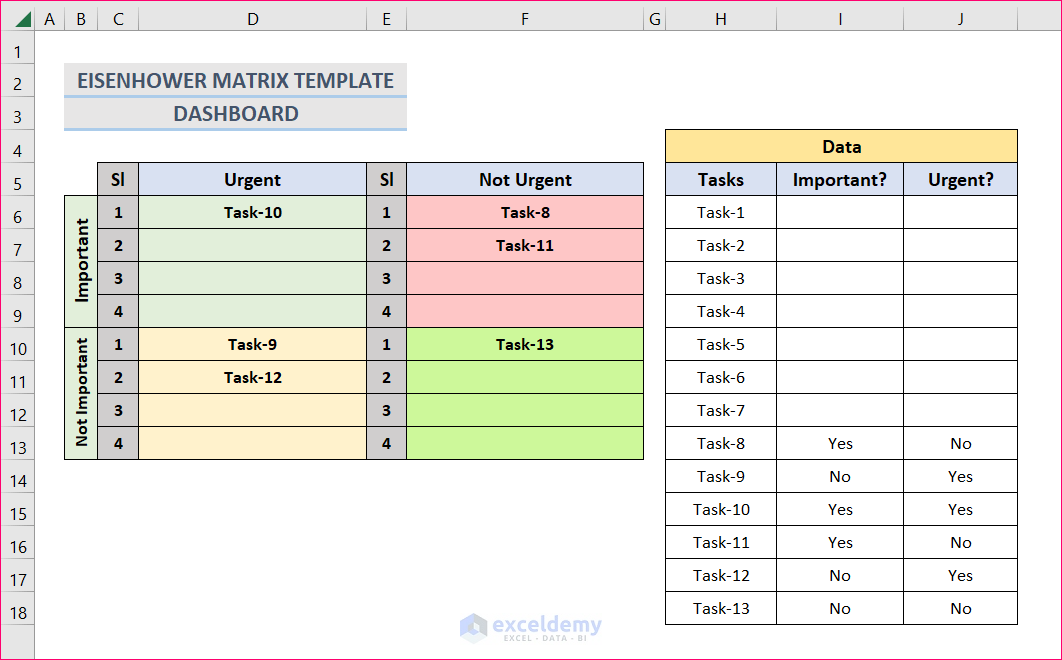
4. Similarly, change the formula ranges for other cells as well.
5. Finally, you can see in the following figure that the formula is working properly.
I hope this solves your problem. Please let us know if you face any other issues.