In Microsoft Excel, it is a common task to make a sales report. Often, we need to calculate sales for a day or month. I will show you some easy tricks to make a sales report in Excel so that you can save a lot of time. Stay tuned.
How to Make Sales Report in Excel: 7 Quick Steps
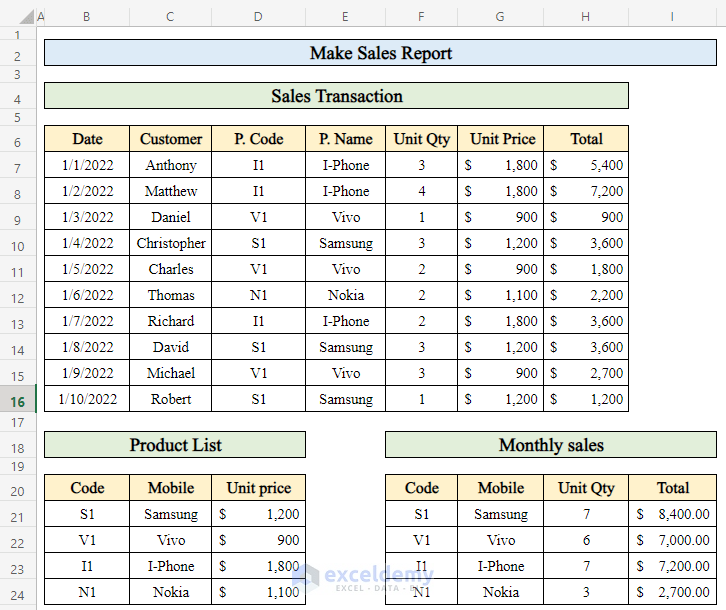
In this article, I will explain 7 quick steps to make a sales report for a mobile shop in Excel. Here we will use three different datasets to make our sales report. In this report, we will find the total amount of money for each mobile phone model. After you complete all the steps, the dataset will look like the following.
Step 1: Get Product Name from Product List
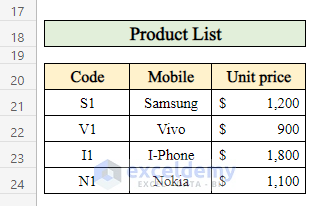
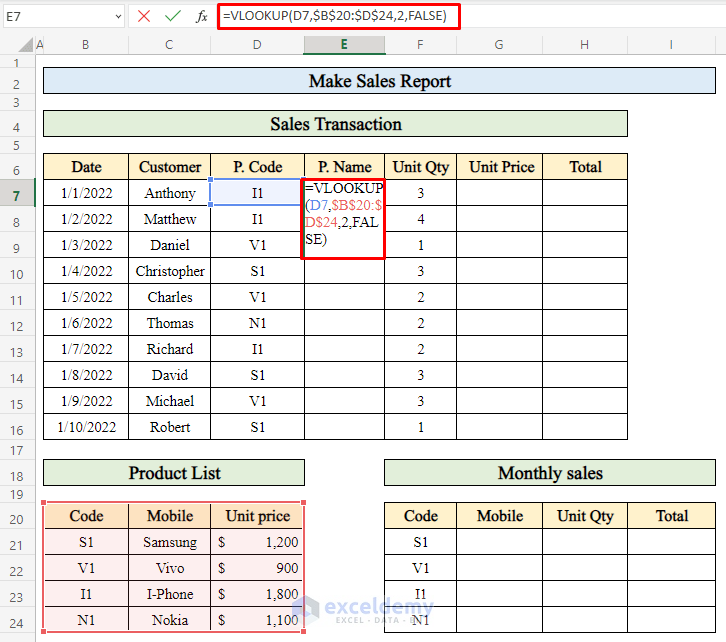
- In order to make a sales report, let’s take some data, like a list of products containing product Code, Product Name, and Unit Price.
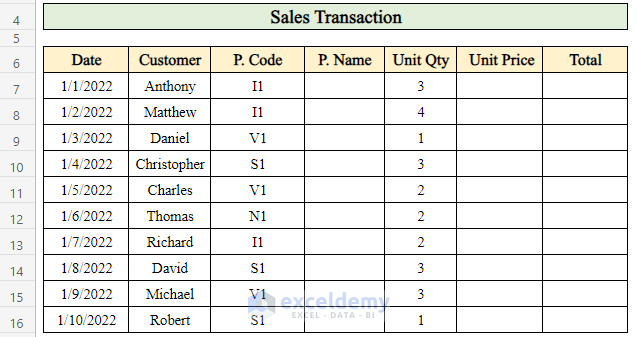
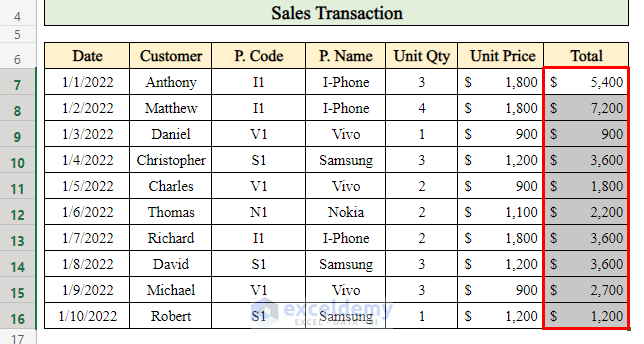
- Now we will calculate daily sales. For that, we took a dataset like the following from which we will calculate product Name, Unit Price, and Total Sales of the day.
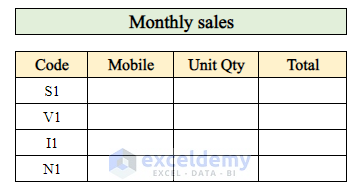
- We got another data table to calculate the total sales of the whole month. Collecting data from the daily sales transaction table, we will calculate total monthly sales.
- Select cell (E7) to apply the formula.
- Put the formula in the selected cell-
=VLOOKUP(D7,$B$20:$D$24,2,FALSE)Where,
- The VLOOKUP function searches for a certain value in a column.
- Press Enter.
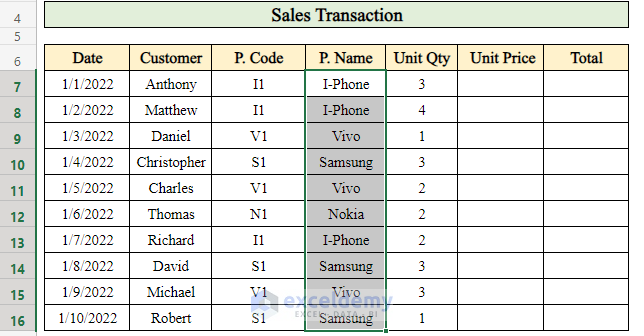
- Drag down the “Fill handle” to get the result in all cells.
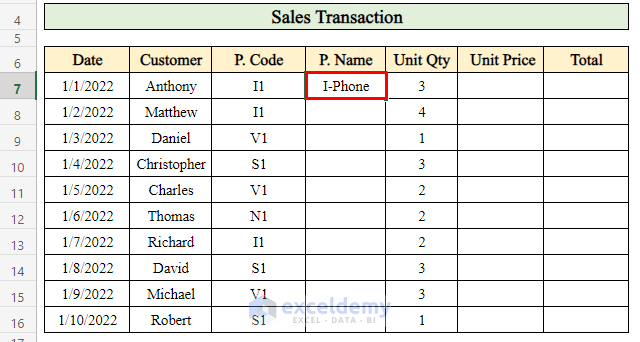
- Thus we can get all the products sold on a particular day by using VLOOKUP formula.
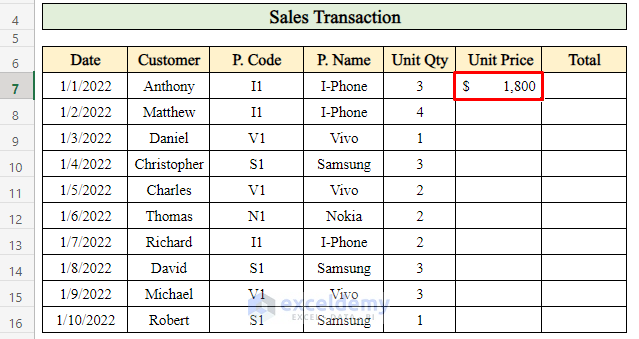
Step 2: Find Out Unit Price in Sales Report
- Let’s calculate the unit price of those products.
- Select a cell (G7) and apply the following formula-
=VLOOKUP(D7,$B$20:$D$24,3,FALSE)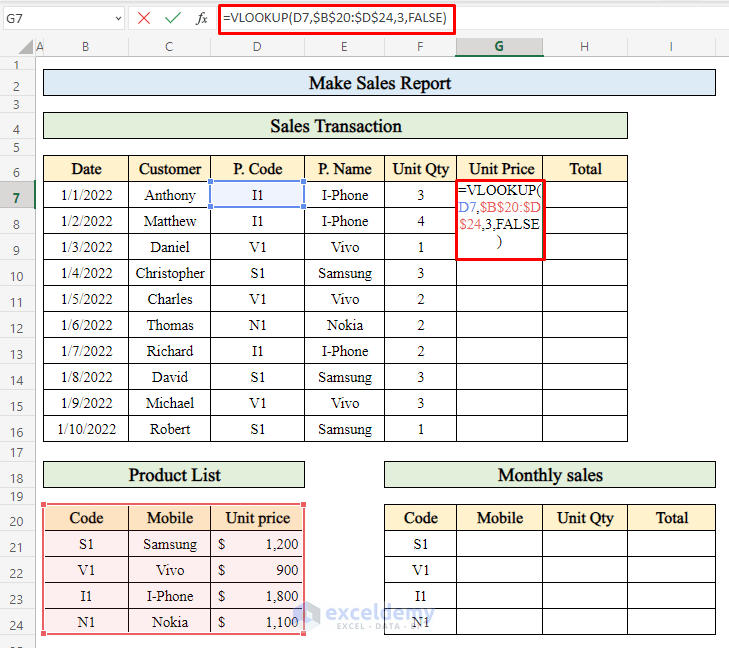
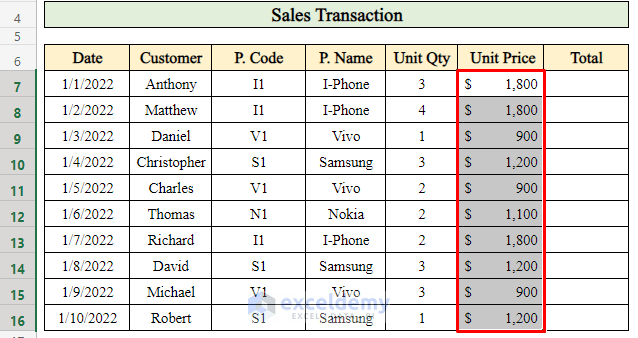
- Click Enter.
- Pull the “Fill handle” down.
- This way, the unit price is sold every day.
Step 3: Calculate Total Sales of the Day
- To get the total sales of a single day we selected a cell (H7) to calculate.
- Apply the formula-
=G7*F7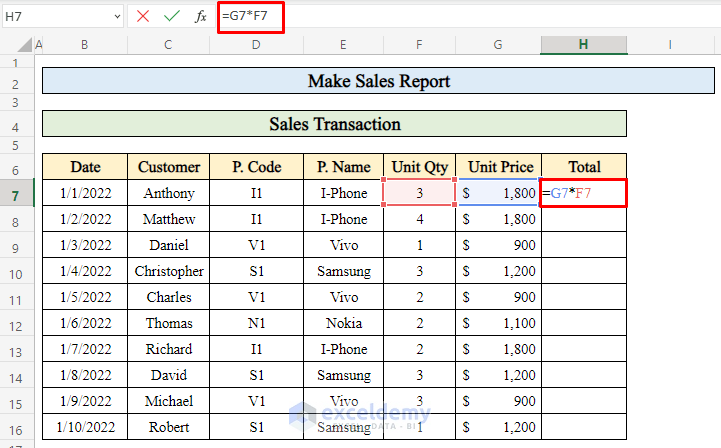
- Press Enter.
- To get total sales for every date, drag down the “fill handle”.
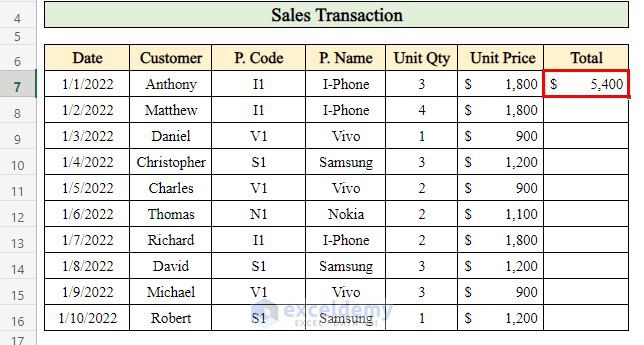
- As you can see, our sales report is ready if we want to calculate everyday total sales.
Read More: Create a Report That Displays Quarterly Sales in Excel
Step 4: Calculate Monthly Sales of a Single Product in Excel
- To get the overview of a sales report we need to calculate the monthly sales. Let’s calculate the monthly sales from our dataset.
- In the monthly sales section of the dataset, at first, we will calculate the product names sold in the particular month. To do that-
- Select a cell (G21).
- Write the formula-
=VLOOKUP(F21,$B$20:$D$24,2,FALSE)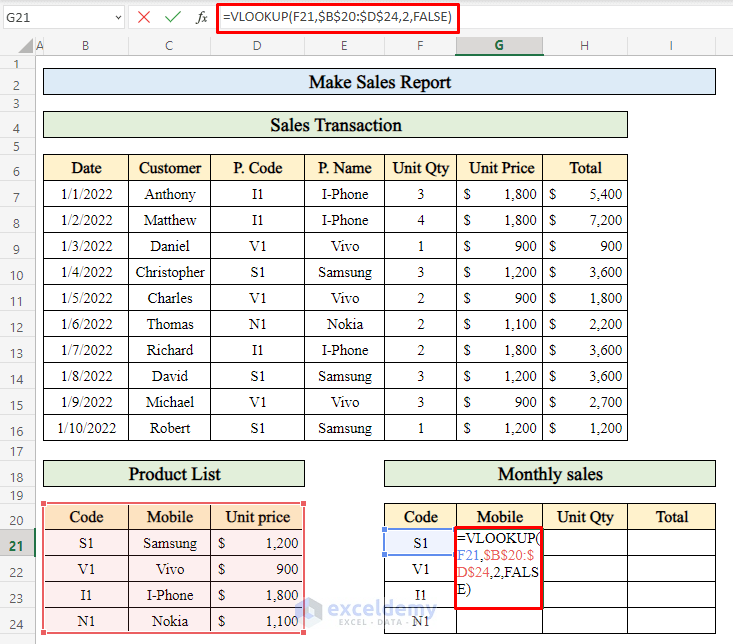
- To get the name of the product in the cell click Enter after writing the formula down.
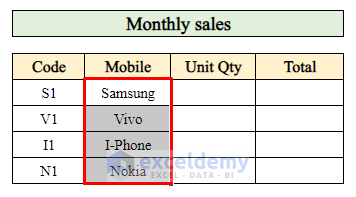
- Drag down the “Fill handle”.
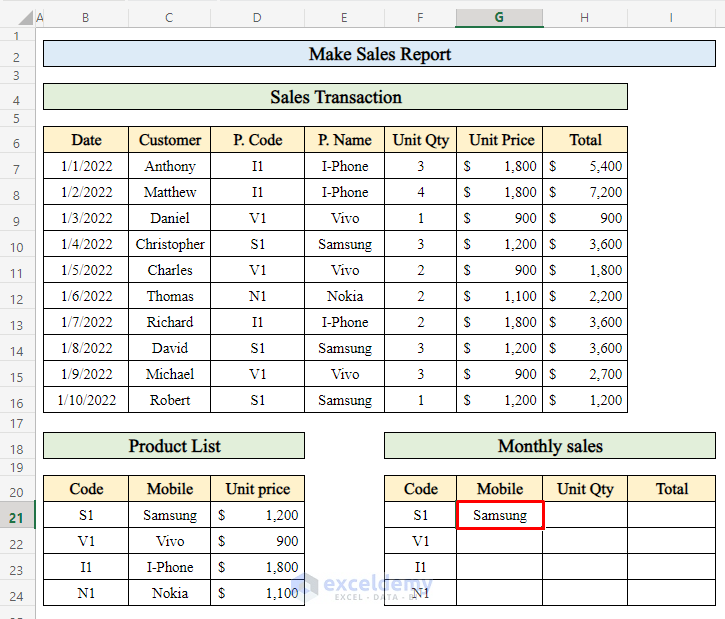
- In the following, you will see we got our product names sold in a particular month.
Step 5: Get Total Quantity of Products Sold
- To compute the total quantity sold in the month, follow these steps-
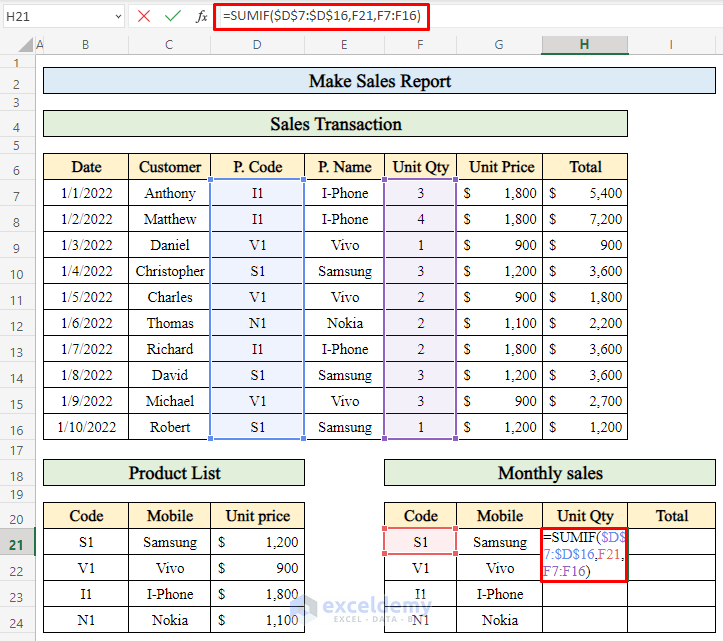
- I have selected cell (H21) to get the desired output-
- Put the formula down in the cell-
=SUMIF($D$7:$D$16,F21,F7:F16)Where,
- The SUMIF function returns the sum of cells that meet a single condition.
- Press Enter.
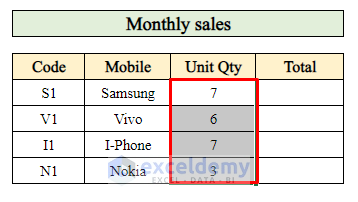
- Drag down the “fill handle”.
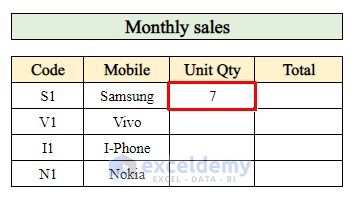
- So here we got our total quantity sold in a month.
Read More: Create a Report that Displays the Quarterly Sales by Territory
Step 6: Calculate Total Sales to Complete the Sales Report
- It’s time for the finishing touch. We will compute the total amount sold in the month.
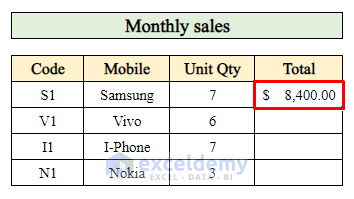
- To calculate total volume choose a cell (I21) to write down the formula.
- In the cell apply the formula-
=SUMIF($D$7:$D$16,F21,H7:H16)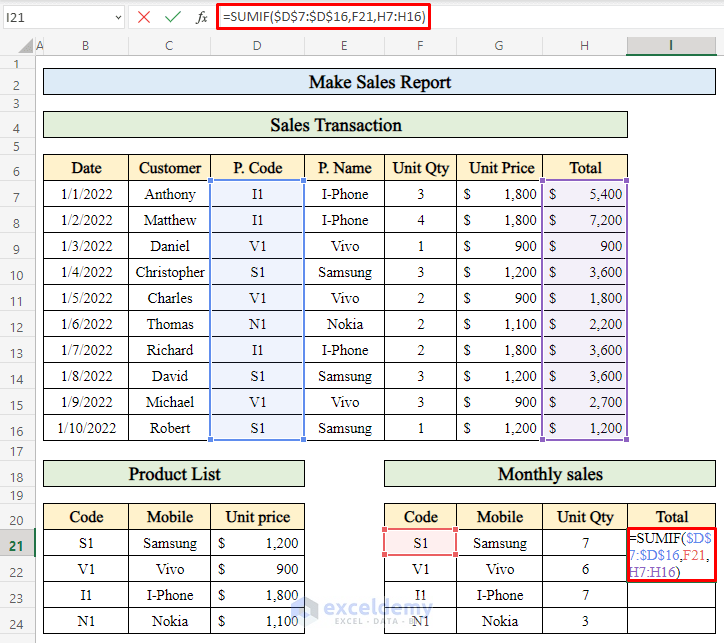
- Click Enter.
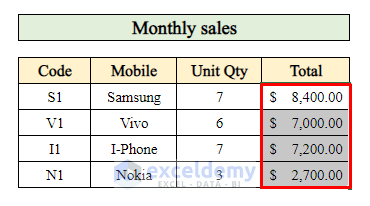
- Now pull the “Fill handle” down.
- Thus we got our total amount sold in a month. Simple, isn’t it? So, here we have successfully completed our sales report.
Read More: How to Make MIS Report in Excel for Sales
Things to Remember
- When applying the VLOOKUP formula in cells, sometimes #N/A error may show. This happens when a formula can’t find what it’s been asked to look for.
- VLOOKUP function always lookup for values from left to right so keep your lookup value in the first column in your dataset.
- For cell range, we will always use the absolute reference ($) symbol to keep the range fixed.
Download Practice Workbook
Download this practice workbook to exercise while you are reading this article.
Conclusion
In this article, I have gone through all the steps to make a sales report properly. I hope you find it useful. If you find any problems regarding this article, don’t forget to let me know in the comment section. Enjoy your time!
Related Articles
- How to Prepare MIS Report in Excel
- How to Make MIS Report in Excel for Accounts
- How to Make Monthly Sales Report in Excel
- How to Make Daily Sales Report in Excel
<< Go Back to Report in Excel | Learn Excel
Get FREE Advanced Excel Exercises with Solutions!
