![]()
“No Macro or installation is necessary. Just download and start using.” – Siam Hasan Khan (Template Developer)
Created using Excel 2016 version
License: Personal Use (Not for resale or distribution)
Let us know (in the comment box) if you have any problems while using this template and we will update it.
Read More: How to Show Percentage Progress Bar in Excel (3 Suitable Ways)
The first worksheet explains how to use the other 4 worksheets in the template.
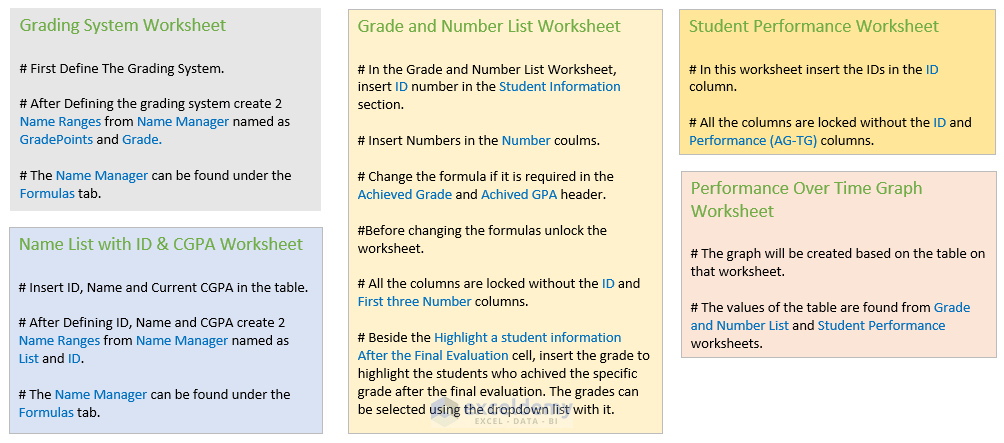
Grading System Worksheet
In this worksheet, the Grades and grade points based on numerical values are inserted.
You can add your own grading system here.
After completing the grading system table, two name ranges are created from the Name Manager under the Formulas tab which are GradePoints and Grade.
Name List with ID & CGPA Worksheet
This worksheet contains student information including ID, Name, and current CGPA.
The sample table contains 23 students but it is possible to add more than this.
Two name ranges are created from the Name Manager which is the ID and List.
Grade and Number List Worksheet
After updating the ID column, the rest of student information section gets automatically updated based on the student ID.
The ID column have a drop-down list option so that you can insert the ID easily.
In this worksheet, you can only insert values in the first three Number columns other than the ID column.
The Final evaluation result is a combination of 20% for both Midterms and 60% for the Final Term.
If you have only one midterm than you can edit the final evaluation result by editing the formula of the last Number column. Delete or insert columns as necessary to work with one or more midterms.
After completing the final evaluation result you will see the number of passed and failed students in each term. These are generated using formulas.
To check which students received an “A+” after the final evaluation, select the Grade besides the Highlight a student information after the Final Evaluation section.
The rows containing students who received an “A+” will be highlighted with green lines after the final evaluation.
Note:
- Before editing the worksheet don’t forget to unlock it as it is locked by default. While it is locked you can only work with the ID and the first three Number columns.
- Check the drop-down lists of your worksheet if you edit the Grading System worksheet and Name List with ID & CGPA.
Similar Readings
- Excel To Do List with Progress Tracker (4 Suitable Examples)
- How to Create a Progress Tracker in Excel (3 Handy Ways)
- How to Track Attendance in Excel (with Detailed Steps)
Student Performance Worksheet
In this worksheet, each student’s performance by calculating the difference between Achieved Grade and Targeted Grade in the Performance (AG-TG) column for each term.
Conditional Formatting is applied in the Performance (AG-TG) columns so that you can easily track the performance change. The sum of this column will evaluate the total student performances every semester, which is calculated in the Overall Performance row.
The maximum cells of this worksheet are linked with the Grade and Number List worksheet without the columns of ID and Targeted Grade.
The cells of these two columns have drop-down lists and they are not protected. You can only insert data in these two columns when the worksheet is protected.
Read More: Progress Bar in Excel Cells Using Conditional Formatting
Performance Over Time Graph Worksheet
In this worksheet you will get a Performance Over Time graph based on the overall student performance, the number of students who passed, and the number of the total failed students.
These values are linked with the Grade and Number List worksheet and the Student Performance Worksheet. Changing any values in these worksheets changes the values of this worksheet.
Related Articles
- How to Create a Progress Bar in Excel (3 Easy Methods)
- How to Make Progress Chart in Excel (2 Simple Methods)
- How to Track Project Progress in Excel (Download Free Template)
- How to Track Multiple Projects in Excel (Download Free Template)
- How to Show Percentage Progress Bar in Excel (3 Suitable Ways)
- How to Make a Progress Monitoring Chart in Excel (with Easy Steps)
Get FREE Advanced Excel Exercises with Solutions!


On tracking students’ performance, Is it not possible to use v lookup (referencing from the grading system sheet in the workbook) to automatically grade students’ score instead of using grade (for each student one after the other) created using data validation?
Yes, it is possible. I insert the grades, grade points and number as most people want to see all of these 3 data. Here the students’ performance is calculated by differencing the Achieved grade and Targeted grade. You can insert the students targeted grade point instead of his targeted grade and calculate the differences between achieved grade point and targeted grade point to calculate the student`s performance.