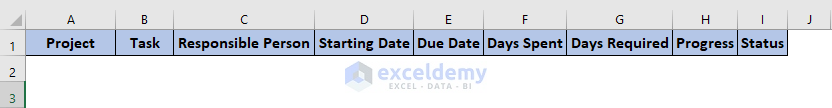
Step 1 – Create Project Layout
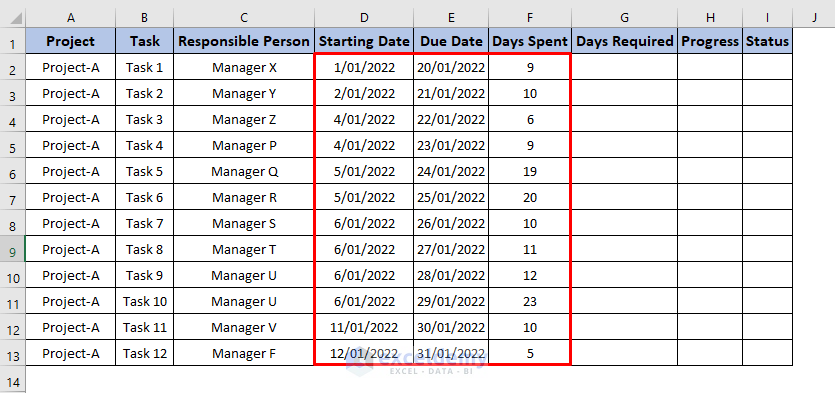
- Type your required Headline fields for your data. Here’s a screenshot that illustrates what the fields could look like.
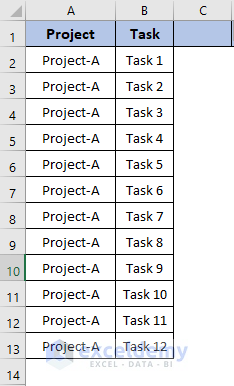
- Enter the Project name.
- Input the task names one by one.
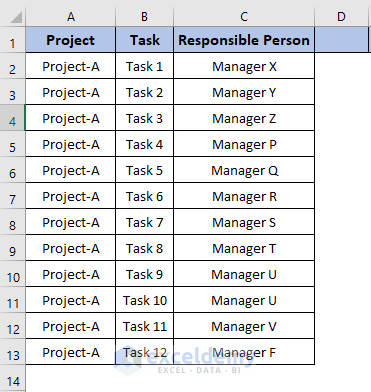
- Input the name of the person responsible for each task.
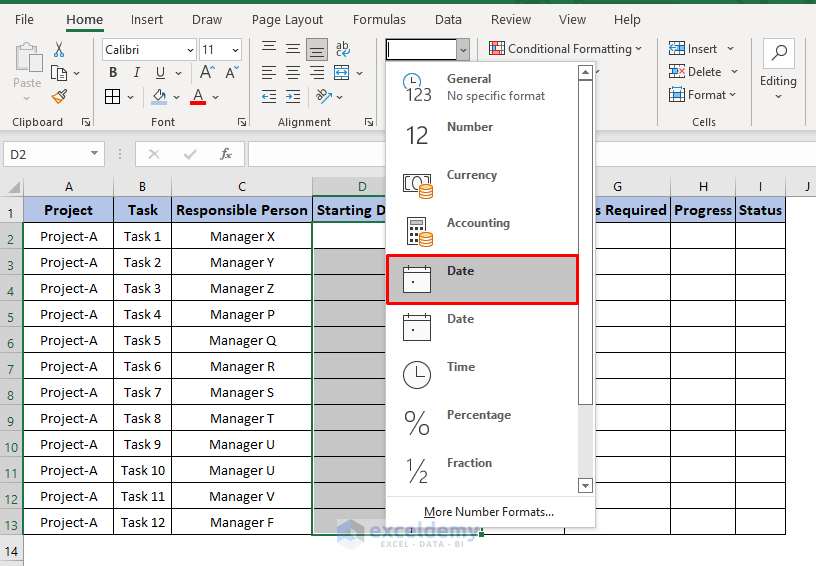
- Select the range of the cells where we want to put dates and select Date from the Format ribbon.
- Input the Starting Date of each task.
- Input the Due Date of each task.
- Input the spent days by each task.
- Calculate the days required by using the following formula in cell G2:
=E2-D2
- Press Enter.
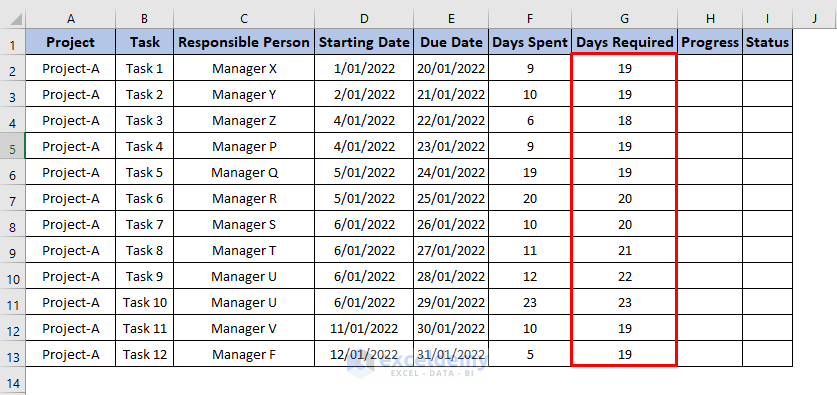
- Drag the Fill Handle icon down to fill in the column.
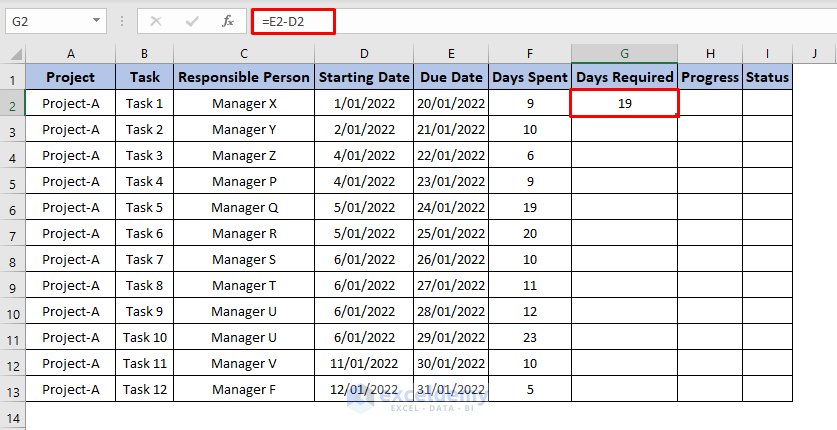
- You will get the Days Required column.
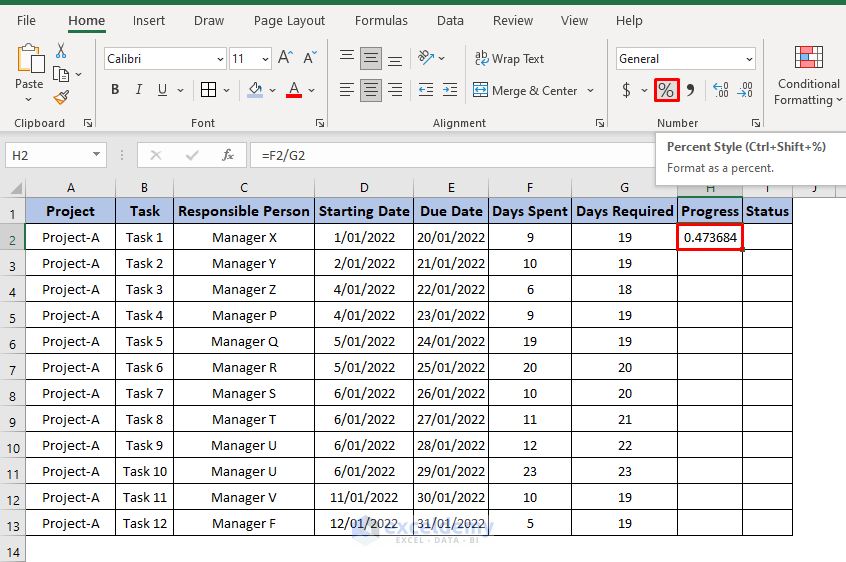
- Calculate Progress by using the following formula in cell H2:
=F2/G2
- Press Enter.
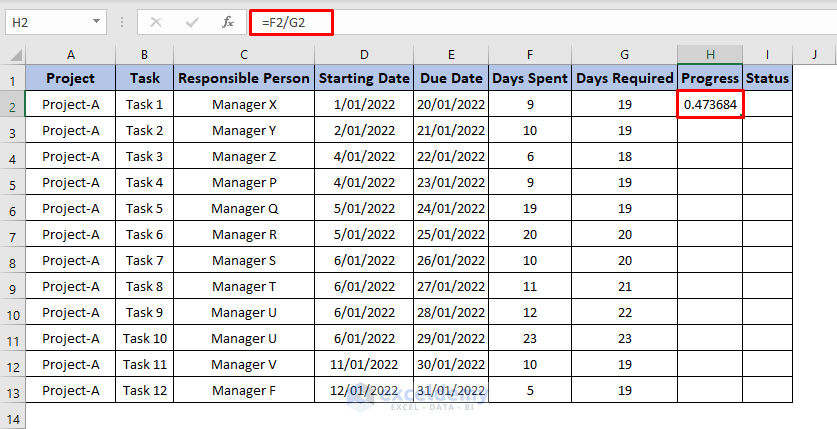
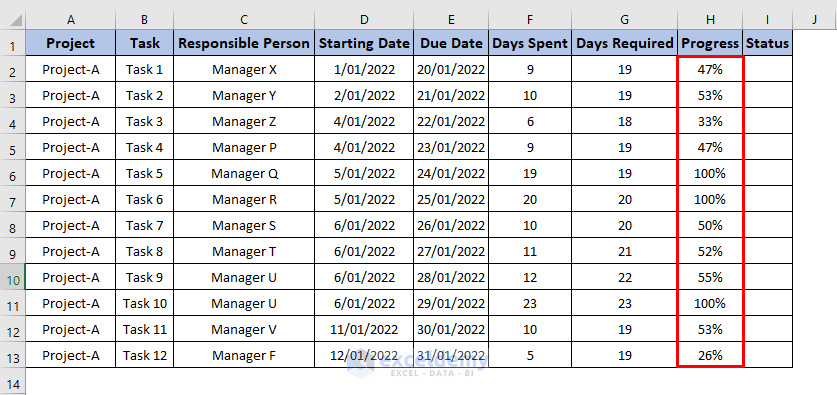
- To convert the data into percentages, click on the Percentage icon in the Number section of the ribbon.
- Drag the Fill Handle icon.
- You will get the Progress column, as shown below.
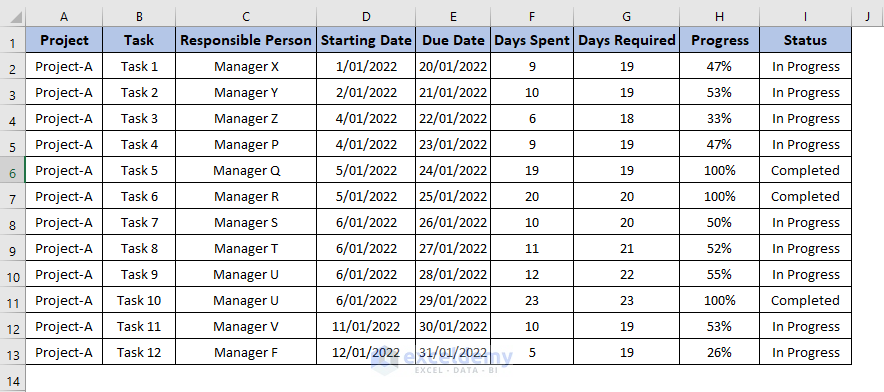
- Input the progress status in the Status column.
- You will get the following output.
Step 2 – Build Tracker List for Project for Automation
- Copy some columns from the previous sheet by pressing Ctrl + C.
- Go to the Project Progres Tracker sheet and press Ctrl + V to paste them as shown below.
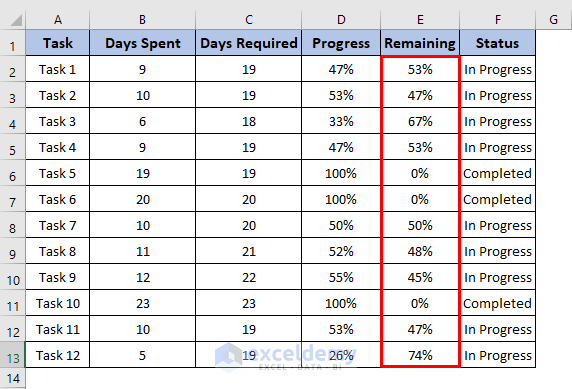
- In the remaining column, use the following formula in cell E2:
=1-D2
- Press Enter.
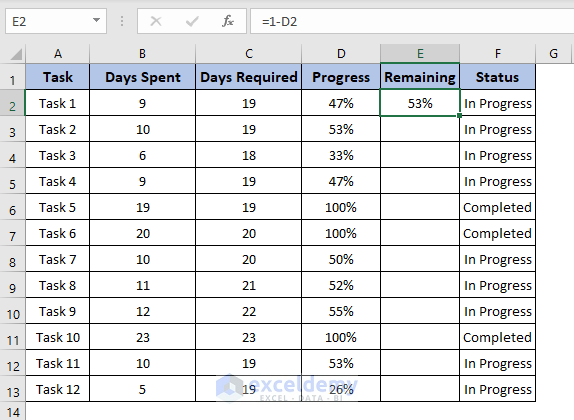
- Drag the Fill Handle icon. You will get the Remaining column, as shown below.
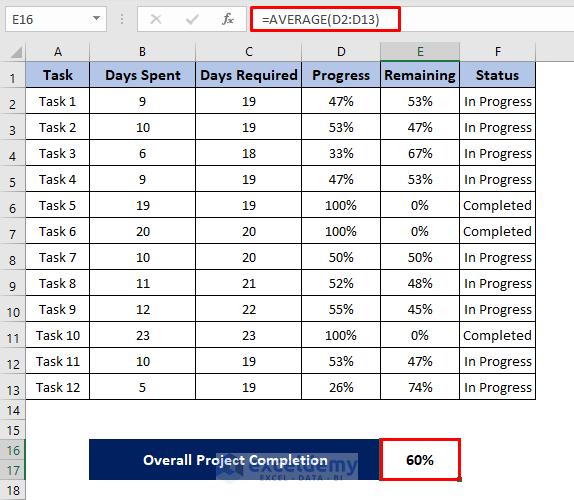
- To calculate the overall project completion, use the following formula in cell E16:
=AVERAGE(D2:D13)
The AVERAGE function returns the average of the twelve tasks which is almost 60 percent.
- Press Enter.
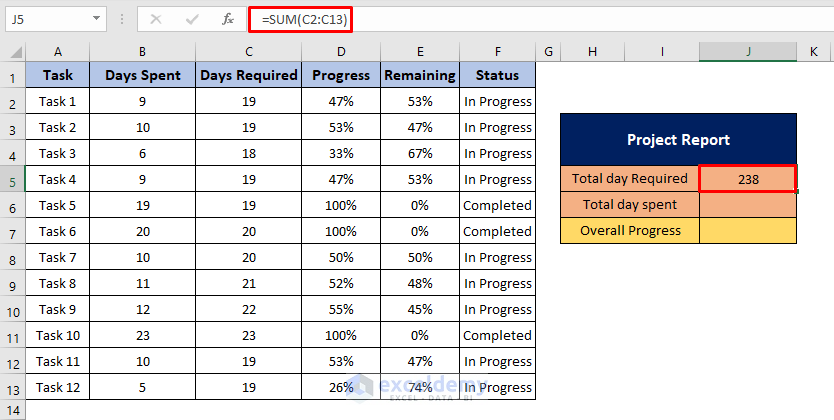
- To calculate the total days required, use the following formula in cell J5:
=SUM(C2:C13)
The SUM function returns the combined days of the Days Required column.
- Press Enter.
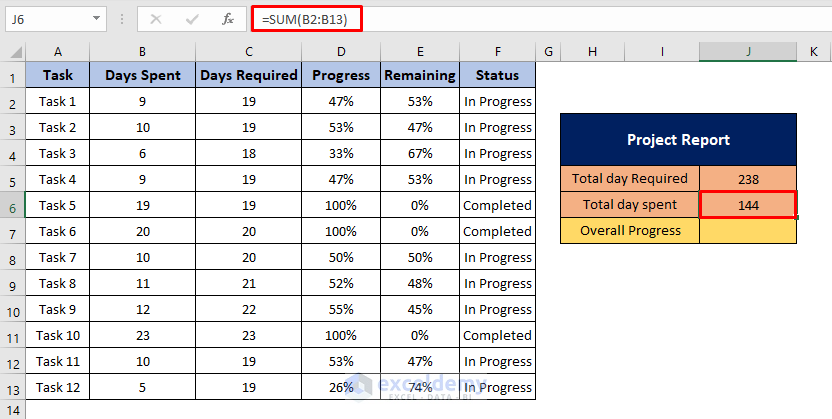
- To calculate the total days spent, use the following formula in cell J6:
=SUM(B2:B13)
The SUM function returns the combined days of the Days Spent column.
- Press Enter.
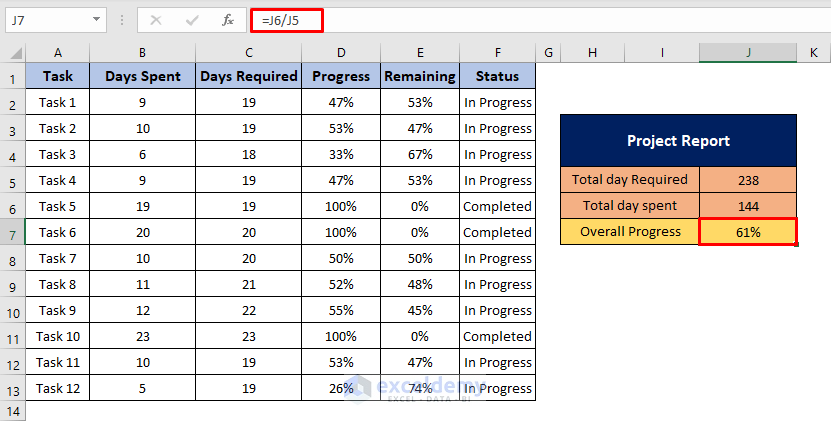
- To calculate the overall project progress, use the following formula in cell J7:
=J6/J5
- Press Enter.
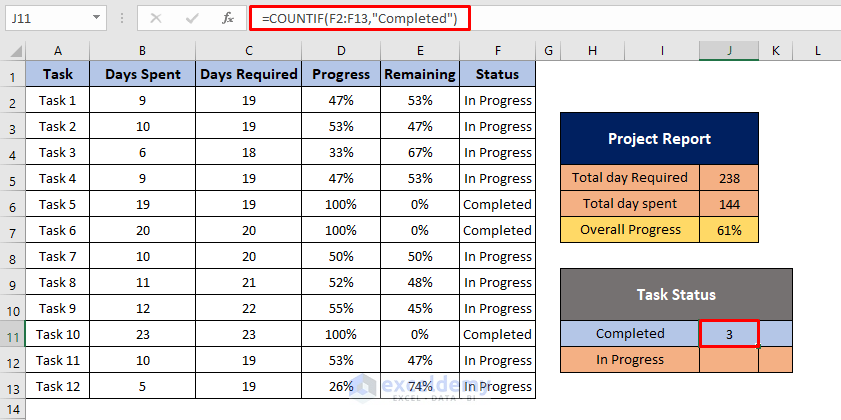
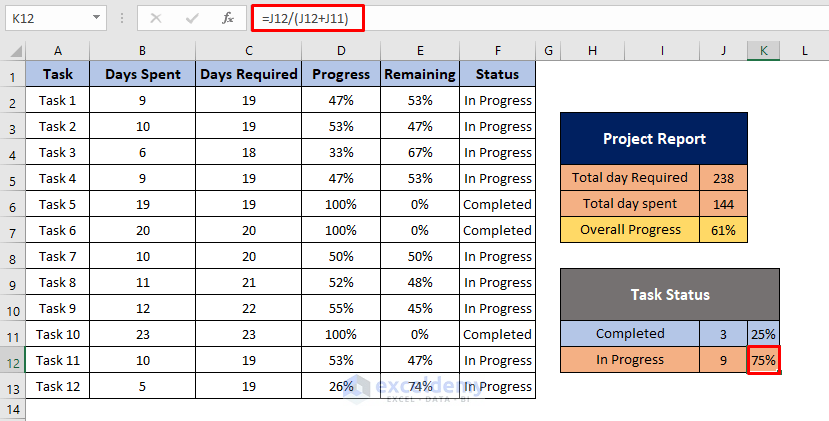
- To create a dynamic summary like Task Status, use the following formula in cell J11:
=COUNTIF(F2:F13,"Completed")
The COUNTIF function will return the value by counting the number of cells of the range F2:F13 where the given condition is “Completed”. Using this approach, we will calculate how many tasks have been completed in this project.
- Press Enter.
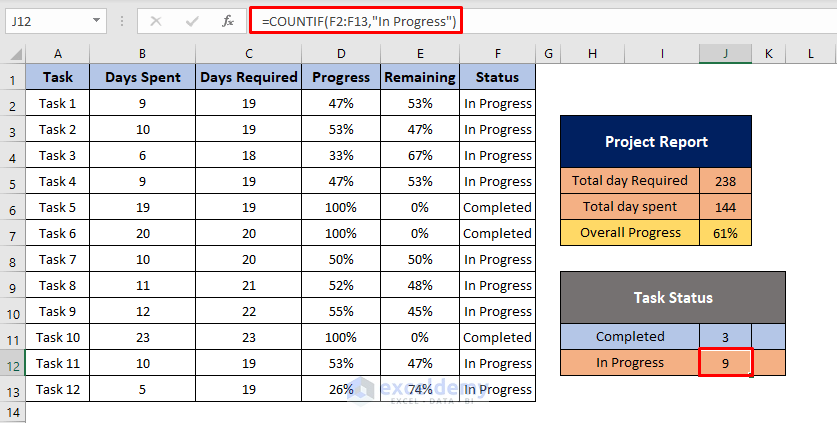
- Use the following formula in cell J12:
=COUNTIF(F2:F13,"In Progress")
The COUNTIF function will return the value by counting the number of cells of the range F2:F13 which satisfy the condition “In Progress”. This calculates how many tasks are in progress in this project.
- Press Enter.
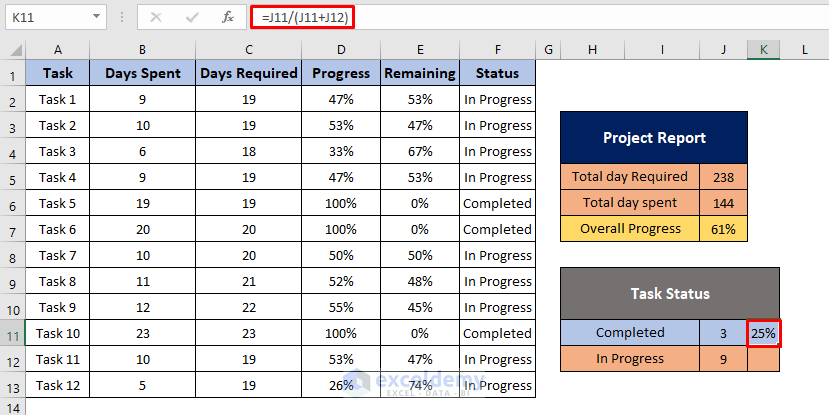
- To calculate the percentage of completed tasks, use the following formula in cell K11:
=J11/(J11+J12)
- Press Enter.
- To calculate the percentage of tasks in progress, use the following formula in cell K12:
=J12/(J12+J11)
- Press Enter.
- We get the dynamic summary Task Status.
Step 3 – Insert Charts for Project Progress Tracker
- Select the range of data you want to chart and go to the Insert tab.
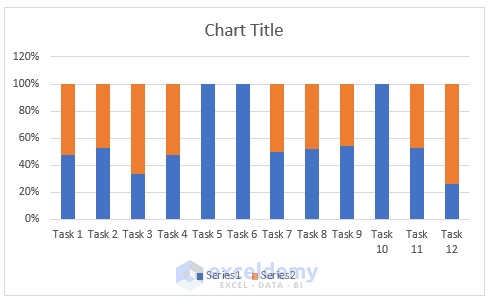
- Select the Stacked Column chart.
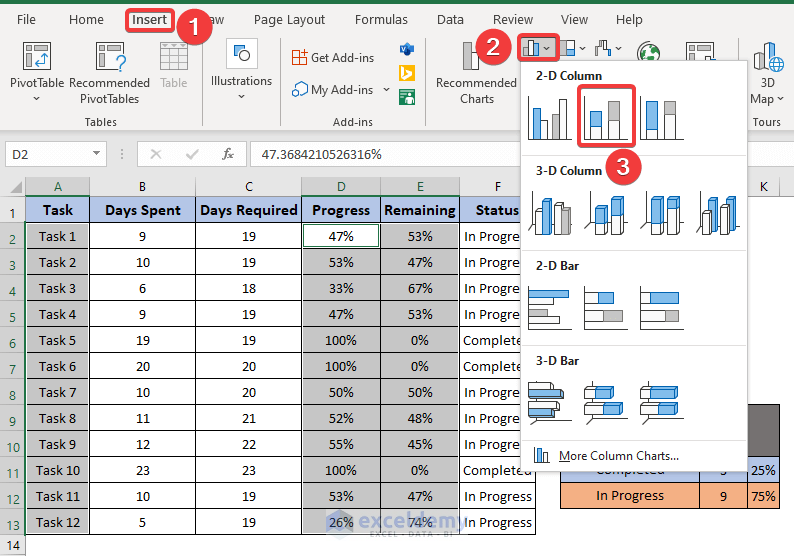
- As a consequence, you will get the following chart.
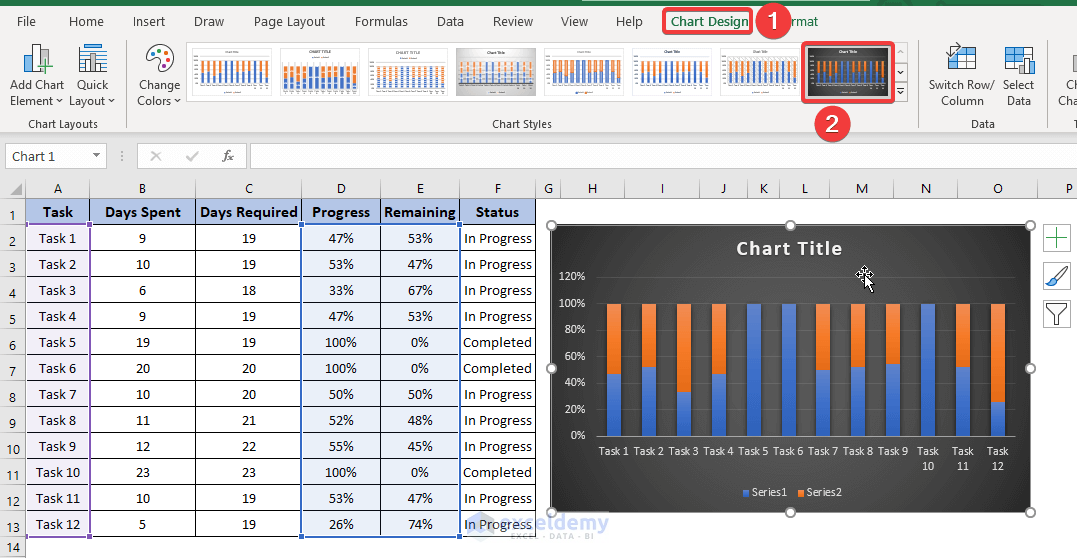
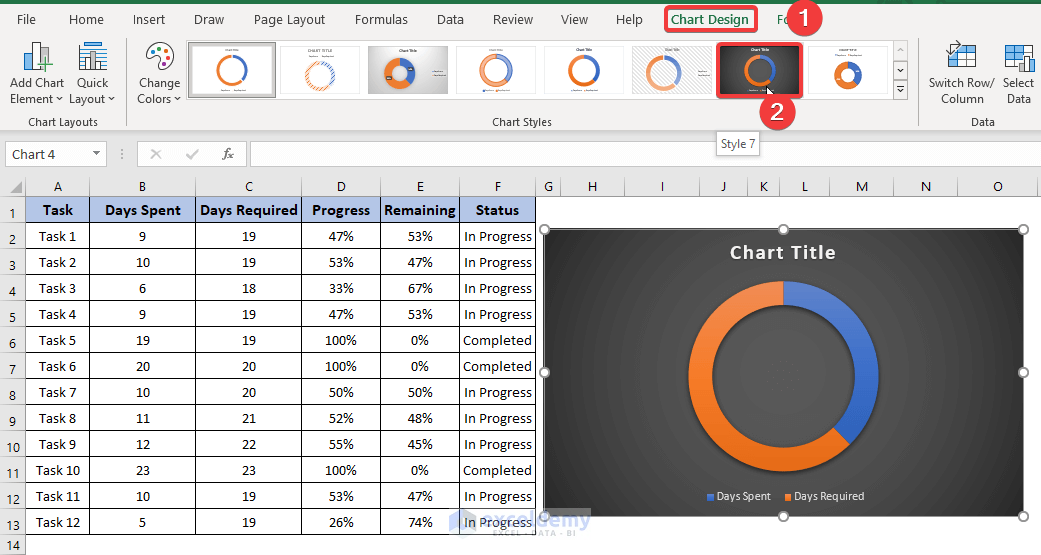
- To modify the chart style, select Chart Design and select your desired Style option from the Chart Styles group.
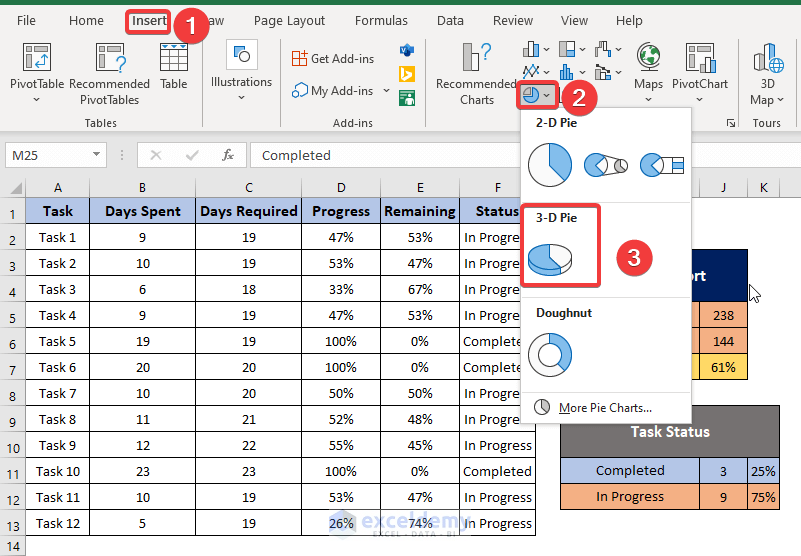
- To create a Pie chart, select the range of data and go to the Insert tab.
- Select the 3-D Pie chart.
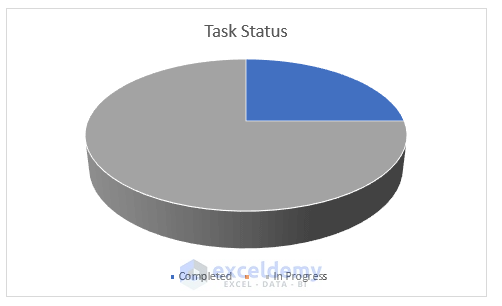
- You will get the following Pie chart.
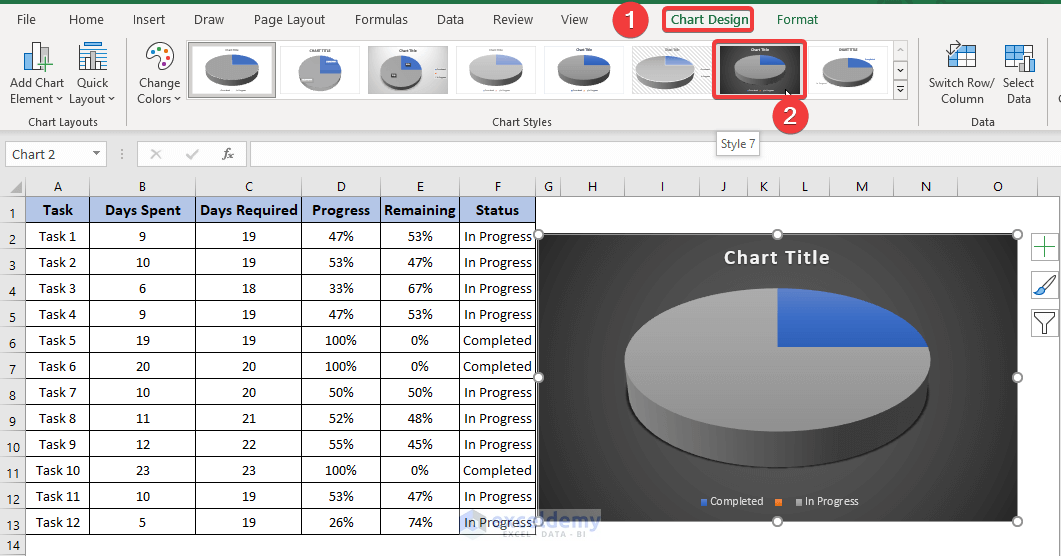
- To modify the chart style, select Chart Design and select your desired Style option from the Chart Styles group.
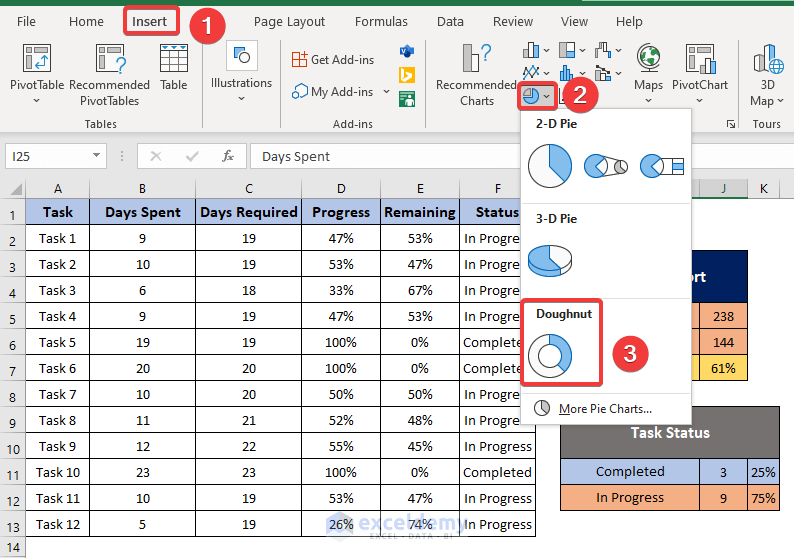
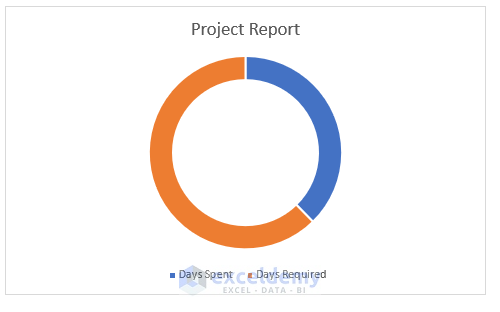
- To create a Doughnut chart, select the data range and go to the Insert tab.
- Select the Doughnut chart.
- You will get the following Doughnut chart.
- To modify the chart style, select Chart Design and select your desired Style option from the Chart Styles group.
Step 4 – Generate Dynamic Project Progress Summary
- Create a new sheet and set the name of that sheet as Project Performance.
- Copy every chart by pressing Ctrl + C.
- Go to the Project Performance sheet, and press Ctrl + V to paste the charts.
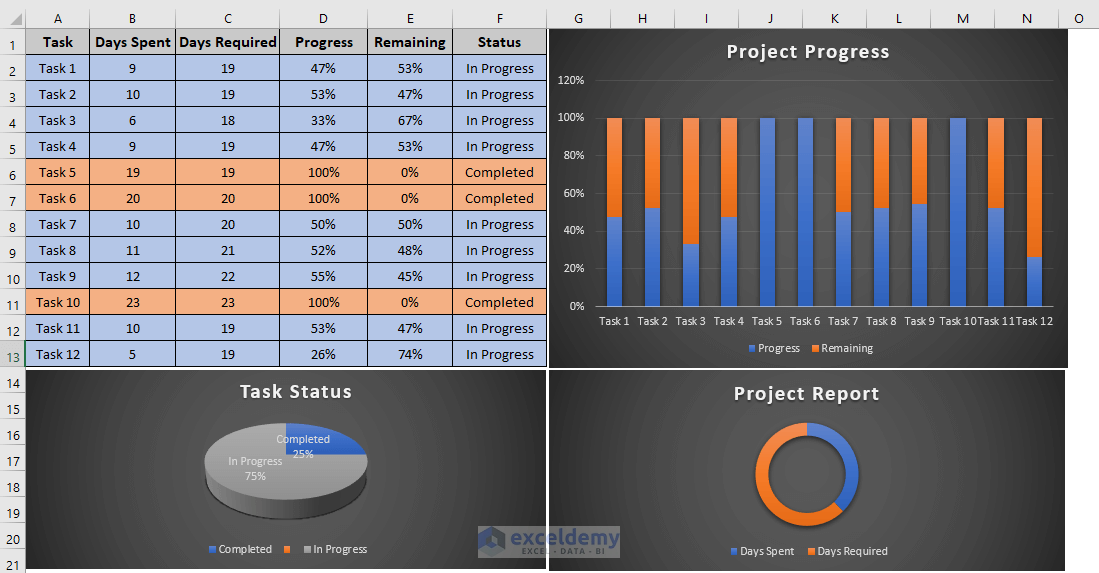
- You will get the final output like the following.
Read More: How to Track Multiple Projects in Excel
Download Template
Download this template while you are reading this article.


So very good
Dear Macel Williams,
You are most welcome.
Regards
ExcelDemy
Hi this is wonderful if I must report every day do I send project report that derives from overall project completion, what part of all this do I send to my boss updated every day,second question is task status if I add probably another day spend on my overall project completion tracker manually then my task status don’t change it only changes the first time when I add completed if I change manually ‘days spend’again yes the percentage change but the task status where it says complete stays the same please help there
Dear Macel,
Greetings. When tracking project progress in Excel, it is important to provide your boss with concise and relevant information. Here are some recommendations to address your questions:
Daily Project Report: When sending a daily project report to your boss, focus on key updates and highlights. Include information such as completed tasks, milestones achieved, any critical issues or risks, and a summary of overall project progress. It’s not necessary to send the entire project tracker every day; instead, provide a brief overview or summary.
Task Status and Overall Project Completion: If you manually add an extra day to your overall project completion tracker without updating the task status, the completion status will remain unchanged. Task status should reflect the progress of individual tasks, while the overall project completion tracker represents the aggregate progress. To ensure accurate reporting, make sure to update both the task status and the overall project completion tracker accordingly.
Apply the following formula in the Task status column, then drag it down to alter the task status dynamically.
=IF(H2=100%, “Completed”, “In progress”)
Hi I don’t get it what you are saying I’m so sorry to bother you again you said to drag down the formula to the task status column is it the box that siad Task status and drag then to the box that said complete or firs put in complete column and dragged to in process please help , and is this formula for every day that I will probably add in any task
Dear Marcel,
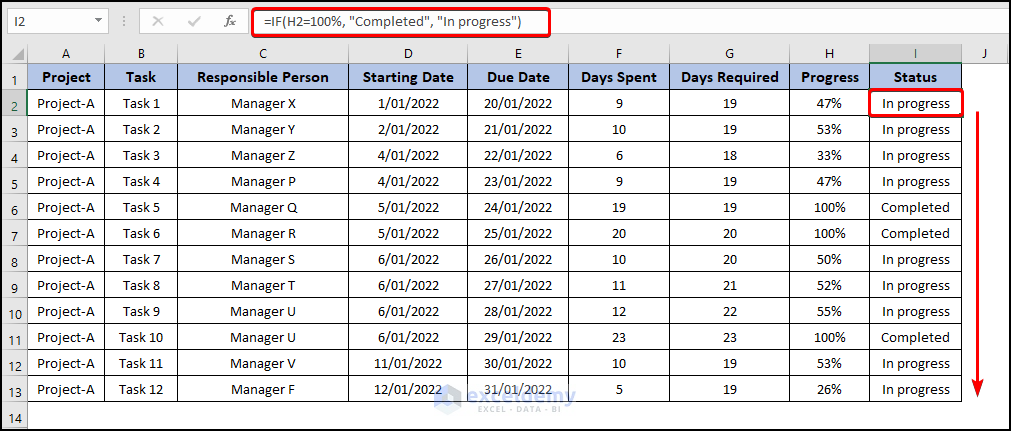
Apply the following formula in the Task status column, then drag it down to alter the task status dynamically.
=IF(H2=100%, “Completed”, “In progress”)
Ok good I fell in love with this tracker.i want to master this one.tell me teacher if I do a shutdown like n 90 present pipe work on a rig can I add more stuff to my tracker without format it like adding line numbers, xray, hydrotesting painting ndt, dypenetration,or even giving it a small percentage so at the end it must all give 100 present, and how will I put in milestones in this tracker.
Dear Macel,
Greetings. In order to track project progress in Excel and incorporate additional tasks, milestones, and percentages, you can follow these steps:
Open your project tracker in Excel or create a new one.
Make sure your tracker has the necessary columns to accommodate the new tasks. You can add columns for line numbers, X-ray, hydrotesting, painting, NDT (non-destructive testing), dye penetration, and any other relevant tasks you mentioned.
To maintain the formatting and calculations in your existing tracker, insert new rows for the additional tasks. Right-click on the row number where you want to add the new tasks and select “Insert” from the context menu.
Enter the task names and other relevant details in the newly inserted rows.
Adjust any formulas or calculations in your tracker to include the new tasks. For example, if you have a column for task completion percentages, you may need to update the formulas to include the newly added tasks in the calculation.
To ensure that the total progress always adds up to 100%, you can either manually adjust the percentages or create formulas that automatically calculate the percentages based on the completed tasks.
To add milestones to your tracker, you can designate specific rows as milestone markers. You can either create a separate column for milestones or use conditional formatting to visually highlight the milestones. You can also add a separate column to describe each milestone and provide additional details if necessary.
Remember, the specific steps may vary based on your Excel version and the structure of your project tracker. Experiment with different approaches to find the one that suits your needs best.
To ensure accurate reporting, make sure to update both the task status and the overall project completion tracker accordingly.
Apply the following formula in the Task status column, then drag it down to alter the task status dynamically.
=IF(H2=100%, “Completed”, “In progress”) can you please just take an snapshots of how to do this please
Hi sir good morning everything works good now is just one question my task status the wit the two rows the first row is for complete second row for in progress the problem I got now is I the cell where I put days spend does not change like if I add day for spending it change everywhere except in task status rowand there for not in my task status pai please can you help
Dear Macel Williams,
To customize any templates you can contact with us via this mail problem @exceldemy.com
Regards
ExcelDemy
Dear Macel,
In the comment above, I already answered your question.
Hi again me when I get to the pi part in it gives me just a circle I don’t know if I’m using the wrong data , I use the status bar but I just can’t get the results you got
Ok I understand you I will try and se if I can get it thanks for your patience I finished the hole tracker just the pi part not the donut one that is fighting with me but thanks very much you was of good help
Dear Macel,
In the comment above, I already answered your question.
Hi Ahmad I done alot thanks to you only one question before I leave you in peace .when I get to the pi area it said by consequences I will get n pi with task status and as legend- complete and in progress but I dond I don’t know if I’m highlighting the wrong range it just doesn’t show it only shows a like a radius link where the pi suppose to sit please help
Hello Marcel,
Greetings. I could not understand your question. It would be much easier for me to answer your question if you could send me your Excel workbook at [email protected].
Yes sorry sir thanks
Dear Macel,
You are welcome.
Regards
ExcelDemy
Hi there good morning so far so good hope you well, sir is there a formula between task status row one where it say complete then the next cell in the same row gives the amount task complete now that specific row for giving task complete is there a formula that adds automatically the number completed when a task is complete and update in the same instant my pi chat.
Dear Macel Williams,
To customize any templates you can contact with us via this mail problem @exceldemy.com
Regards
ExcelDemy
what about if i forgot password and to open it for me
Hello Marcel,
If you forget the password of an Excel file, Excel itself doesn’t provide a built-in way to recover or remove it. The available options are:
1. Check if the file owner or creator can resend the file or share the password
2. Restore an earlier unprotected version from backup (OneDrive, Google Drive, File History, etc.)
3. If it’s a sheet/workbook structure password (not file-open password), VBA-based recovery methods may work
4. For file-open passwords, you’ll need the original password or a professional recovery tool
Regards,
ExcelDemy