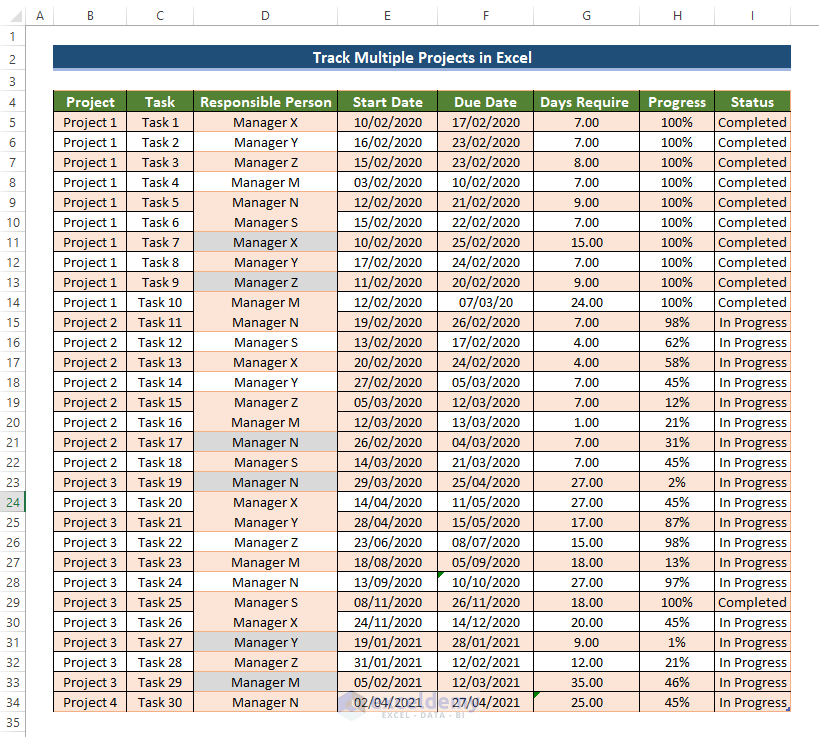
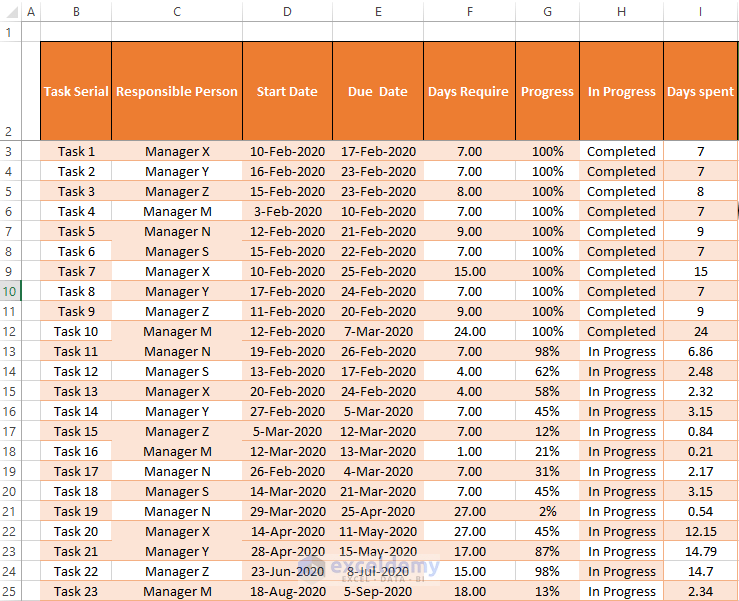
Step 1 – Collecting Data in Excel from Multiple Projects
- Organize the data by dividing your project into smaller tasks, and scheduling them into starting dates and due dates.
- Assign a manager who is going to be responsible for the task.
- Mark their progress. And note it down on the sheet.
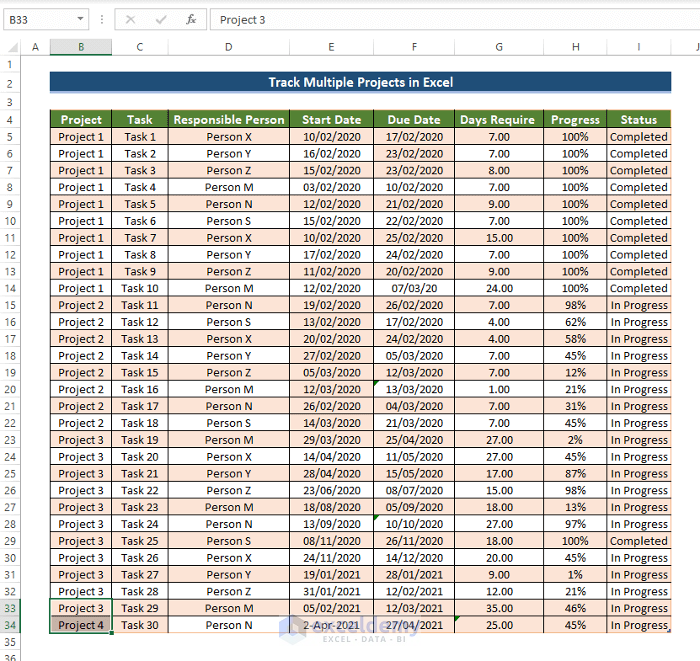
- Create a new worksheet and from that worksheet, link all of the data from the datasheet tab.
- Add a column of days spent to calculate the number of days for each task to be completed.
- To do this, enter the following formula in cell G3.
=E3-F3- Drag the Fill Handle icon to cell G32.
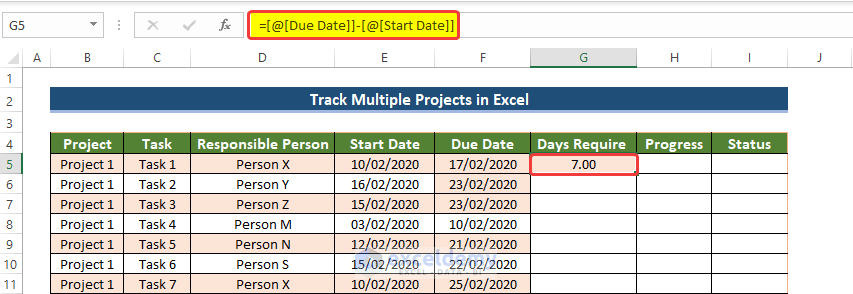
- The range of cells G3 to G32 is now filled with the differences between the Start Date and the Due Date of each task.
- Add how many days have been spent on each task to date. To do this, enter the following formula in cell L3:
=G3*F3
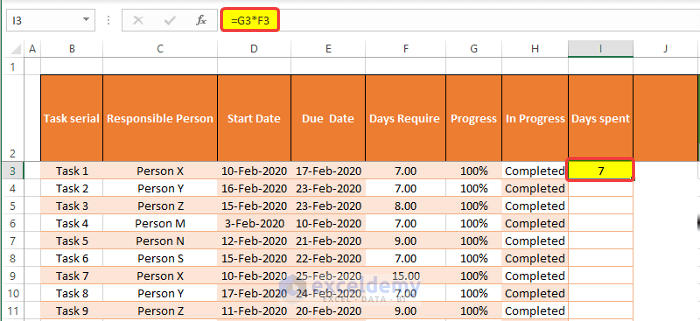
- Drag the Fill Handle to cell L32 and it will fill the cells with days spent on each task.
Step 2 – Preparing Gantt Chart
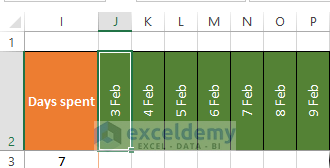
- To prepare a Gantt chart using this information, we need to create a timeline for all of the tasks done.
- Set the initial date for timeline and set the final date of the timeline. In this case, it is 3 February 2020 and the final due date is 27 April 2021.
- As we need to set a timeline for each day, we set the formula bellow:
=J2+1Drag the Fill Handle horizontally till 27 April 2021.
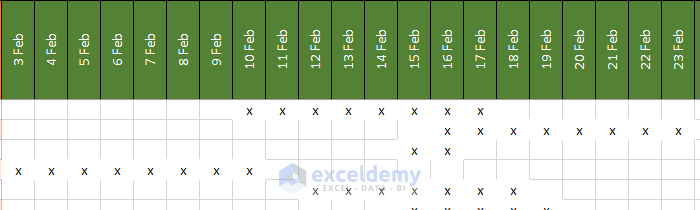
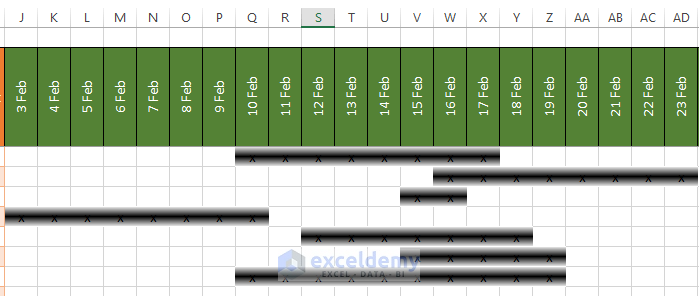
- Format the cells to show text vertically in order to view more rows in less space.
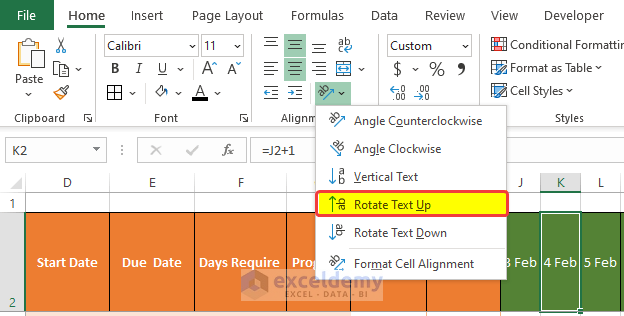
- All of the headers are now rotated anticlockwise.
- Select cell J3 and enter the following formula:
=IF(AND(J2>=$D$3,J2<=$E$3),"x","")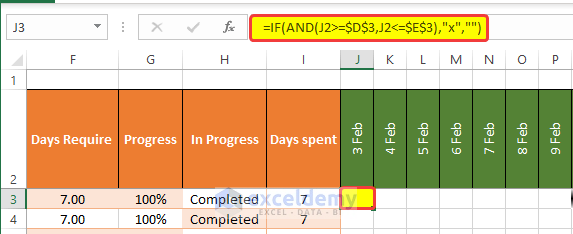
- Drag the Fill Handle horizontally.
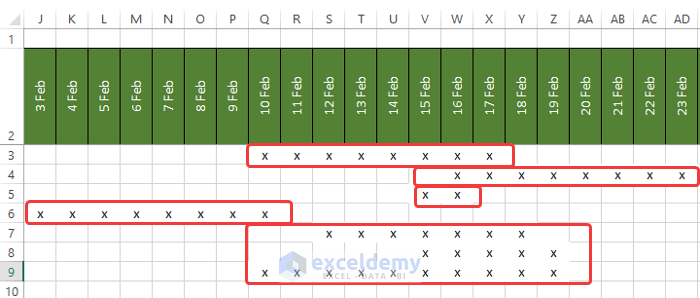
- Doing this will put an “X” for dates the task has been done.
Repeat the same process for the other cells, for example, select cell J4 and enter the following formula.
=IF(AND(J2>=$D$4,J2<=$E$4),"x","")Drag the Fill Handle icon to the horizontal end.
- Repeating the formula for all rows will mark all of the task’s timeline.
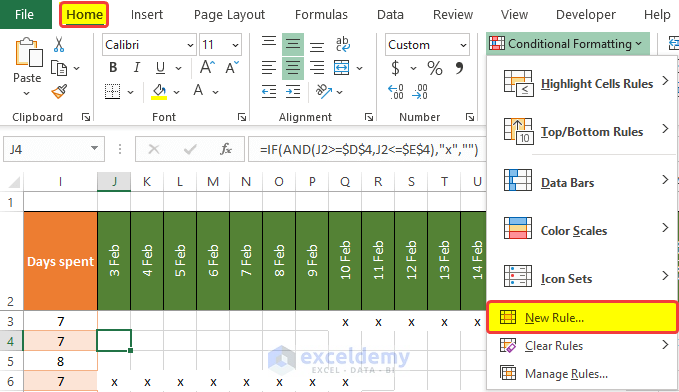
- We will use conditional formatting to create a Gantt chart from those marking.
- To do this, click on Conditional Formatting from the Home tab.
- Click on New Rules.
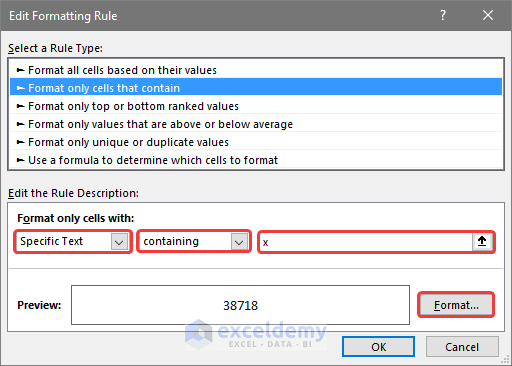
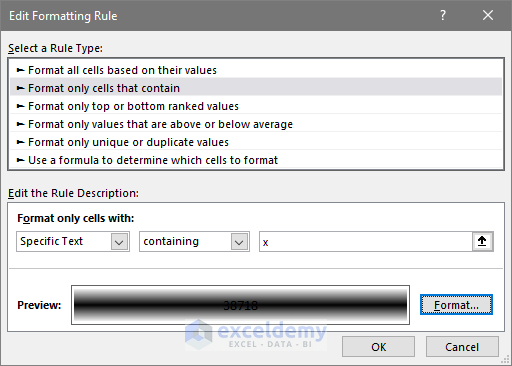
- In the new window, select Format only cells that contain options from the Select a Rule Type box.
- In the Format only cells with the dropdown menu, select Specific Text in the first dropdown box and select Containing in the second dropdown box.
- In the third box, we need to specify our mark letter. We put x, as we want to mark the task timeline with x.
- Click on Format.
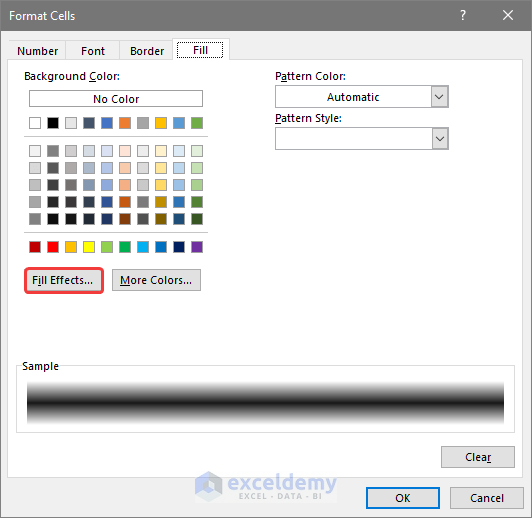
- In the new format window, go to the Fill tab and click on Fill Effects.
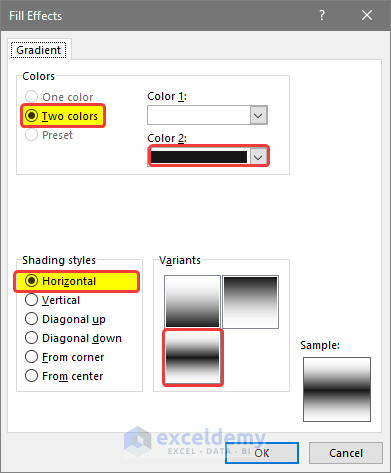
- In the Fill Effects window, select Two colors.
- Select your desired colors, we choose Black and White as the Color 2 and Color 1.
- In the Shading Styles, choose Horizontal.
- In variants, choose your preferred variant. We choose the middle stripe one.
- There will be a sample window showing how the formatting will look in the worksheet.
- Click OK.
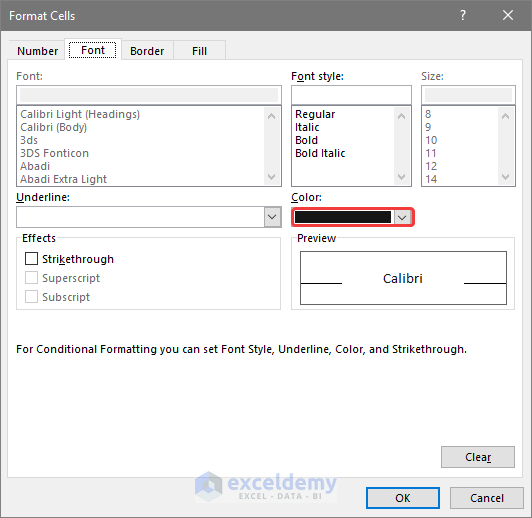
- In the Font tab, choose your desired color. We choose Black to blend the letter x with the black background.
- Click OK.
- Click OK in the Edit Formatting Rule window.
- Click Apply in the Conditional Formatting Rule Manager window.
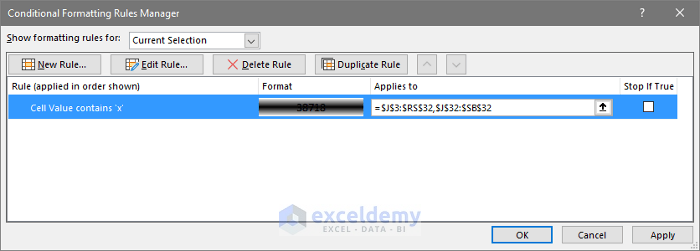
- The Gantt chart will be ready.
To add a scroll bar in the Gantt chart,
- Click on the Developer tab in the worksheet.
- Click on the Insert command, from the dropdown menu, and click on the Scroll bar (From Control).
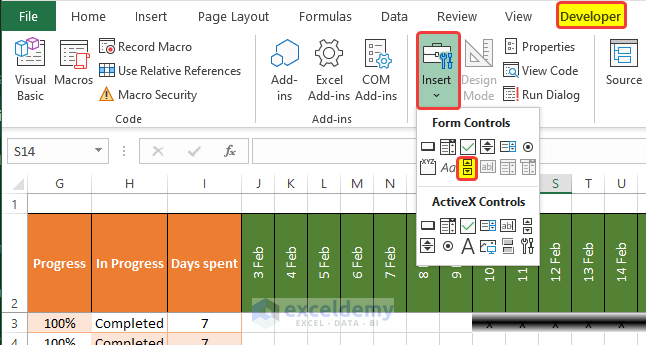
- A scroll button will appear on the worksheet.
- Resize the scroll button and right-click on it.
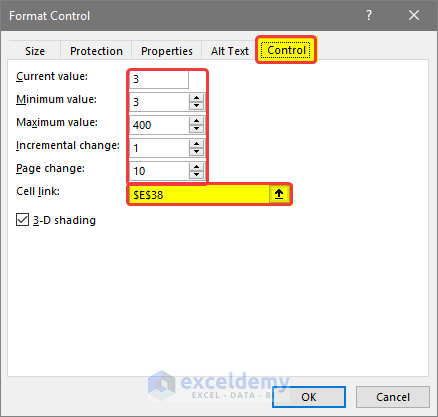
- Click on Format Control.
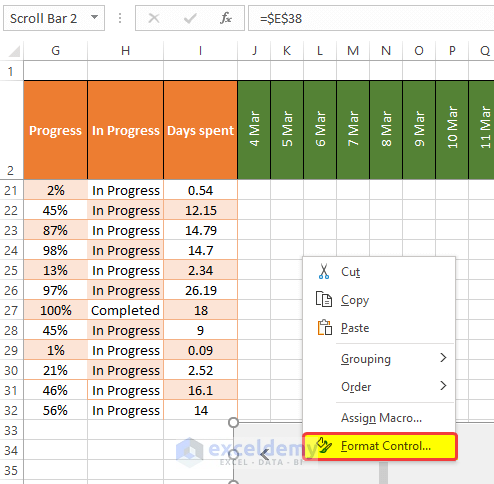
In the new Format Control window, in the Control tab, enter the location of the cell which you want to link., in this case, we choose $E$38.
- Choose the minimum value as required, we chose 3 here.
- Choose the maximum value. We chose 400 as we are dealing with over 365 days here.
- Choose incremental change as 1, as we proceed day by day.
- Click OK.
- Select cell J2 and enter the following formula to link cell $E$38 to this date.
=DATE(2020,2,E38)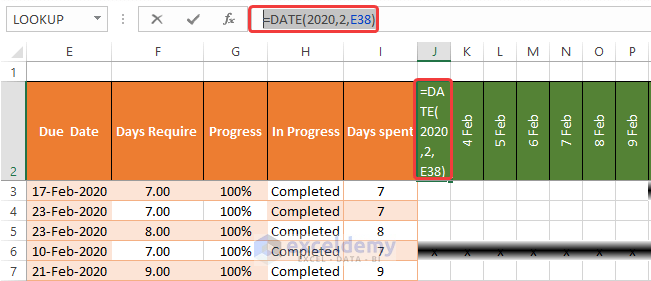
- After entering the formula, the date remains the same but it is now connected to cell $E$38. As we scroll the scroll bar, the value of cell $E$38 will increase and the date will also increase in the subsequent cells.
- Our Gantt chart is now complete.
Step 3 – Creating Performance Matrix Charts
The next step is to create performance matrix charts on the basis of the multiple project dynamic tracking. Those charts will give us an overview that is dynamic and helps us to manage different projects in one template.
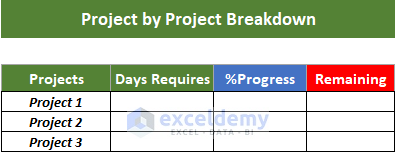
- Open a new worksheet named Project Performance.
- Create a table like the image below.
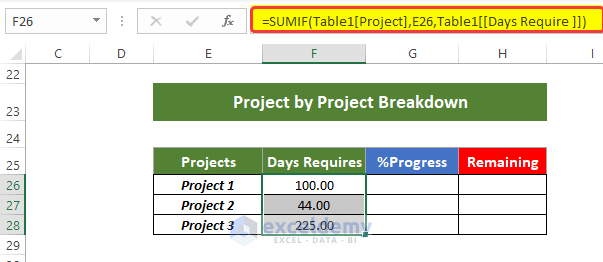
- Enter the formula in cell F26:
=SUMIF(Table1[Project],E26,Table1[[Days Require ]])Drag the Fill Handle to cell F28.
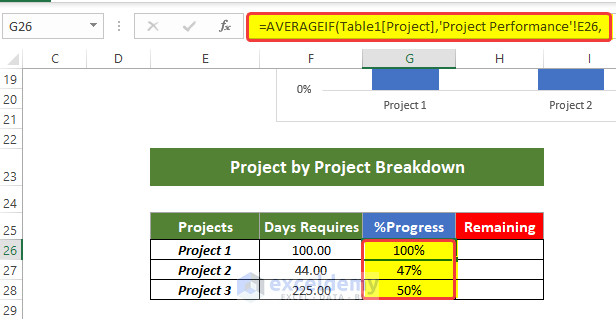
- Enter the formula in cell G26:
=AVERAGEIF(Table1[Project],'Project Performance'!E26,Table1[Progress])Drag the Fill Handle to cell G28.
- Enter the formula in cell H26:
=1-G26Drag the Fill Handle to cell G28.
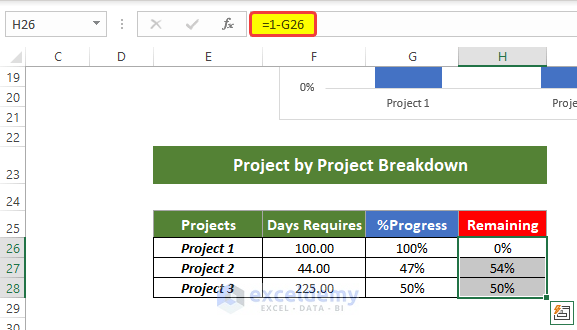
The table will look like this.
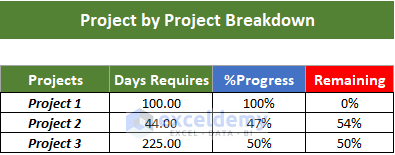
- We compared how many days each project would need to finish, and tracked how much progress they actually made. We also calculated how much project work is still remaining.
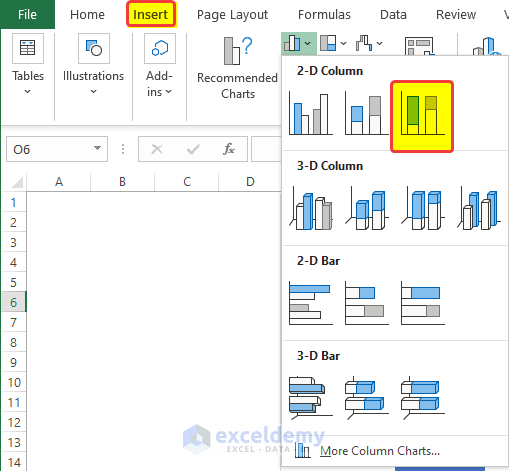
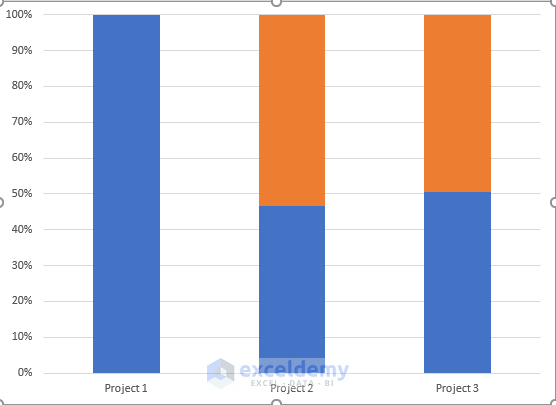
- We will create a bar chart showing the multiple projects’ progress comparisons.
- To do this, go to the insert tab and click on the 100% Stacked Column.
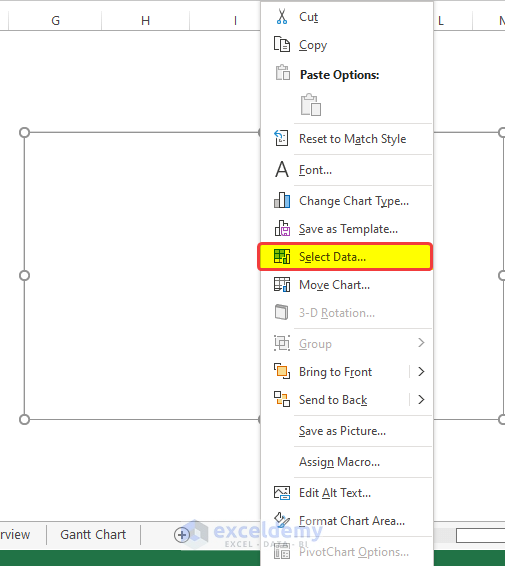
- When the chart appears, click on the chart area and right-click on the mouse.
- From the context menu, click on Select Data.
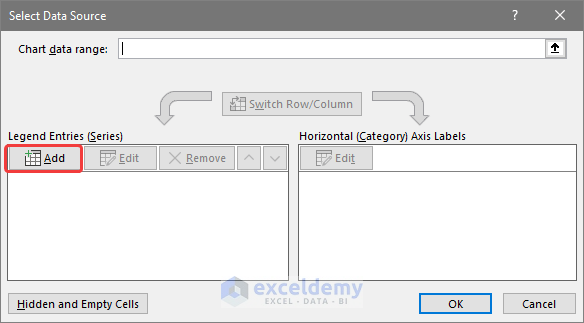
- In the Select Data Sources window, click on Add.
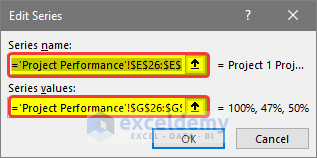
- In the new window, select the range of cells $E$26:$E$28 in the series name.
- And as series value select the range of cells $G$26:$G$28.
- Click OK.
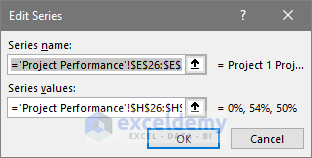
- Click on the Add button again and select the following range of cells $E$26:$E$28.
- Select the range of cells $H$26:$H$28 in the Series values.
- Click OK.
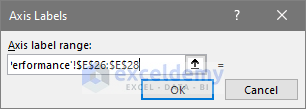
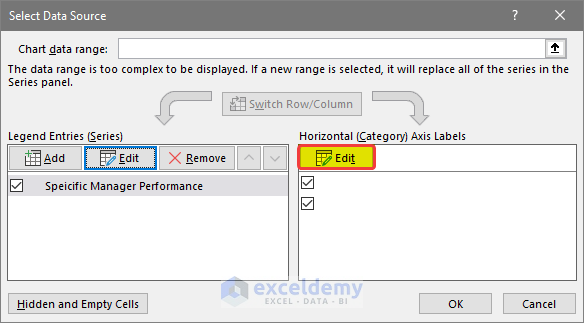
- Click on the Edit button to add the axis name on the chart.
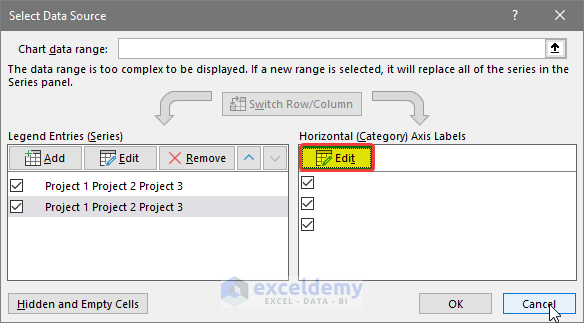
- Select the range of cells E$26:$E$28 in the box.
- You will see the project names are now presented on the right side of the Select Data Source. It will also be visible in the chart.
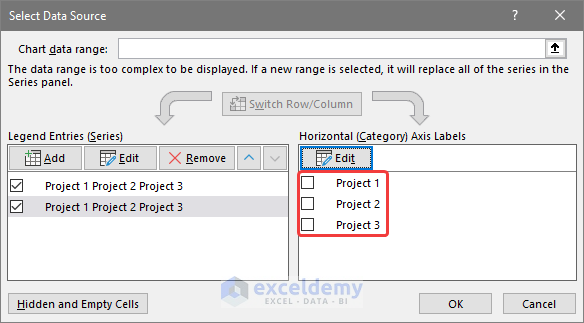
- Click OK.
Now you will see the chart in full.
Step 4 – Generating Dashboard to Track Multiple Projects
- In the new worksheet, we will add a new table as below.
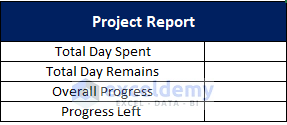
- We’ll link the value of how many days we spent, how many days are remaining in the total project, etc. on the range of cells H13 to H16.
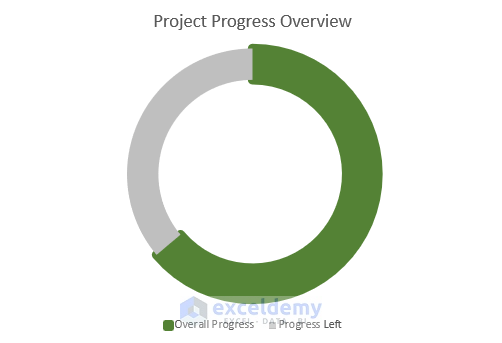
- Insert a normal doughnut chart from the Insert tab, the chart will show default settings and pick some random value.
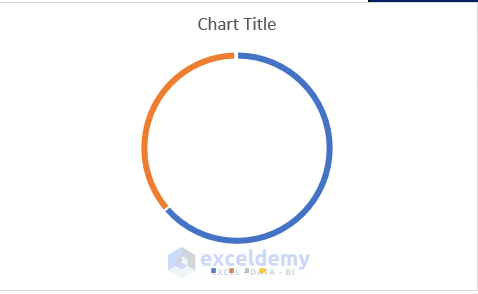
- Pick the data range for the doughnut chart.
- To do this, right-click and click on Select Data.
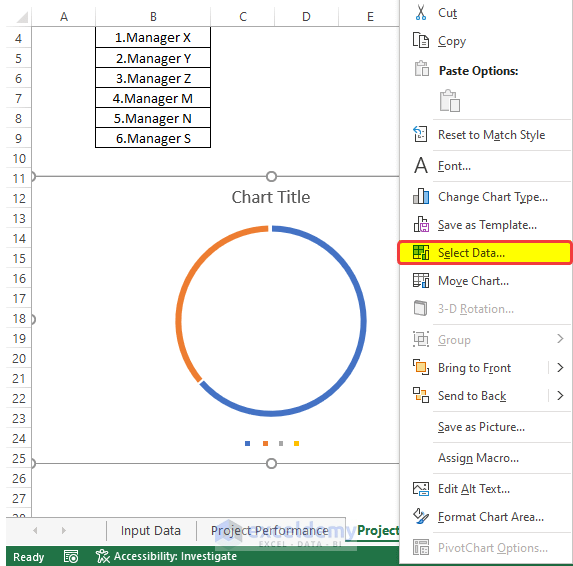
- In the new window, click on Add.
- Form the selection window, select the range of cells $F$7:$F$8.
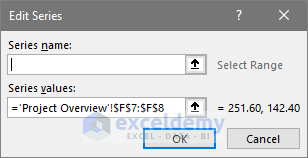
- Click OK. The doughnut chart will show the data.
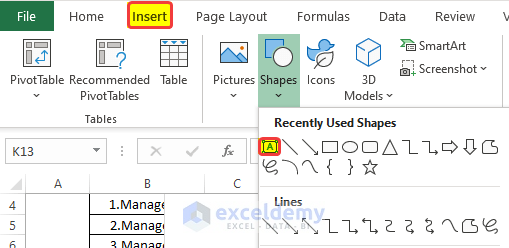
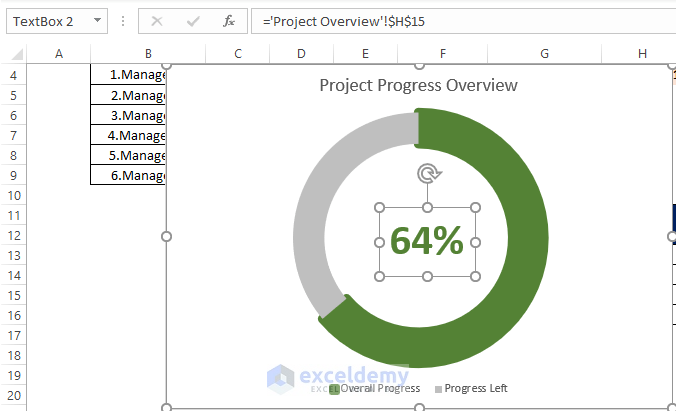
- Add a rectangular Text Box shape from the Insert tab.
- Place the box in the center of the doughnut and link the box to the cell $H$15, we know that cell $H$15 shows the percentage of work completed on the project.
- If for any reason our data changes, the work completion percentage will also change in both the doughnut chart and the text box.
- Add the project managers’ names and their performance matrix to the dashboard.
- For doing this, add a drop-down for evaluating each manager’s performance in the Gantt chart.
- After adding a drop-down menu from the Developer tab, add the manager’s name in the dropdown menu.
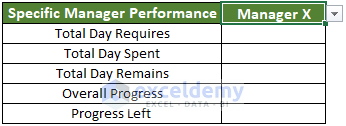
- After adding the names, enter the formula in cell D15:
=SUMIF('Gantt Chart'!C3:C32,D14,'Gantt Chart'!F3:F32)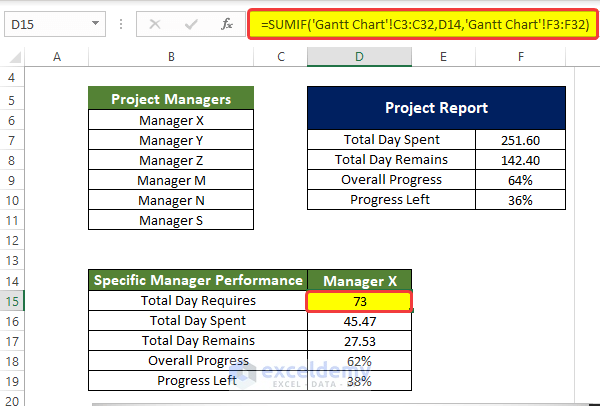
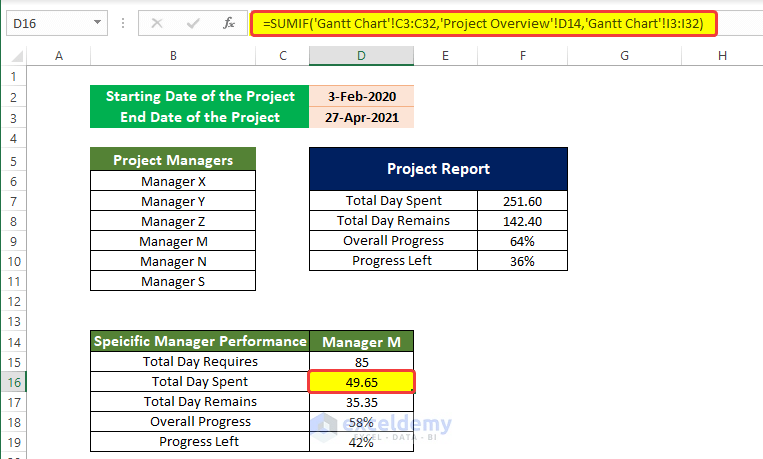
- Enter the following formula in cell D16:
=SUMIF('Gantt Chart'!C3:C32,'Project Overview'!D14,'Gantt Chart'!I3:I32)
- Enter the following formula in cell D17:
=D15-D16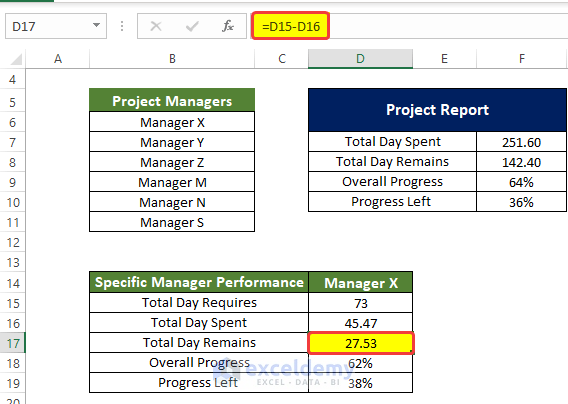
- Enter the following formula in cell D18:
=D16/D15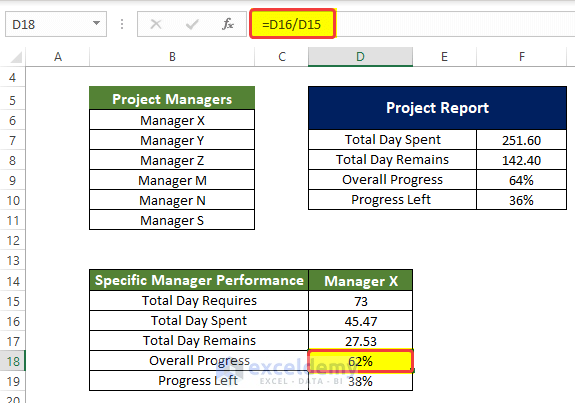
- Enter the following formula in cell D19:
=1-D18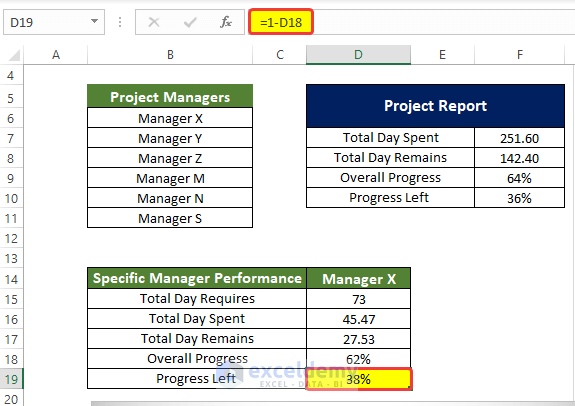
- You can switch between managers in the drop-down menu and see their performance of them change dynamically in the table.
- Add another doughnut chart in the worksheet, through the insert tab.
- Link the values with the chart, by right-clicking the mouse and clicking on Select Data.
- Click on Add.
- Enter the range of the cells $D$16:$D$17 in the Series values.
- Click OK.
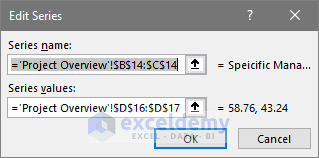
- Click on the Edit icon on the right side of the window.
- Enter the range of cells $B$16:$C$17 to specify the range names.
- When we change the manager’s name, the doughnut chart will also change accordingly.

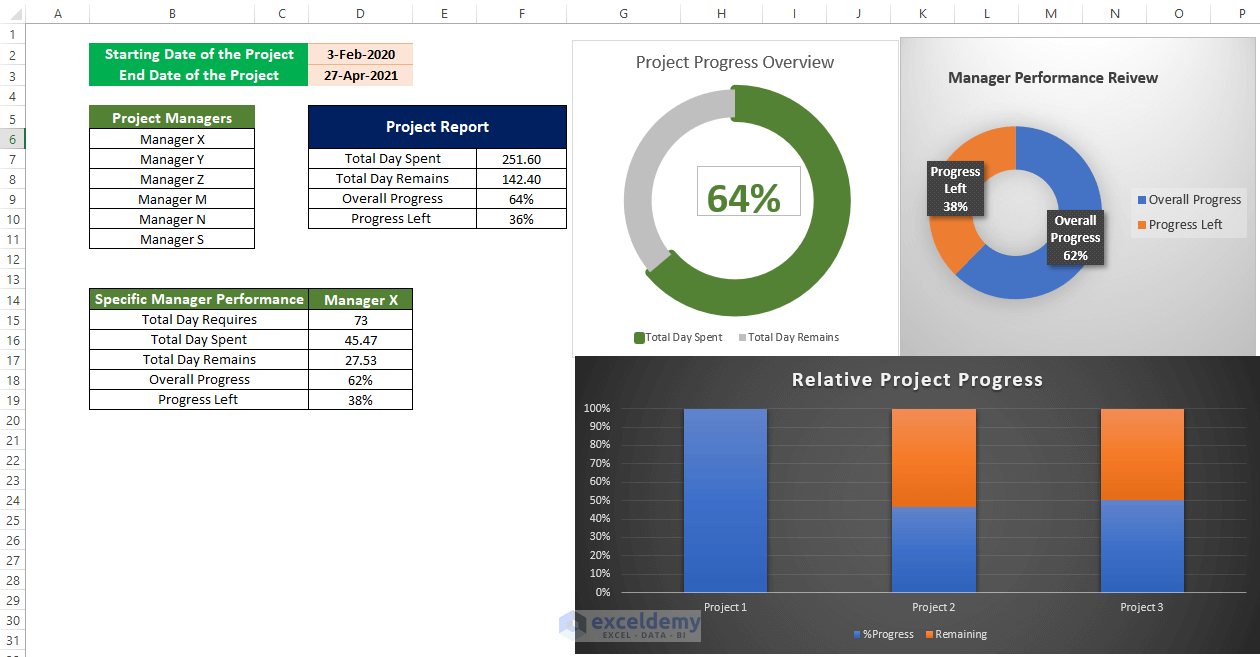
- Our dashboard is ready to track multiple projects in Excel in one place.
Read More: How to Track Project Progress in Excel
Download Template

