Method 1 – Creating Project Pipeline Manually in Excel
Step 1: Create Table for Project Pipeline
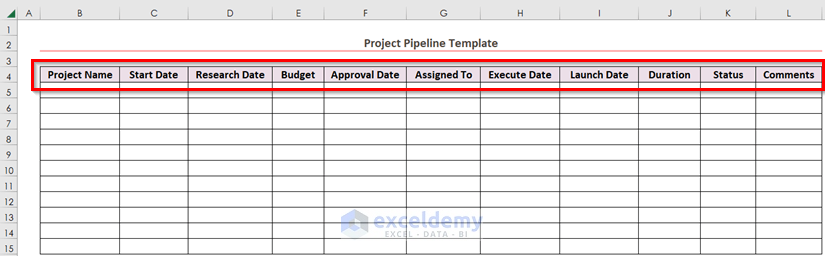
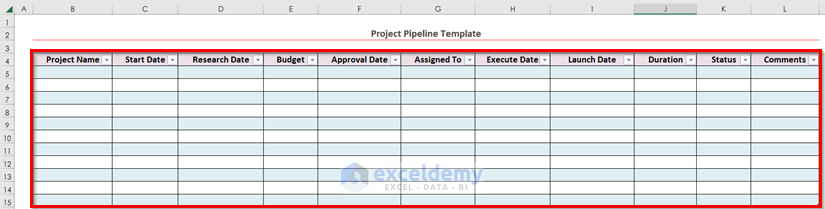
- Write all required terms that are important to track any of your projects in Excel. We wrote them in B4:L4 cells.
- Make them Bold, increase the Font Size, and change the Font Color.
We attached the sample image.
- Select the data along with some blank rows.
- From the Insert tab >> choose Table.
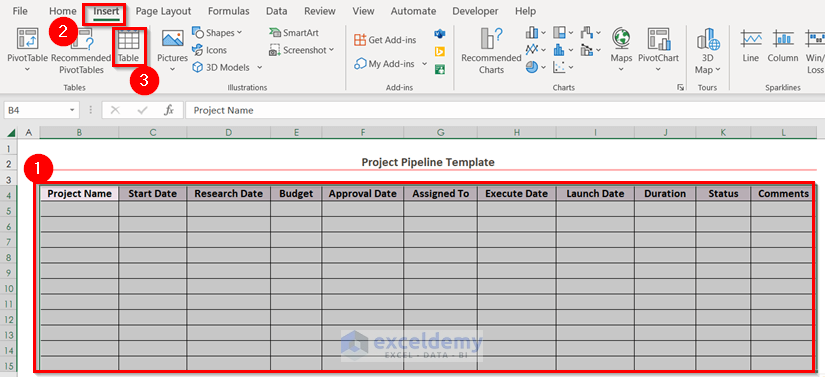
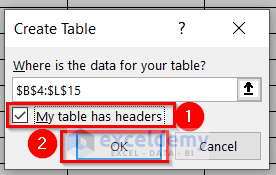
A dialog box of Create Table will appear.
- Select the data for your table. We selected the range B4:L15.
- Make sure that “My table has headers” is marked.
- Press OK.
You will see the following table, with one design contextual tab named Table Design appearing within the top ribbon.
- From this Table Design tab >> go to the Table Styles menu and select your preferred color for your table.
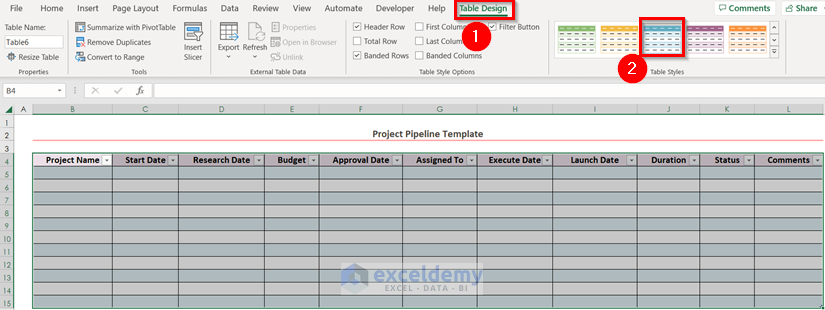
Get your table.
Step 2: Format Cells of Some Columns
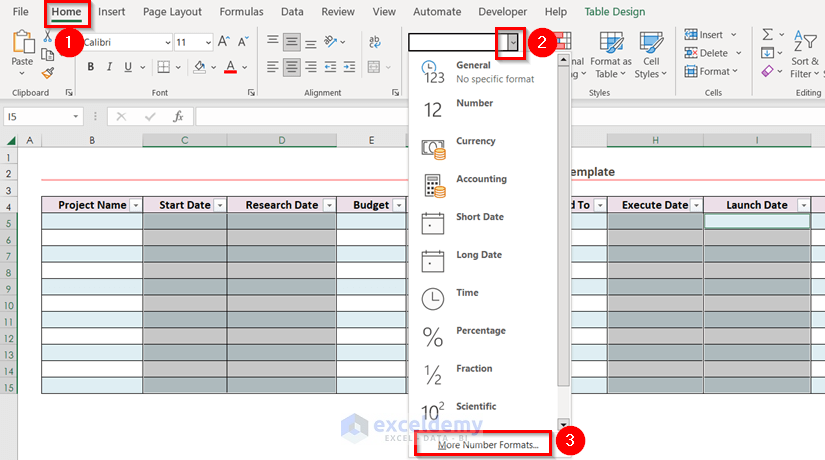
- Select these cells by pressing CTRL+C, where you have to use dates as cell values.
- From the Home tab >> go to the Number group >> from the Drop-Down Arrow >> choose More Number Formats.
Use the Context Menu bar or the Keyboard Shortcuts to open the Format Cells dialog box. When using the Context Menu Bar, select the data range >> Right-Click on the data >> choose the Format Cells option.
While using Keyboard Shortcuts, select the data range >> you need to press the CTRL+1 keys to open the Format Cells dialog box directly.
A dialog box named Format Cells will appear.
- From that dialog box, you have to make sure that you are on the Number command.
- Go to the Date option >> in the Type box >> choose your preferred format.
- Press OK to get the changes.
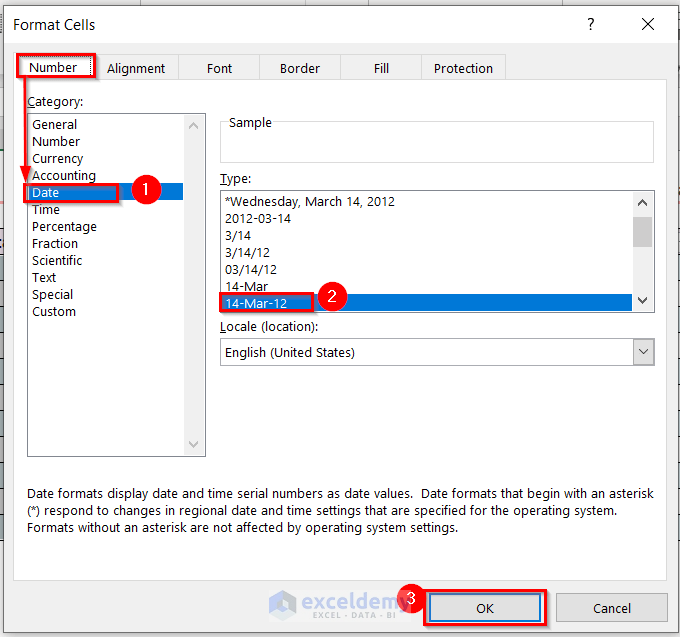
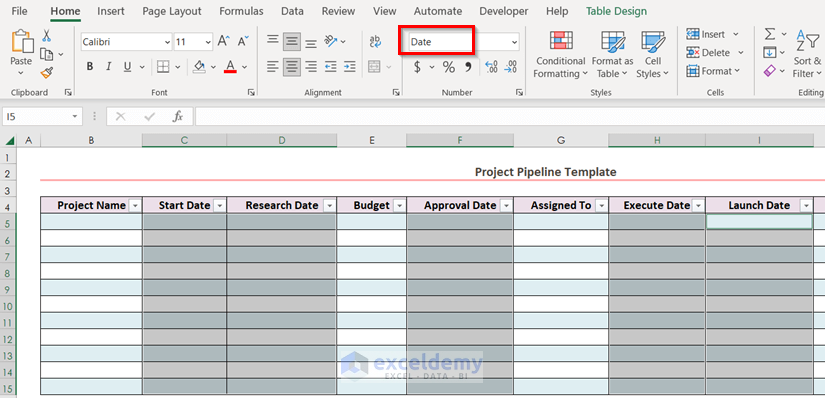
You created Date as the format for these particular cells.
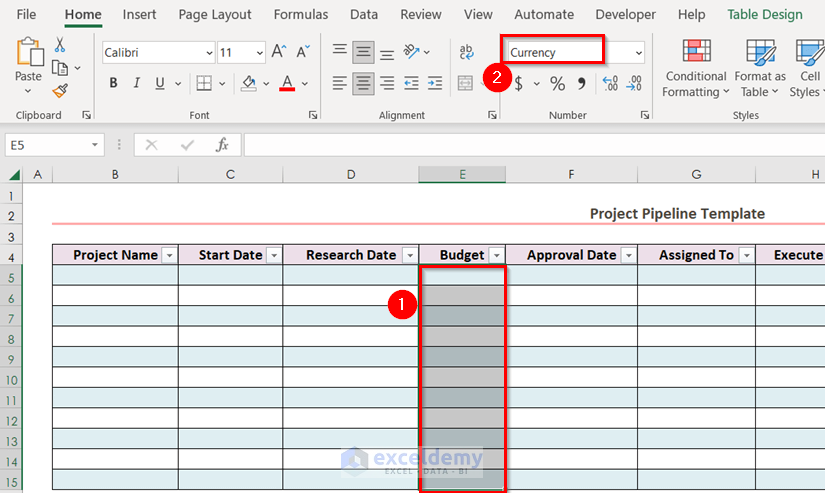
- Format the cells for budget as Currency.
Step 3: Use of Data Validation Tool
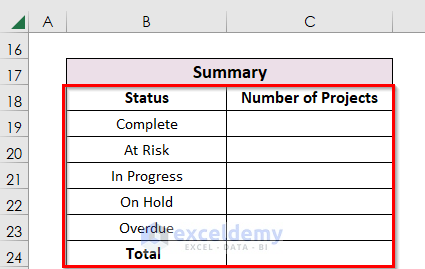
- Create the following Summary table. Where you have to input all types of statuses that you need to express the situation of projects.
Use the Data Validation tool.
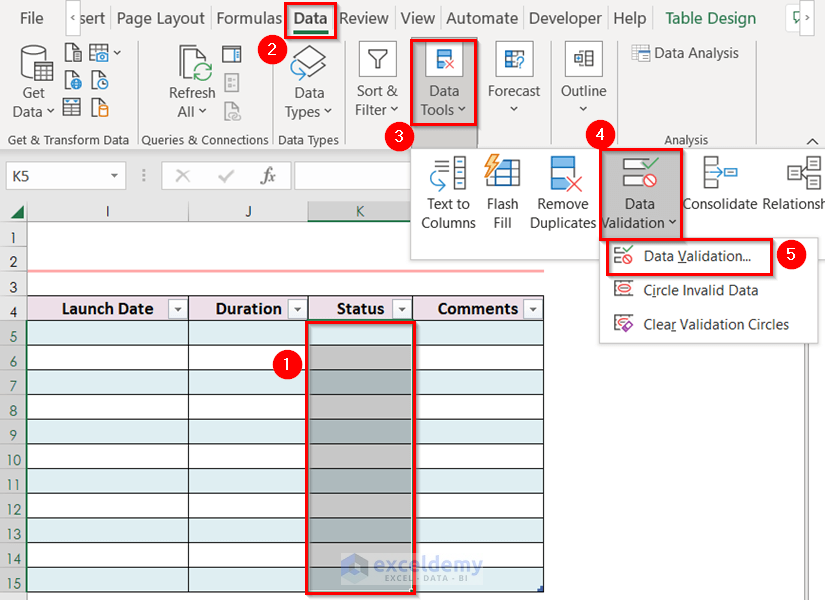
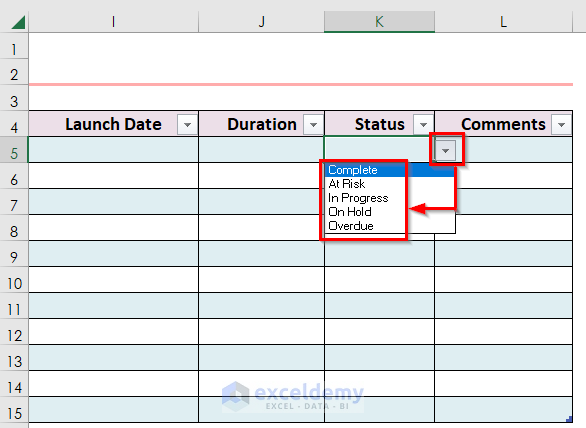
- Select cells of the Status column where you want to insert only certain kinds of cell values.
- From the Data tab >> go to the Data Tools option.
- From the Data Validation feature >> choose Data Validation.
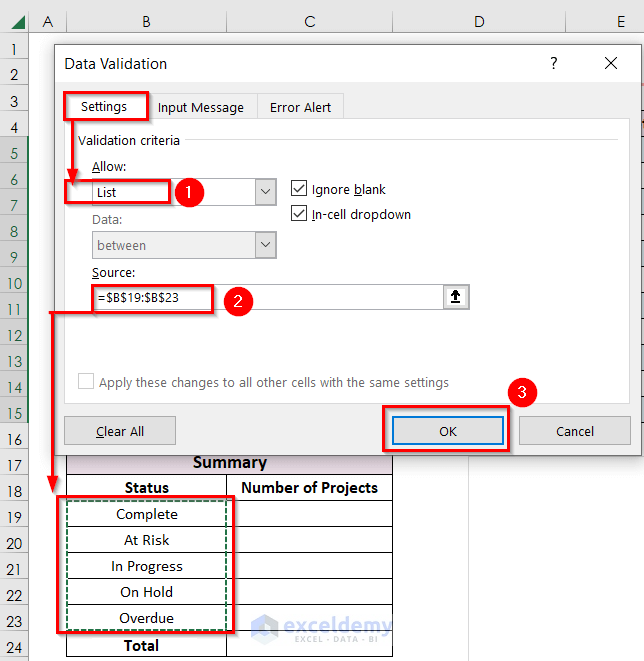
A dialog box named Data Validation will appear.
- From the Settings menu >> choose List in the Allow: box.
- Select references in the Source: box. You must freeze your source using the Dollar sign ($) to copy Data validation. In every cell, the source may change to the next cell of that.
- Press OK to make the changes.
You will see the drop-down arrow beside cell K5. Select any of the values.
Step 4: Calculation of Number of Projects and Their Duration
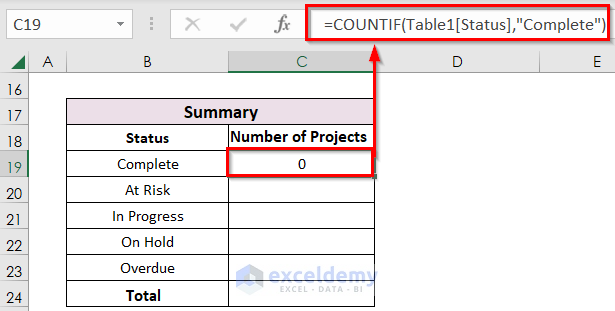
- Write down the following formula in the C19 cell.
=COUNTIF(Table1[Status],"Complete")
We used the COUNTIF function to count the cells with cell value as Complete.
- Press ENTER to get the result.
As there is no value in the Status column of Table1 so it shows 0 as output.
- The following formula is in the C20 cell.
=COUNTIF(Table1[Status],"At Risk")
- Press ENTER.
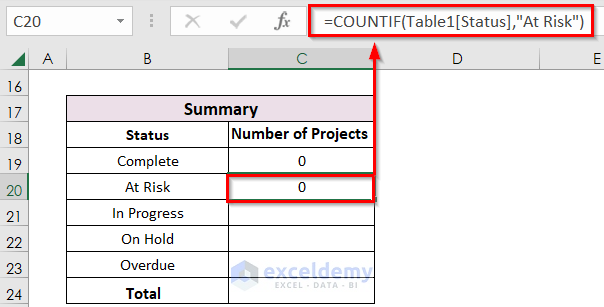
- Write the same formula for the other statuses.
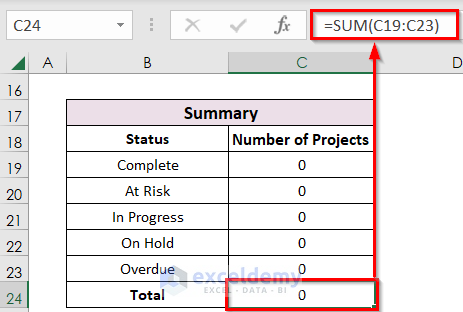
- In the C24 cell use the following formula.
=SUM(C19:C23)
We used the SUM function to count the total project number.
- Press ENTER.
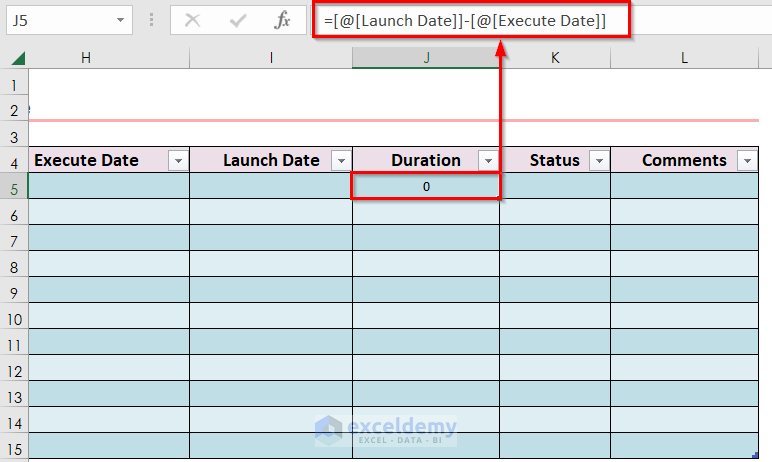
- Write the formula in cell J5 to get the duration for starting the project.
=[@[Launch Date]]-[@[Execute Date]]
- Press ENTER.
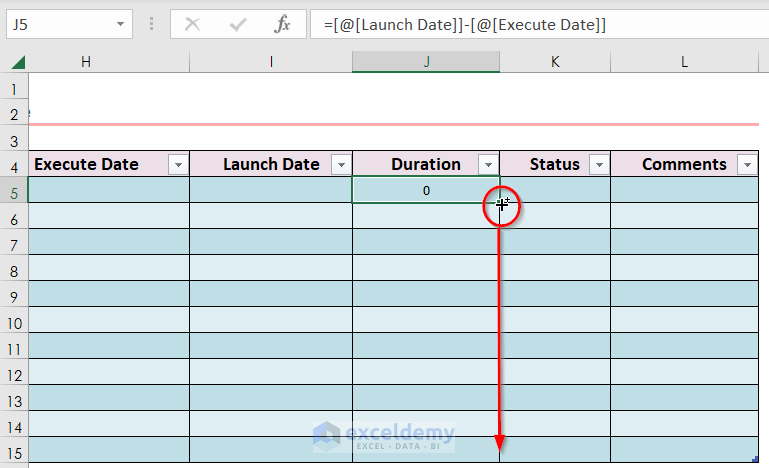
- Copy the same formula using relative cell references. Select cell J5. A square box will be shown in the bottom-right corner of cell J5, it is called the Fill Handle icon. Click the Fill Handle icon, hold it, and drag until you reach cell J15.
- Release the Mouse button.
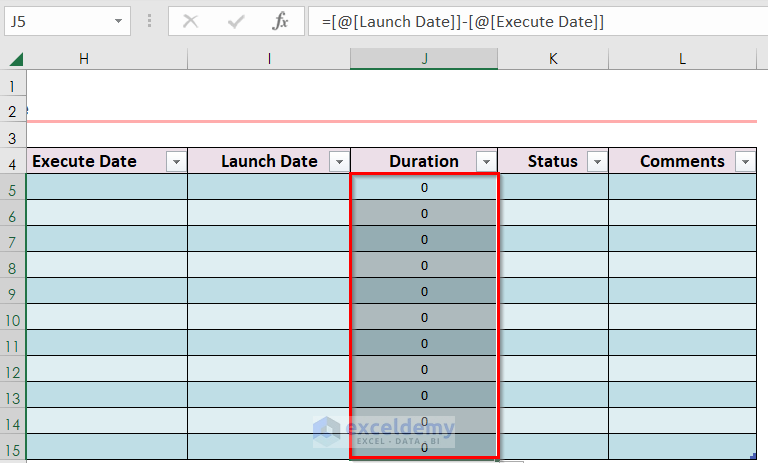
See all the copied formulas.
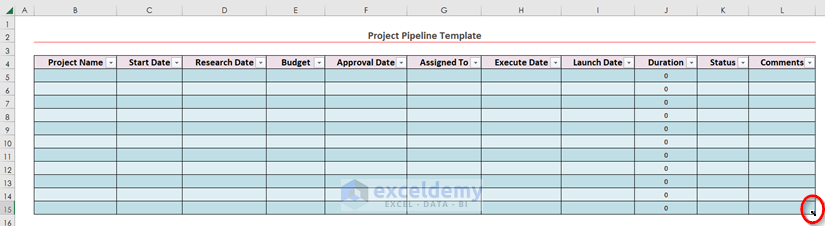
Increase or decrease the table size by dragging the Arrow situated at the bottom-right-most corner of the table according to your necessity.
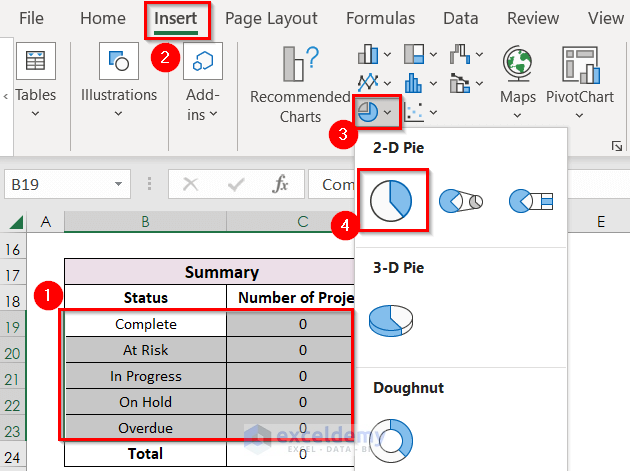
Step 5: Insert Pie Chart for Project Pipeline
- Select the cell values of the summary table. We selected the range B19:C23.
- From the Insert tab >>, you need to select Insert Pie or Doughnut Chart.
- From 2-D Pie >> you must choose Pie.
See the following chart. As there have all 0 values so the chart is a blank one. You may change the chart title.
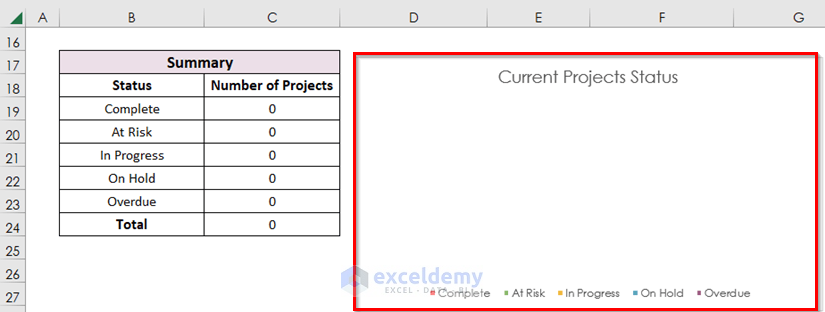
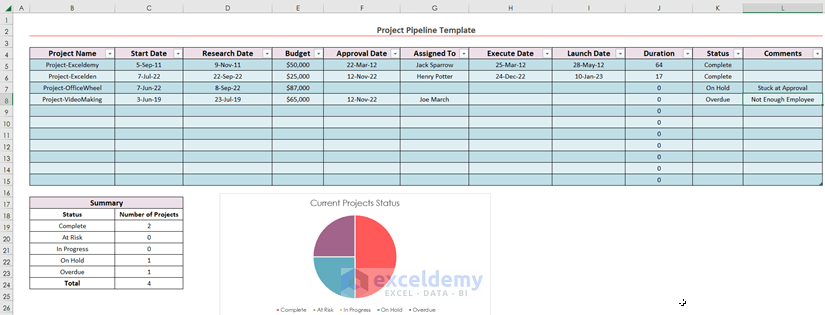
Illustration of Using Project Pipeline in Excel
We inserted the values according to the column title, and the summary table and chart are auto-generated.
Method 2 – Use of Excel Template for Project Pipeline
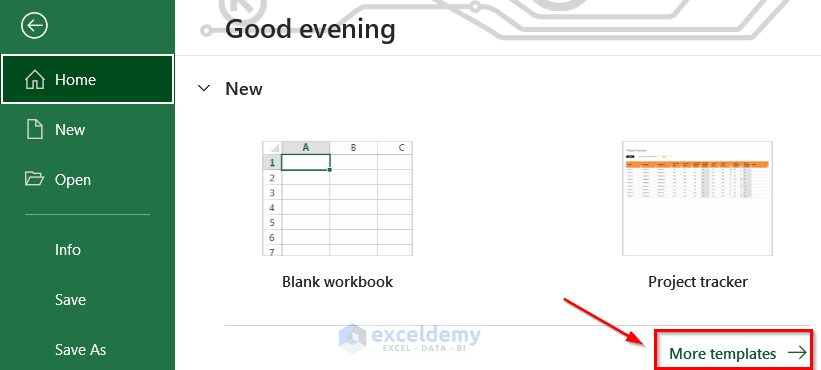
- Open an Excel workbook.
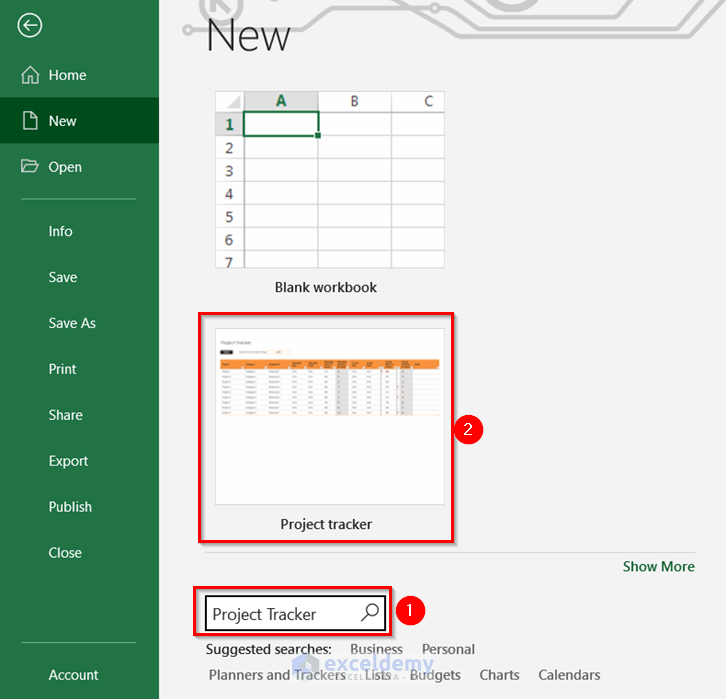
- Go to the File tab from the top ribbon.
- From the New menu >> choose More templates.
- From the window named New >> write “Project tracker” in the Search box >> choose Project tracker.
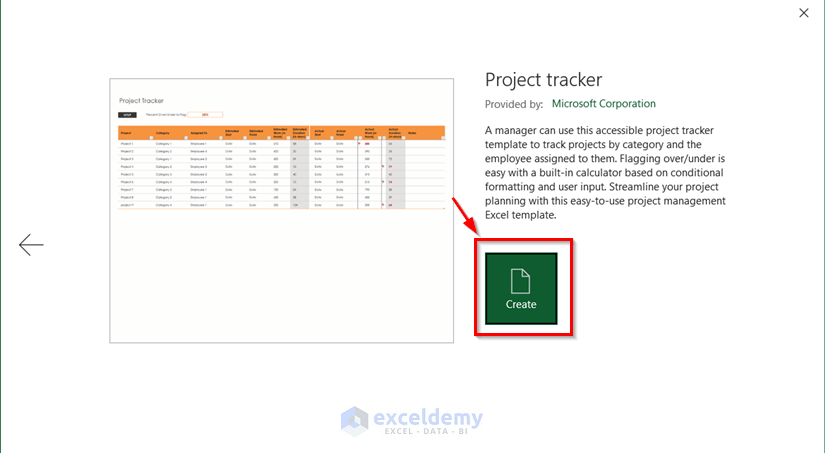
A new window named Project tracker appears.
- Click on the Create button.
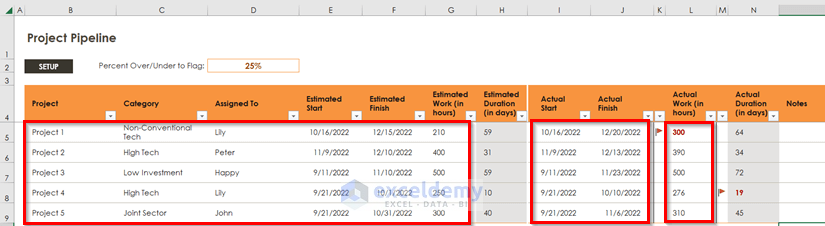
You will get the following workbook which has two worksheets named Project Tracker and Setup.
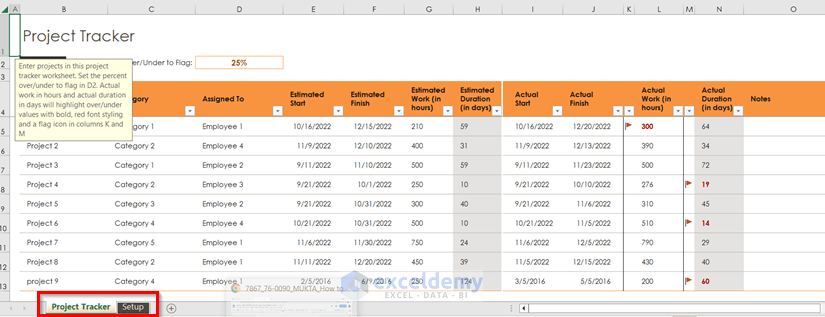
- Go to the Setup worksheet.
- Write your preferred Category name for projects and the Employee name of your company.
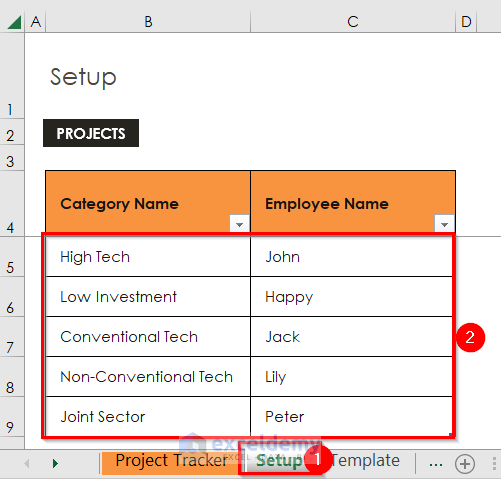
- Select your project category and employee. Insert your required values according to the column title. Modify this as you wish. Every term of this template is editable.
Download Practice Workbook
You can download the practice workbook from here:
Related Articles
- How to Track Project Progress in Excel
- How to Track Multiple Projects in Excel
- How to Track Time Spent on Projects in Excel

