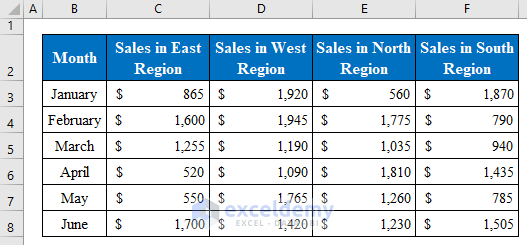
This sample dataset showcases the Monthly Sales of a company in Different Regions.
Method 1 – Using the Select Data Source Feature to Select Data for a Chart in Excel
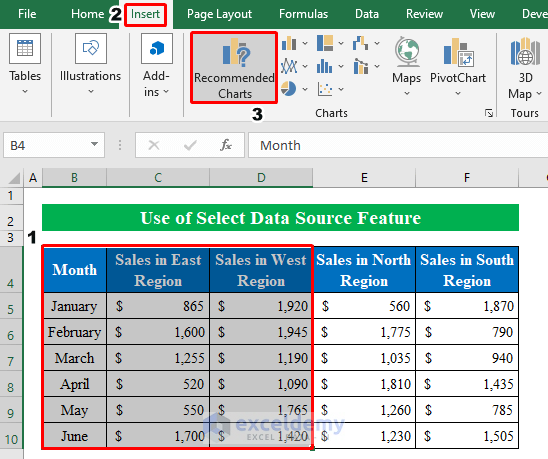
Step 1:
- Create a chart by selecting cells from the table. Here, B4:D10.
- In Insert, click Recommended Charts.
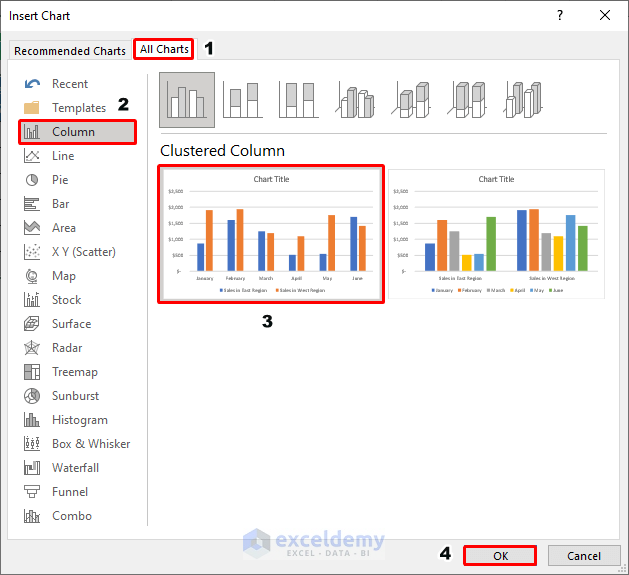
- In the Insert Chart window, go to All Charts > Column > Clustered Column.
- Click OK.
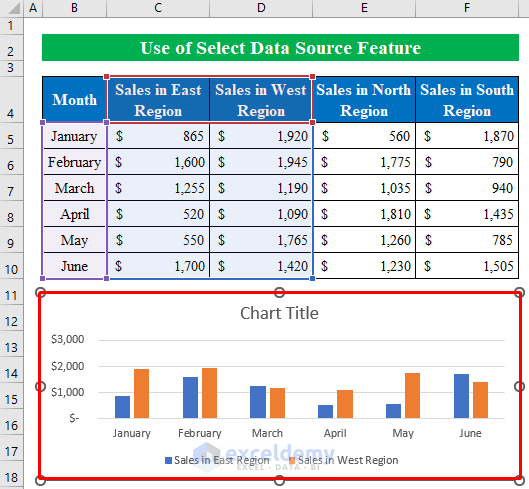
- The chart displays the selected values.
Step 2:
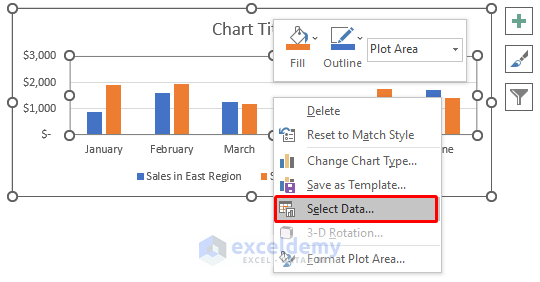
- To add data to the chart, select the chart and right-click.
- Choose Select Data.
- In the Select Data Source window, choose Add.
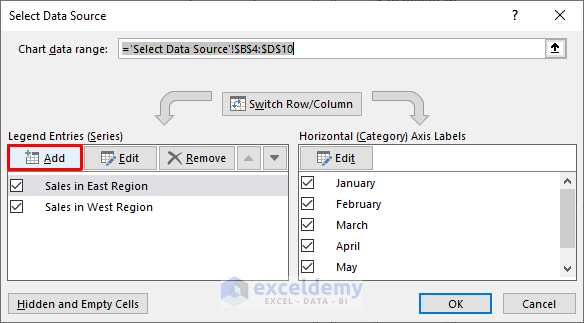
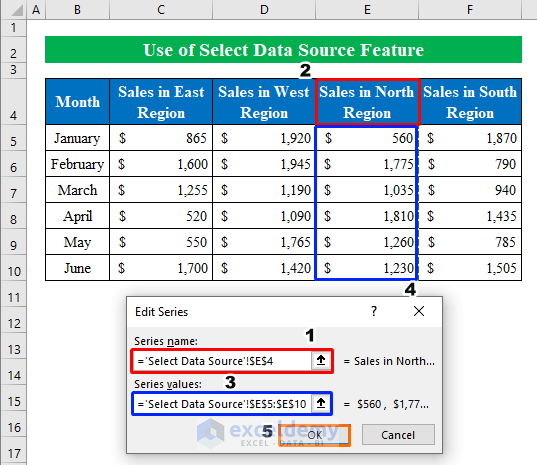
- Place the cursor over Series name and click E4 (Sales in North Region).
- In Series values select sales data from the worksheet.
- Click OK.
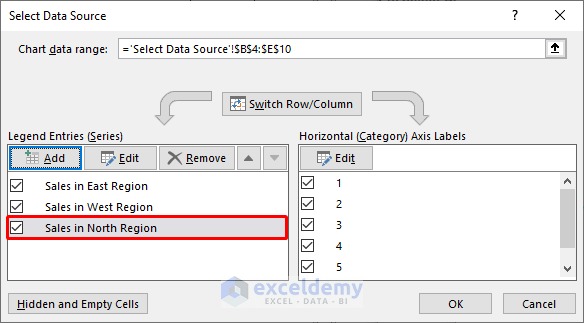
- Sales in North Region will be added to the chart.
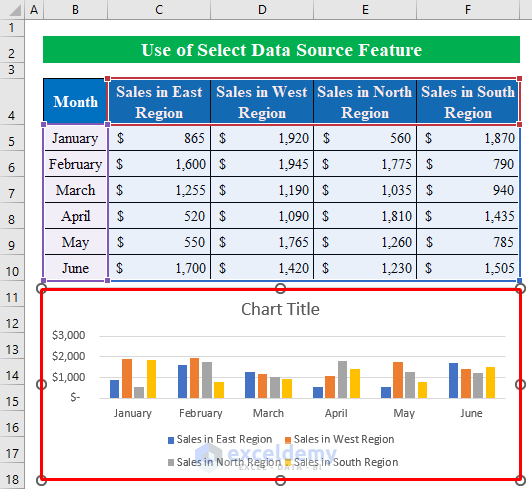
- Follow the same steps to add sales value for Sales in South Region.
- Click OK.
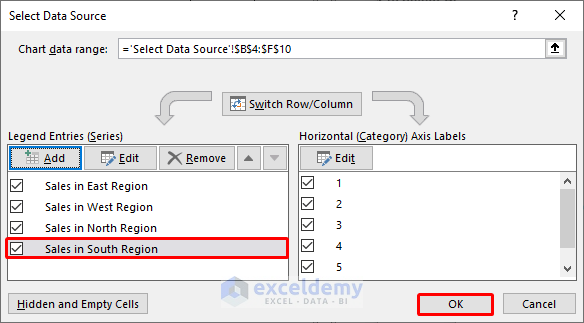
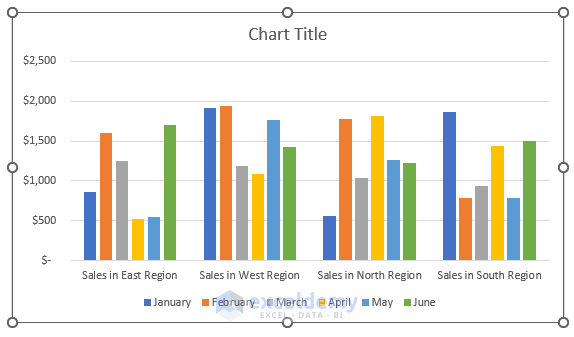
- This is the output.
Step 3:
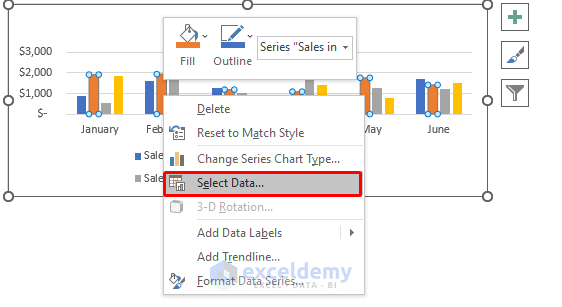
To change the chart style by switching data to a different position:
- Select the chart and right-click.
- Choose Select Data.
- In Select Data Source, click Switch Row/Column.
- Click OK.
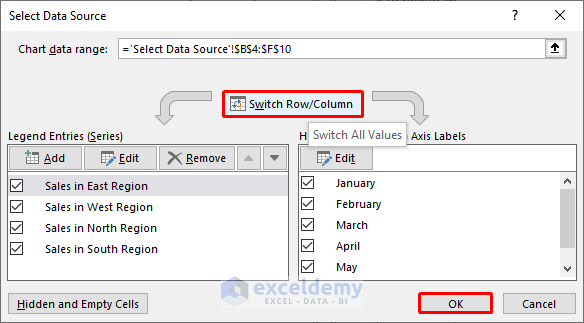
- This is the output.
Read More: How to Expand Chart Data Range in Excel
Method 2 – Drag the Fill Handle to Select Data for a Chart
2.1. Adjacent Data
Create a chart by selecting data from the table.
Steps:
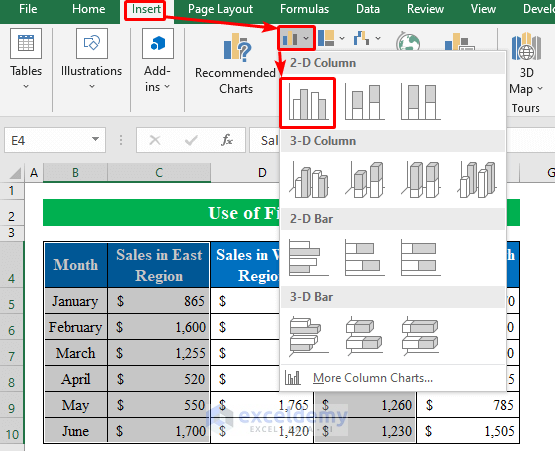
- Select B4:D10.
- In Insert, choose Chart.
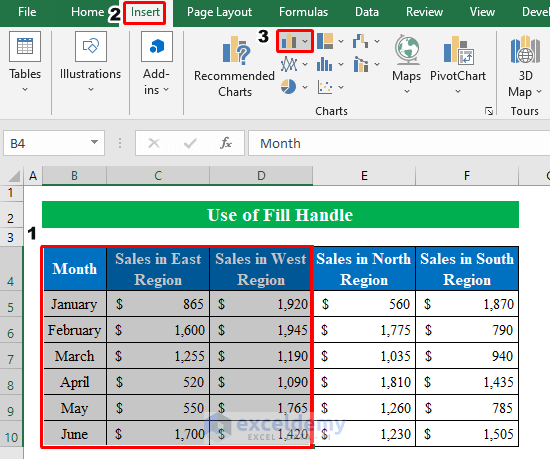
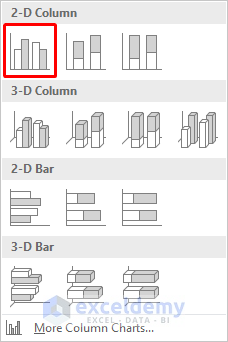
- Select a 2-D column from the drop-down menu.
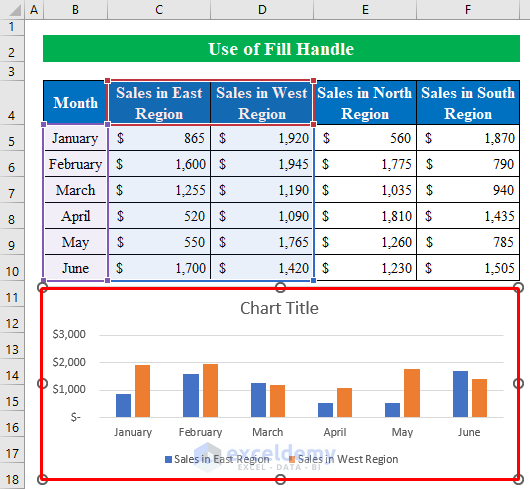
- The chart displays Sales in East Region and Sales in West Region.
Step 2:
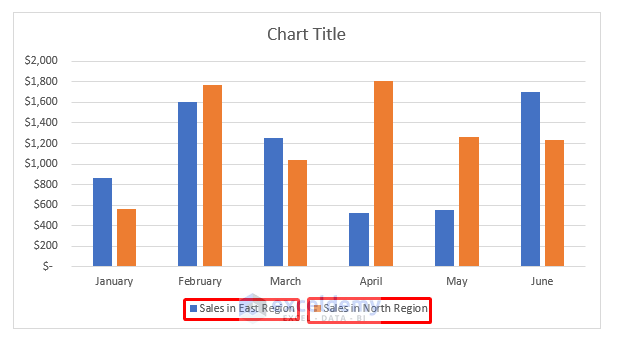
- To select additional data for the chart, drag the “fill handle” in the data table.
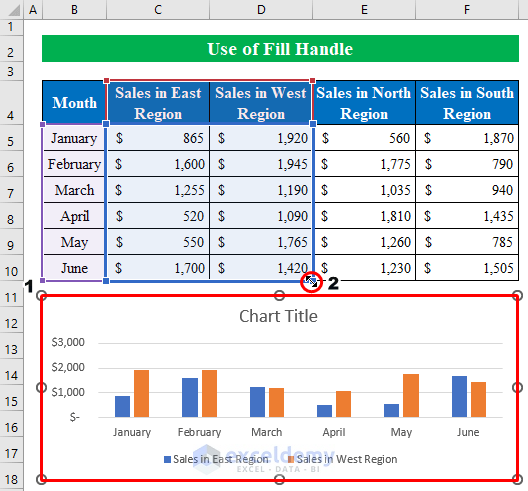
- All data will be selected from the dataset and displayed in the chart.
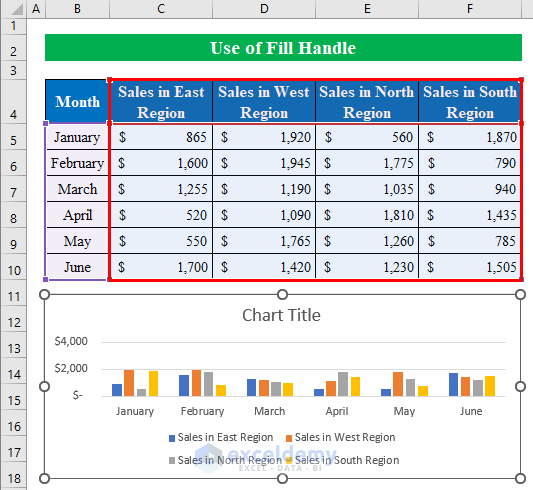
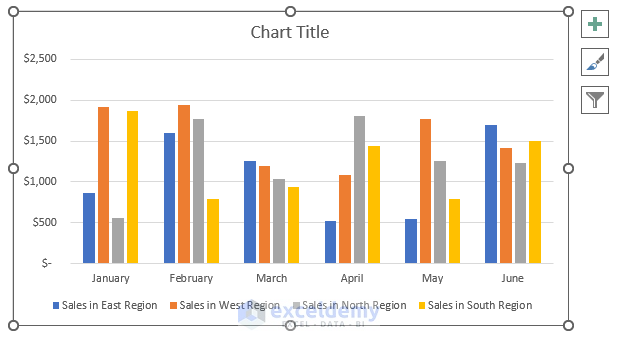
- This is the output (applicable to adjacent cells).
2.2 Non-Adjacent Data
Steps:
- Select B4:C10 from the table.
- Press and hold Ctrl to choose the data you want to include in the chart. Here, E4:E10.
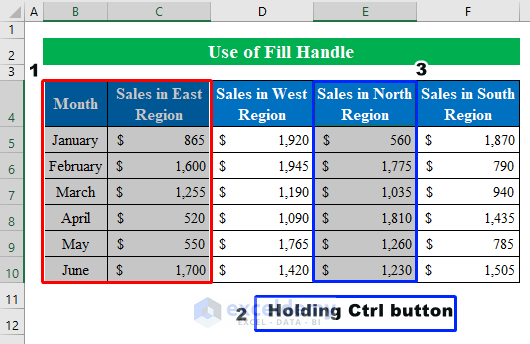
- In Insert, choose a 2-D column.
- The chart containing non-adjacent data from the table is displayed.
Read More: Selecting Data in Different Columns for an Excel Chart
Things to Remember
- Chart Design on the ribbon can also be used to format the chart.
Download Practice Workbook
Download this practice workbook to exercise.
Related Articles
<< Go Back to Data for Excel Charts | Excel Charts | Learn Excel
Get FREE Advanced Excel Exercises with Solutions!
