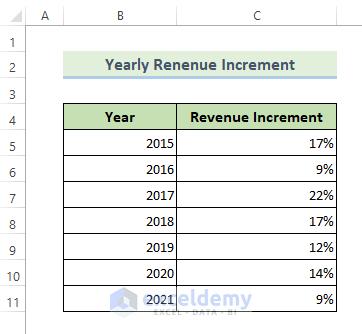
We have a data table of two columns called the Yearly Revenue Increment.
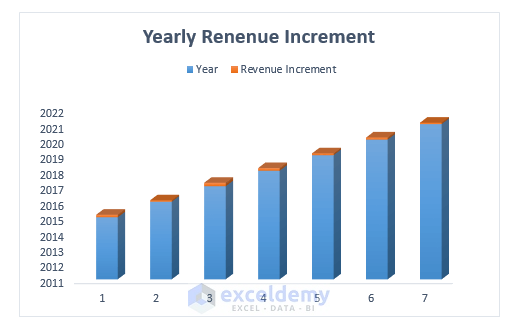
If we plot a stacked column chart of it, it looks like the following:
Method 1 – Applying the Print Command to Print a Graph in Excel
- Click on the chart/graph that you want to print. Clicking on a chart will select only the chart and exclude everything else.
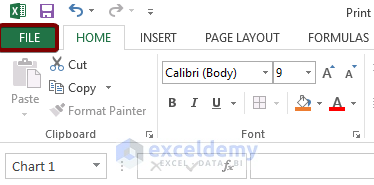
- Go to the File tab from the main ribbon.
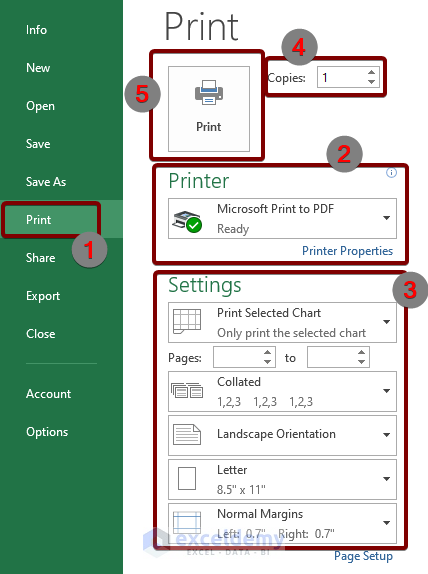
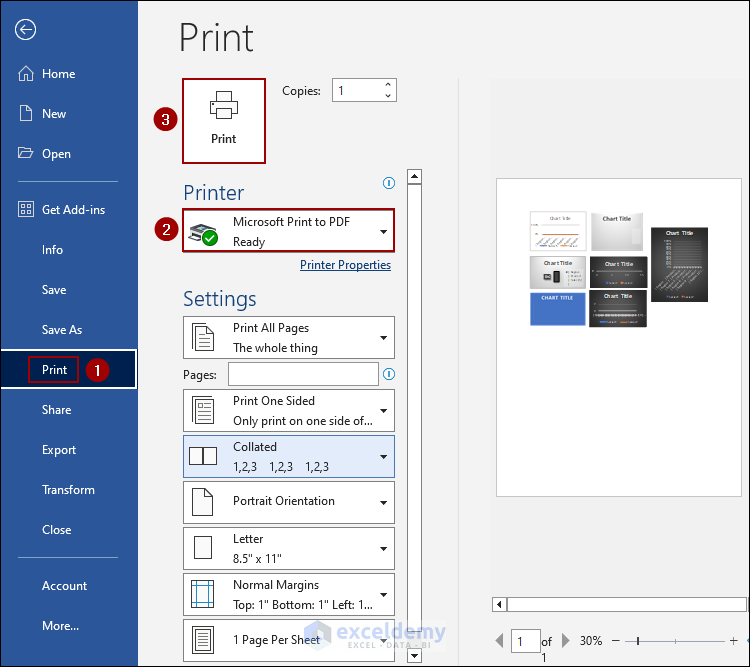
- Choose the Print command from the list of options.
You will see a Print Preview of the graph that you’ve selected to print.
- Select a printer. You will find the selection option under the Printer box. From the drop-down menu, you can easily find the printer that you are connected with.
- You can also tweak the printer settings from the Printer Properties option.
- Go to Settings. You can modify the print settings from here.
- If you want to change the page orientation, you can do it from the orientation drop-down. You can change between Portrait Orientation or Landscape Orientation.
- You can change the paper size of the print. Most Excel versions default to Letter size.
- Select the number of print copies of your graph from the Copies box.
- Hit the Print button to start printing the graph.
Read More: Print Worksheet with Comments in Excel
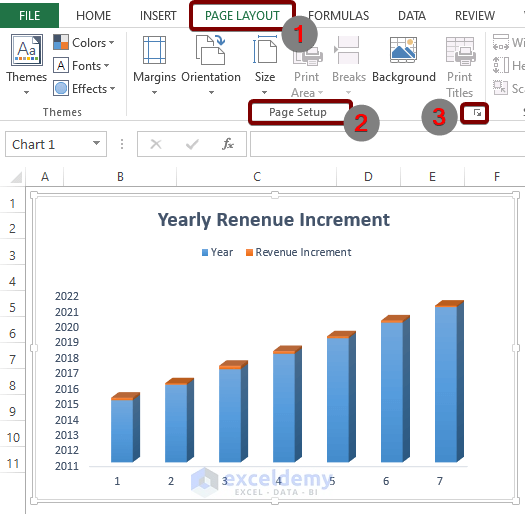
Method 2 – Using the Page Layout Tab to Print a Graph
- Click on the Excel graph to select the graph.
- Go to the Page Layout tab.
- Click on the Page Setup icon from the Page Setup group.
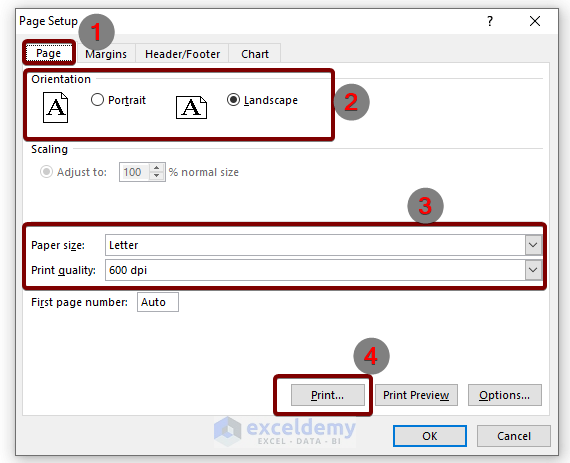
- Select the Page tab on the Page Setup dialog box.
- Choose the page orientation.
- Choose the Paper Size and Print Quality from the drop-down list.
- Hit the Print button to start printing the graph.
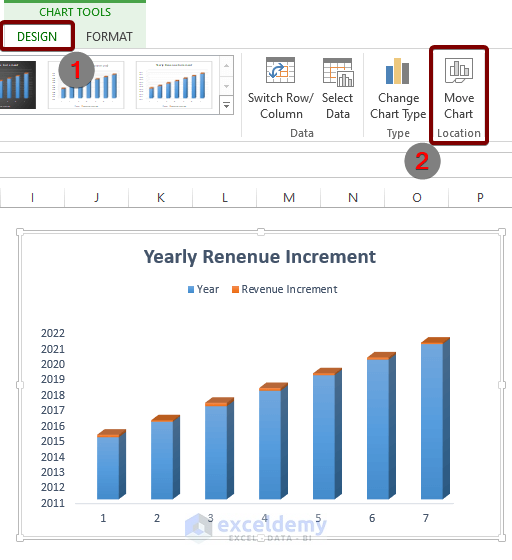
Method 3 – Using the Move Chart Command to Print the Graph on a Full Page
- Click on the graph to select it.
- Go to the Design tab from the main ribbon.
- From the Location group, hit the Move Chart command.
- Select New sheet from the Move Chart dialog box.
- Press OK.
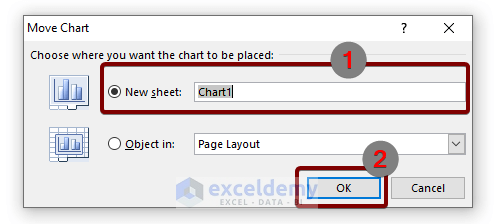
The chart will move to a new sheet.
- Go to the File tab.
- Go to Print from the list of other options.
- Tweak the settings and hit the Print command to start printing.
Read More: How to Not Print Empty Cells in Excel
Method 4 – Applying a Keyboard Shortcut to Print a Graph
- Click on the graph to select it.
- Press Ctrl + P.
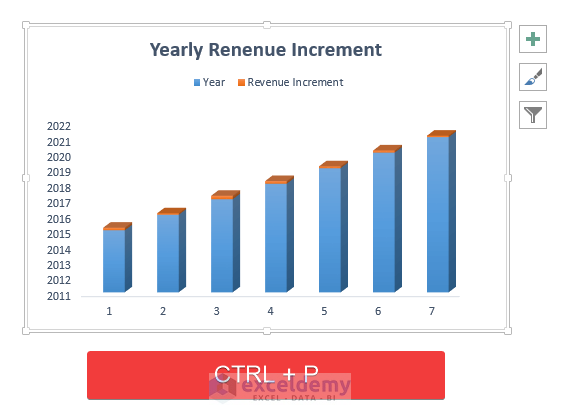
These shortcut keys will take you to the print preview window.
- Set up the Printer, tweak the Settings, and select the number of print copies.
- Hit the Print button to start printing.
Read More: How to Adjust Print Settings in Excel
Method 5 – Using Excel VBA Code to Print Multiple Graphs
The VBA code will print all the graphs embedded in a workbook. Each of the graphs will be printed out on a separate page.
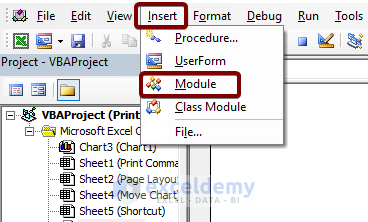
- Press Alt + F11 to open the VBA editor.
- Go to Insert and select Module to create a new module.
- Copy the following VBA code and paste it to the VBA editor.
Sub MultipleGraphsPrint()
For zxz = 1 To Application.ActiveSheet.ChartObjects.Count
    Application.ActiveSheet.ChartObjects(zxz).Select
    Application.ActiveSheet.ChartObjects(zxz).Activate
    Application.ActiveChart.PrintOut Copies:=1
Next
End Sub- Save the code by pressing Ctrl + S.
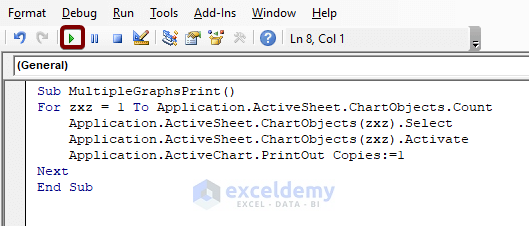
- Press the Run Sub button or hit the F5 key to run the code.
Read More: How to Print Excel Sheets with Table
Things to Remember
- Use Ctrl + P as a hotkey to print.
Download the Practice Workbook
<< Go Back to Print in Excel | Learn Excel
Get FREE Advanced Excel Exercises with Solutions!

Hi, and thank you for your excellent article, Mrinmoy!
One question: I have a graph composed of 7 others and I want top print it as a single image.
Any solution to this problem?
Thanks!
Dear CARLOS,
Thank you for sharing your problem with us. To print 7 graphs as a single image:
Following the steps, we will get an image like the picture below.
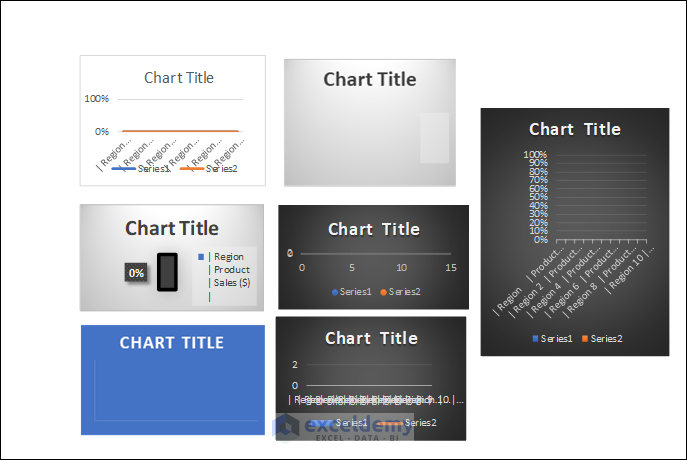
As a result, you will get all the graphs printed as a single image.
Regards
Wasim Akram
Team ExcelDemy