You can use the Shape feature to make the Fishbone diagram in Excel. You can do many things using this Shape feature in Excel. The Shape feature has different types of Shape.
Metod 1 – Inserting Fish Head
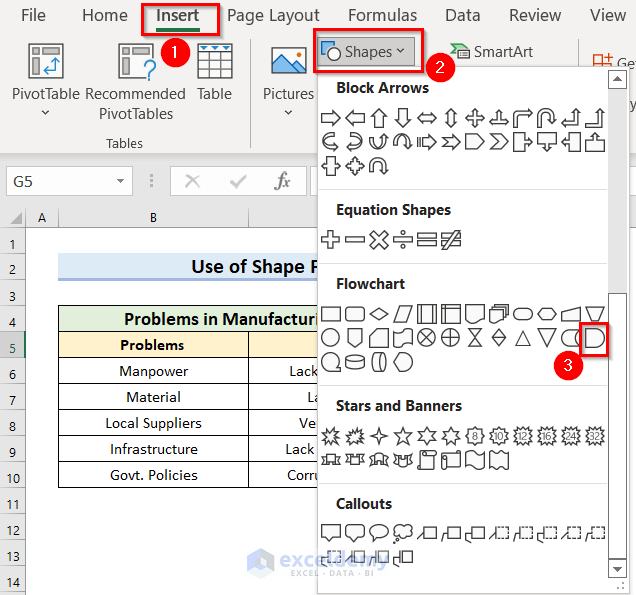
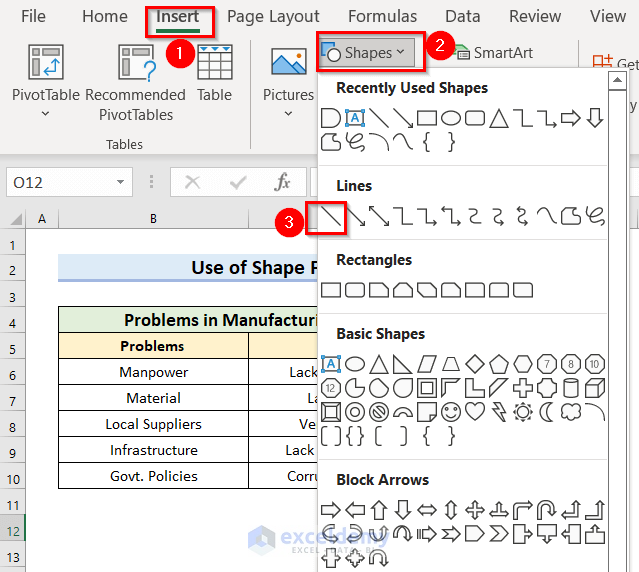
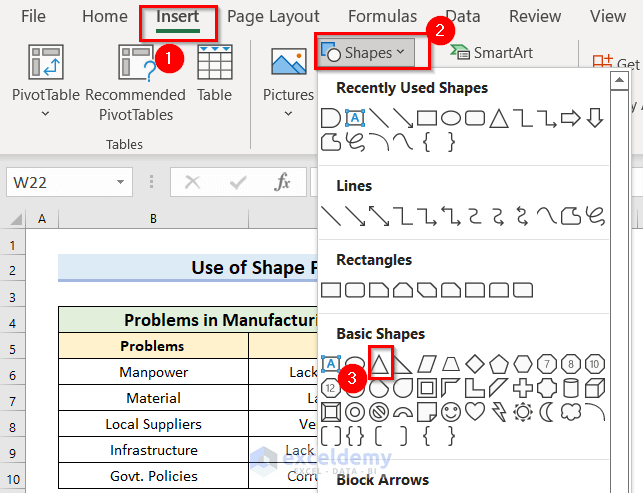
- From the Insert tab >> Go to the Shapes feature.
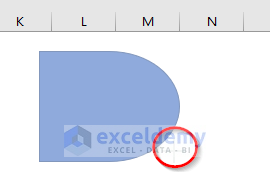
- Select the Delay shape which is in the Flowchart section.
- Drag the Mouse Pointer where you want to keep the Fish Head.
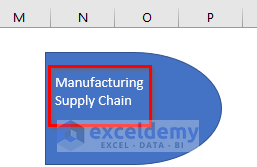
- Double-click on the shape and you will see the Text Bar to write.
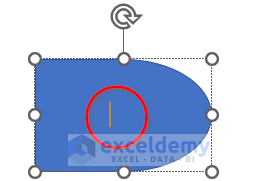
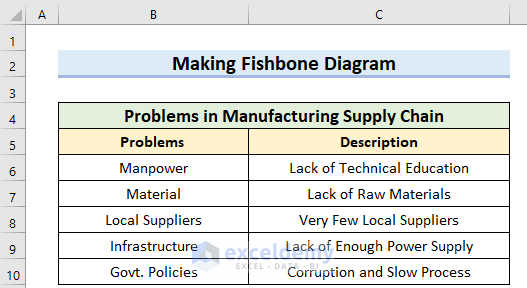
- You have to write the focus words of the diagram. We have written “Manufacturing Supply Chain”.
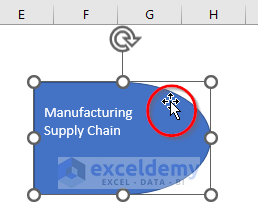
- You can simply change the Shapes location by dragging the Mouse Pointer.
Method 2 – Formatting Text in Fish Head
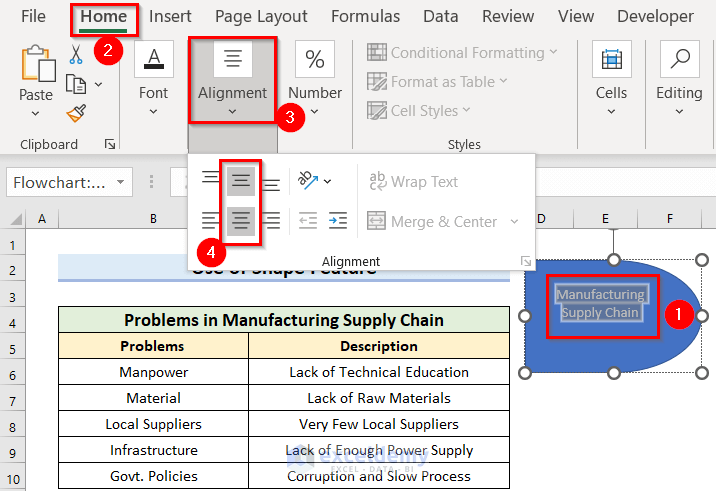
- You should select the Text.
- From the Home tab >> you may go to the Alignment feature. We have done Center and Middle alignment.
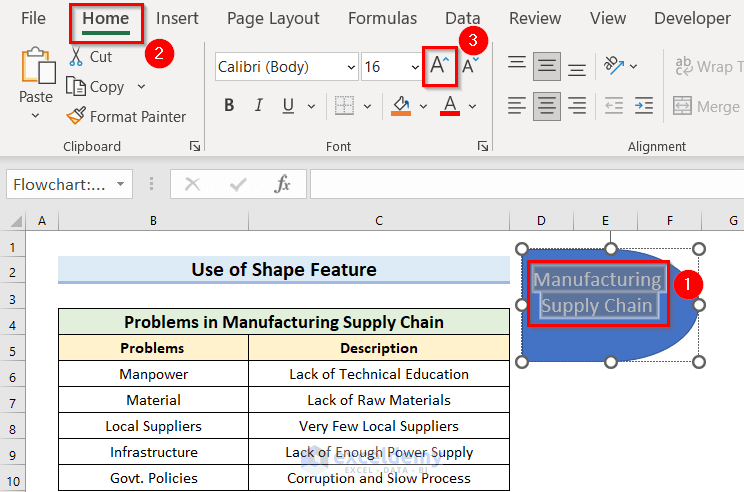
- Check whether the Text is selected or not.
- From the Home tab >> change the Font Size. Here, we have increased the Font Size to 16.
Method 3 – Including Main Bone of Fish
- From the Insert tab >> go to the Shapes feature.
- From the Lines command >> select the Line shape.
- Drag the Mouse Pointer towards the Fish Head.
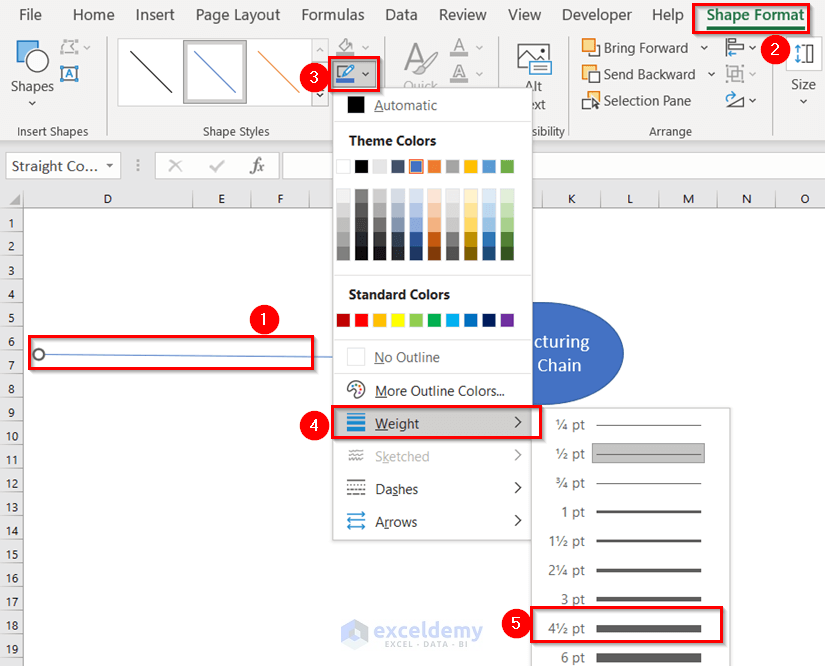
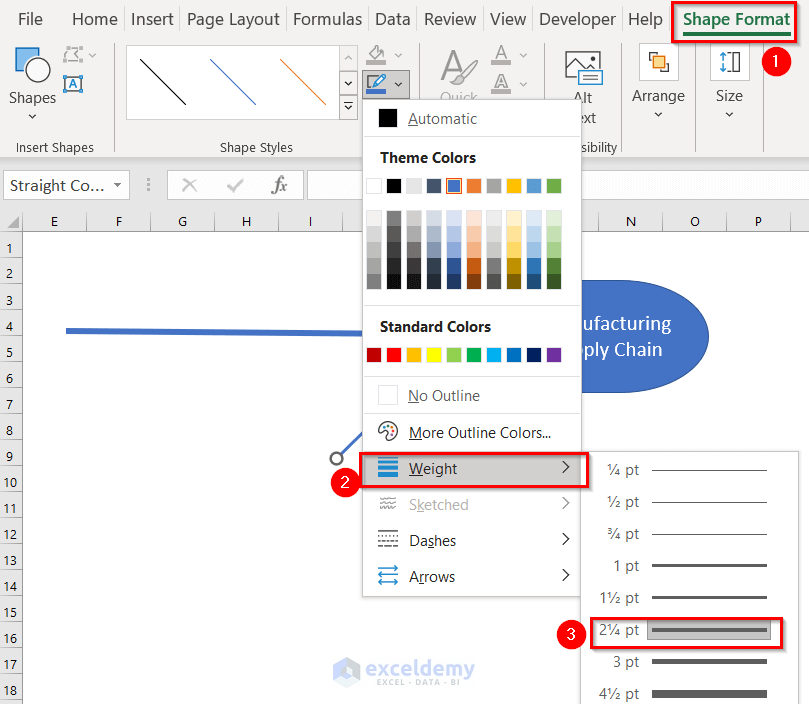
- From the Shape Format tab >> go to the Shape Outline.
- From the Weight option >> choose your preferred line weight. Choose a weight that will keep the diagram visible.
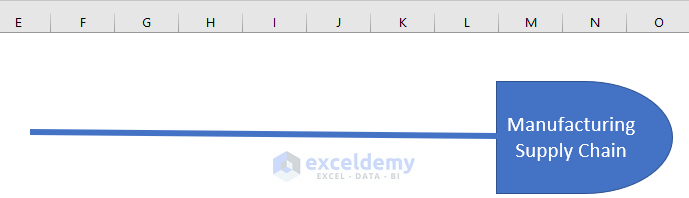
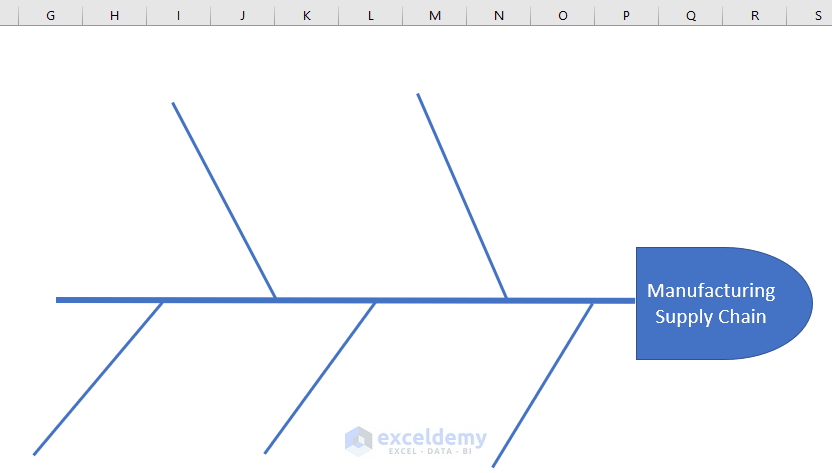
You will get the following output.
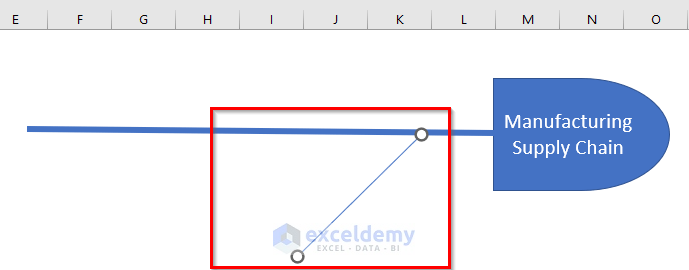
Method 4 – Adding Fish Bones
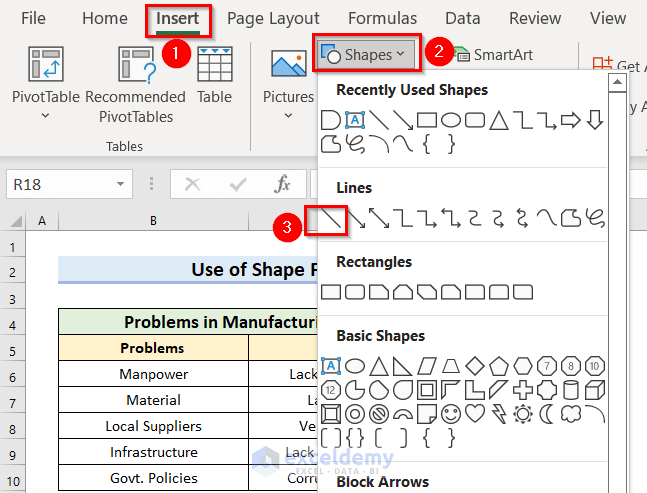
- From the Insert tab >> go to the Shapes feature.
- From the Lines command >> select the Line shape.
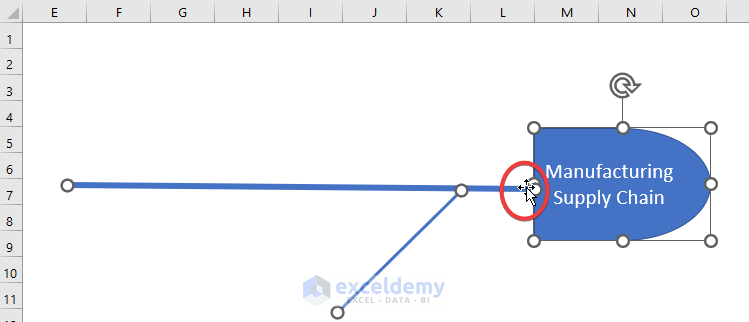
- Drag the Mouse Pointer towards the Fish Head and Main Bone.
- Select the shape.
- From the Shape Format tab >> go to the Shape Outline.
- From the Weight option >> choose your preferred line weight. Choose a weight that will keep the diagram visible. Keep this thinner than the Main Bone.
Move the whole diagram by selecting all those shapes using the Ctrl key.
- Draw more bones, you can copy the bone using Excel keyboard shortcuts Ctrl+C and then paste the bone by pressing the Ctrl+V keys. This is the easiest way to add lots of bones. When you have so many causes to describe; use this shortcut.
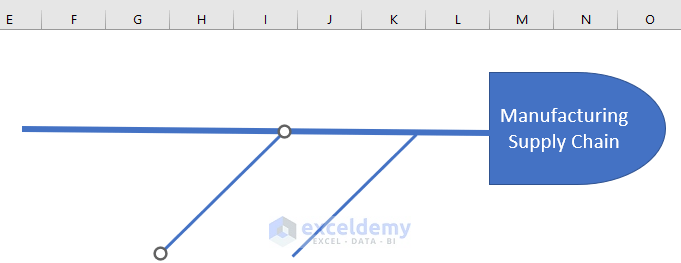
You will see the following shapes.
Method 5 – Inserting Fish Tail to Make Fishbone Diagram in Excel
- From the Insert tab >> go to the Shapes feature.
- Select the Isosceles Triangle shape, which is in the Basic Shapes section.
- Drag the Mouse Pointer where you want to keep the Fish Tail.
- Rotate the shape to look like a Fish Tail.
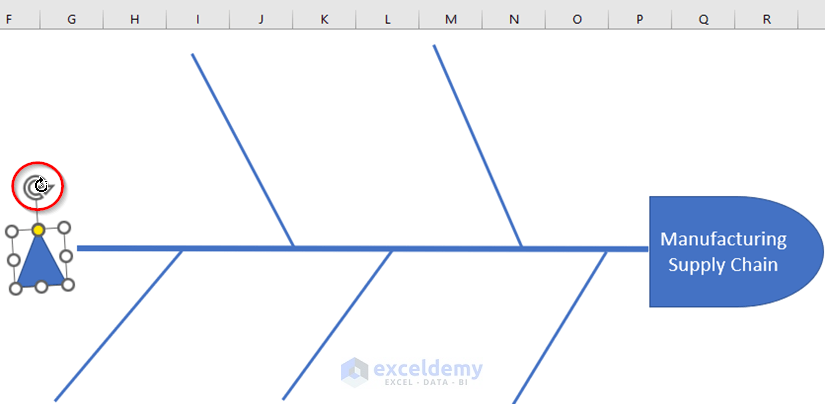
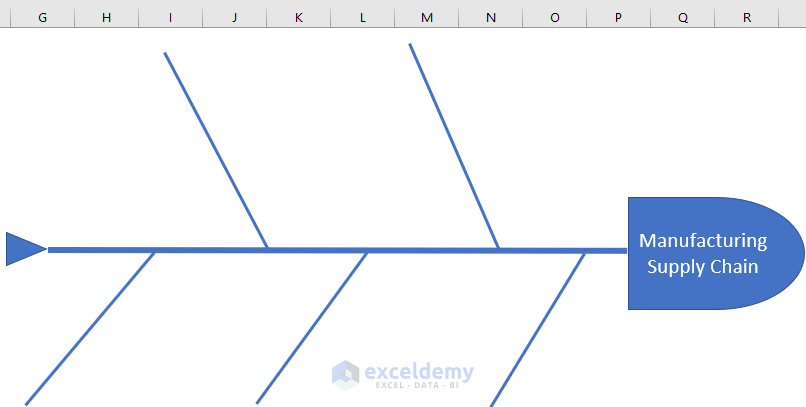
You will get the Fishbone Shape.
Method 6 – Including Chevron Arrow to Narrate Data for Making Fishbone Diagram
- From the Insert tab >> go to the Shapes feature.
- From the Block Arrows option >> select the Chevron arrow shape.
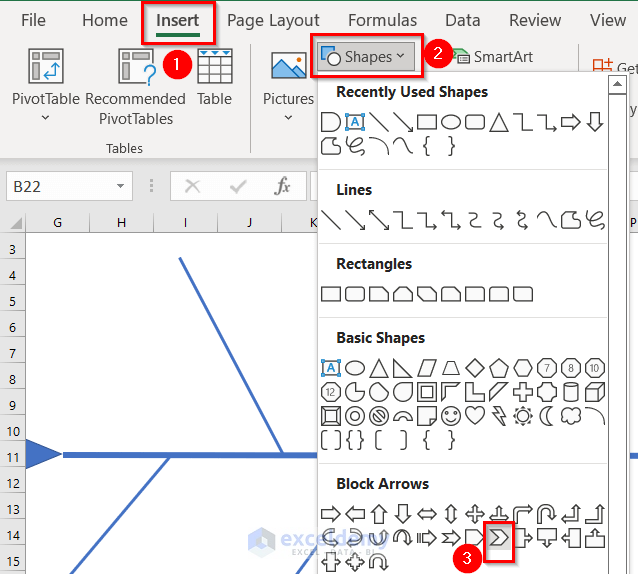
- Drag the Mouse Pointer where you want to keep the shape.
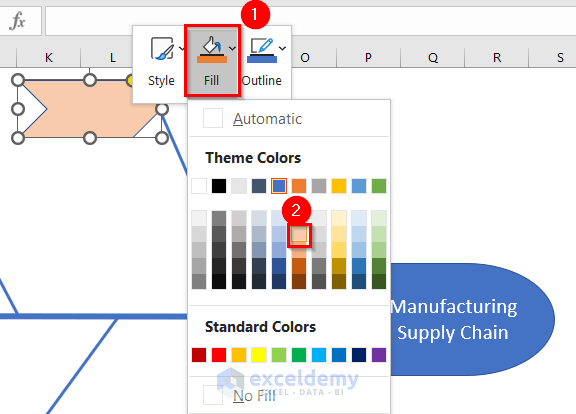
- Right-Click on the shape.
- From the Context Menu Bar >> go to Fill option >> change the fill color. We have chosen Orange, Accent 2, Lighter 60%. Try to choose any light color. Because the dark color may hide the inputted data. You may need to change the Font Color again.
- Draw more Chevron arrows, I used Excel keyboard shortcuts Ctrl+C keys to copy them and Ctrl+V keys to paste them. This is the easiest way to add lots of arrows. When you have so many causes to describe you must use this shortcut.
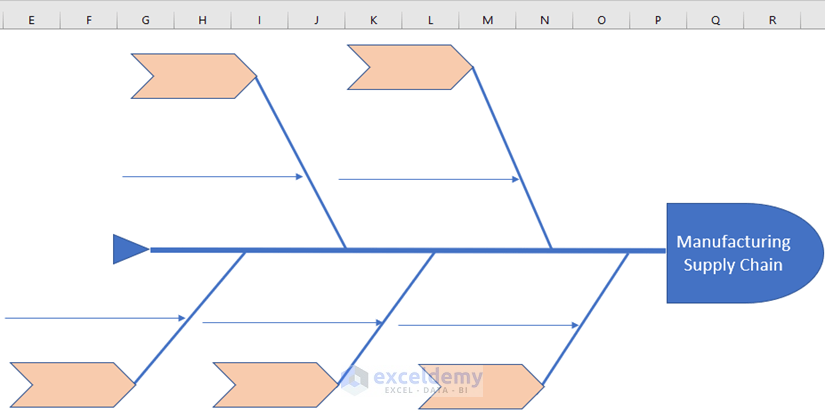
You will see the following shape.

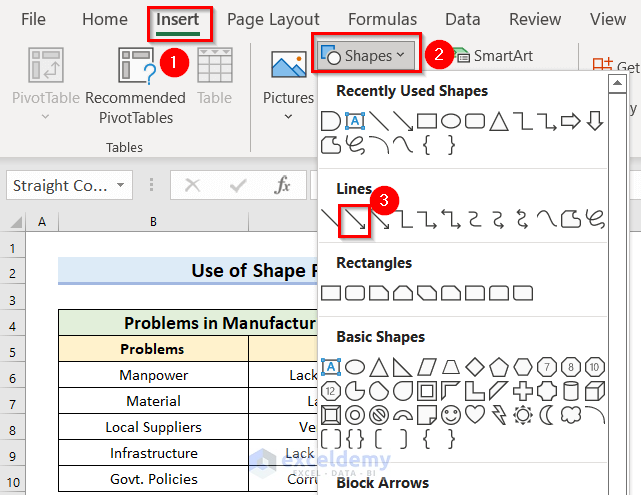
Method 7 – Placing Line Arrow to Make Fishbone Diagram in Excel
- From the Insert tab >> go to the Shapes feature.
- From the Lines command >> select the Line Arrow shape.
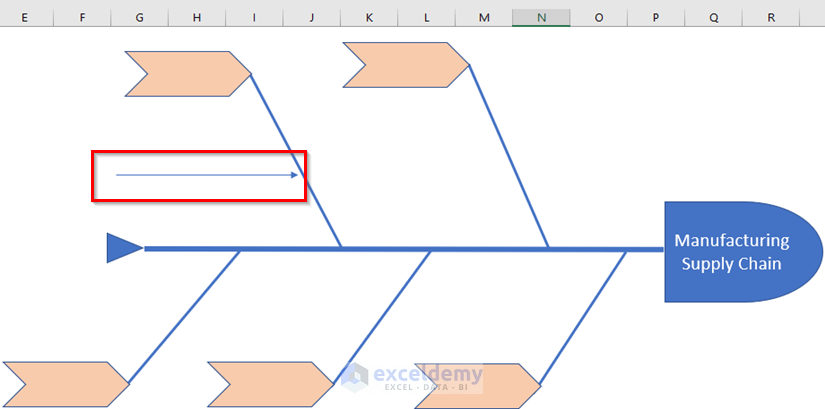
- Drag the Mouse Pointer towards the Fish Bones.
- Draw more Line Arrows, we used Excel keyboard shortcuts Ctrl+C keys to copy them and Ctrl+V keys to paste them. This is the easiest way to add lots of arrows. When you have so many causes to describe you should use this shortcut.
You will see the following shape.
Method 8 – Inserting Data in Fishbone Diagram
- Write the causes inside of the Chevron arrows.
Describe the causes you should use the Text Box feature.
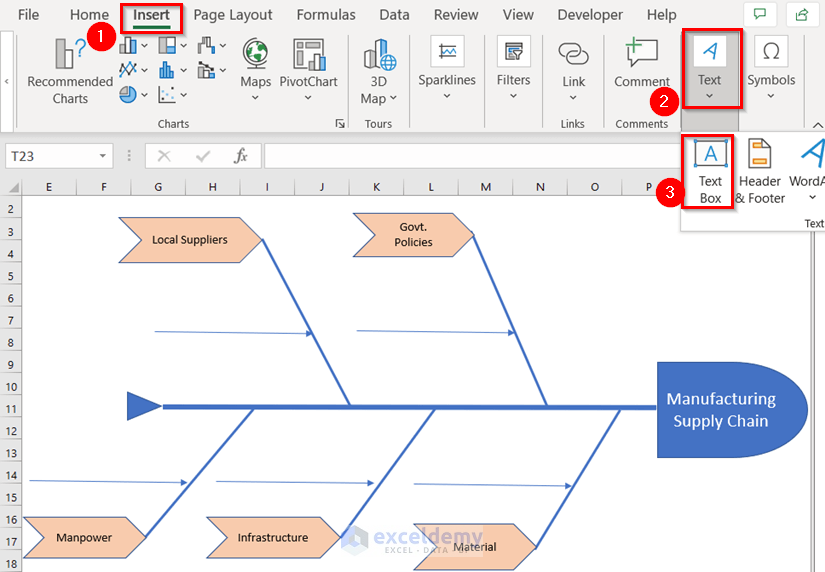
- From the Insert tab >> you should go to the Text command.
- Click the Text Box feature.
- Drag the Mouse Pointer above the Line Arrow.
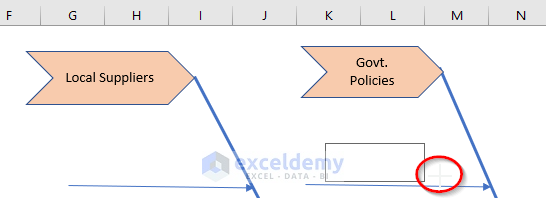
- Write the description in the box.
- Select the box.
- From the Home tab >> change the Alignment to Middle and Center.
- From the Fill option >> choose No Fill.
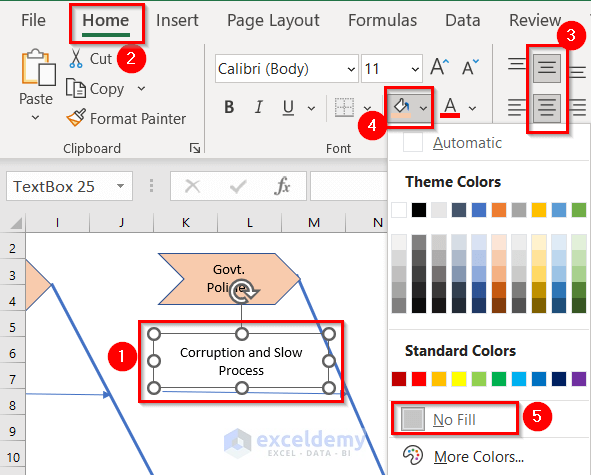
- Write the description for the other arrows.
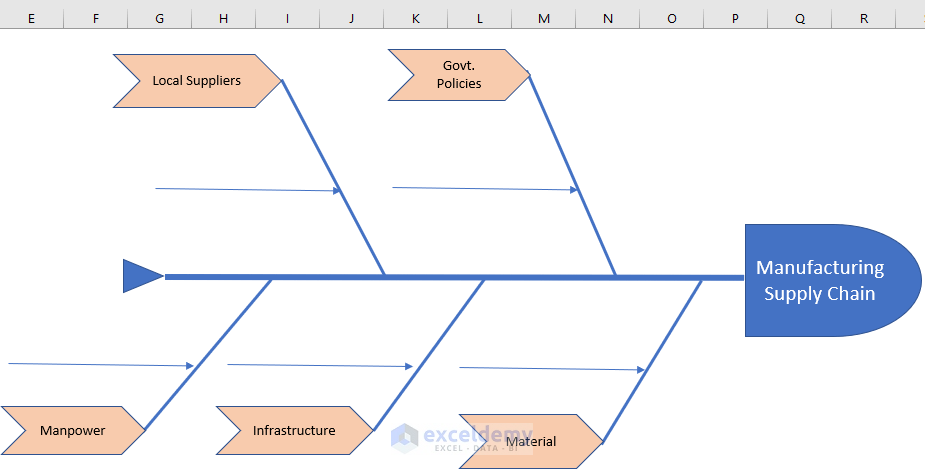
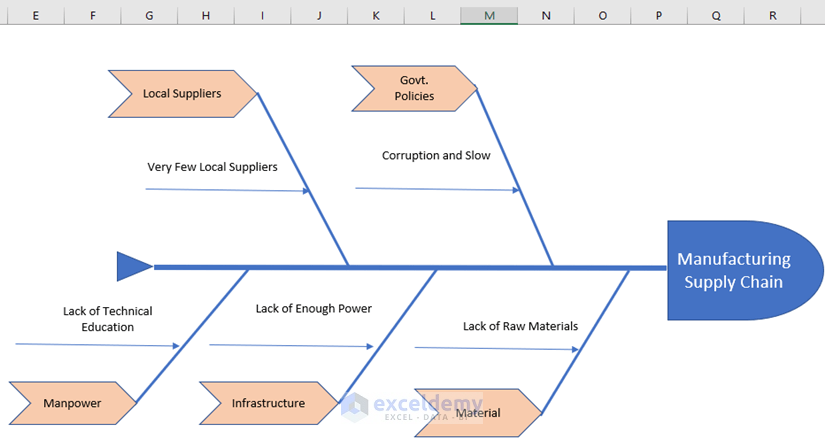
You will see the Fishbone diagram.
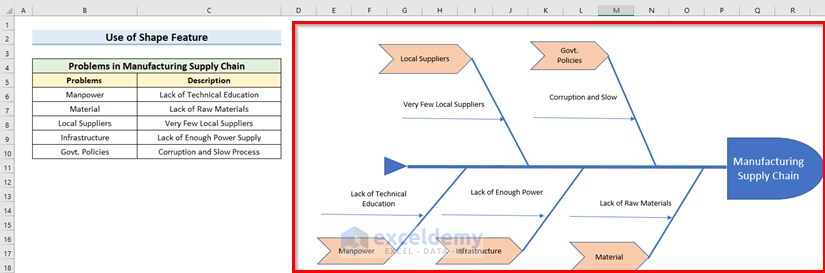
We have attached a clear view of the Ishikawa diagram.
Things to Remember
- If you change the length or width of any column or row then the diagram will also be either elongated or narrated.
- Moreover, this is totally a manual process. Thus, you have to change every shape individually.
Download Practice Workbook
You can download the practice workbook from here:
Related Articles
- How to Draw Isometric Drawing in Excel
- How to Draw Shapes in Excel
- How to Remove Unwanted Objects in Excel
- How to Draw Engineering Drawing in Excel
- How to Draw a Floor Plan in Excel
<< Go Back to Drawing in Excel | Learn Excel
Get FREE Advanced Excel Exercises with Solutions!

