Let’s consider sales of flowers at a shop. With the help of a pie chart, we can show the sales of different flowers graphically.

Note: One thing to remember is that we will use Pie Chart for a relatively small amount of data. If the dataset is comparatively large, then the use of Pie Chart might not be a viable option. In that case, you may create a Pie Chart for sum by category if you find it necessary.
How to Make a Pie Chart with Multiple Data in Excel: 2 Ways
Method 1 – Using Recommended Charts Command
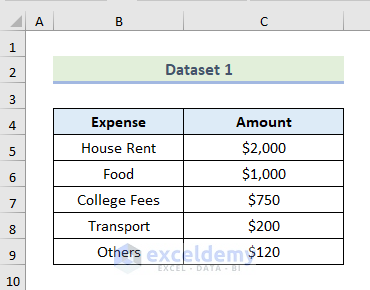
In the following data set, we have a person’s monthly expenses for different household activities. We will add a Pie Chart to show this dataset graphically.
Steps:
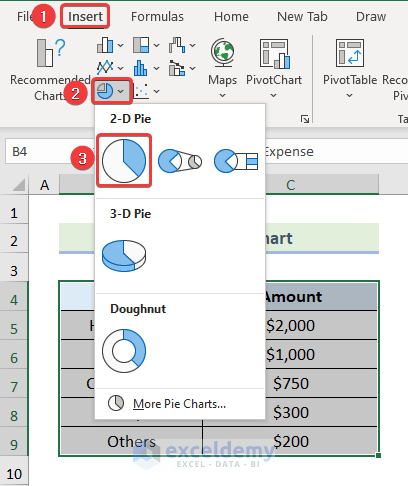
- Select the dataset and go to the Insert tab from the ribbon.
- Click on Insert Pie or Doughnut Chart from the Charts group.
- From the drop-down, choose the 1st Pie Chart among the 2-D Pie options.
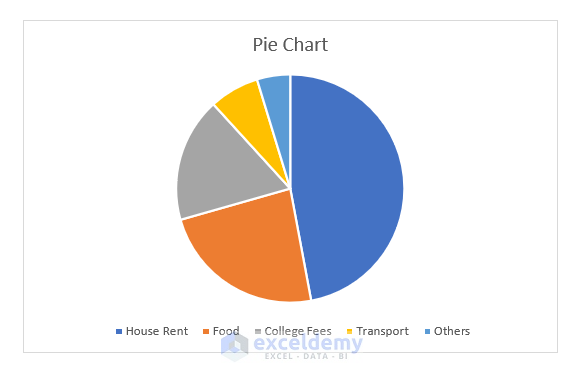
- After that, Excel will automatically create a Pie Chart in your worksheet.
Read More: How to Create a Pie Chart in Excel from Pivot Table
Method 2 – Making a Pie Chart with Multiple Data from Pivot Charts Option
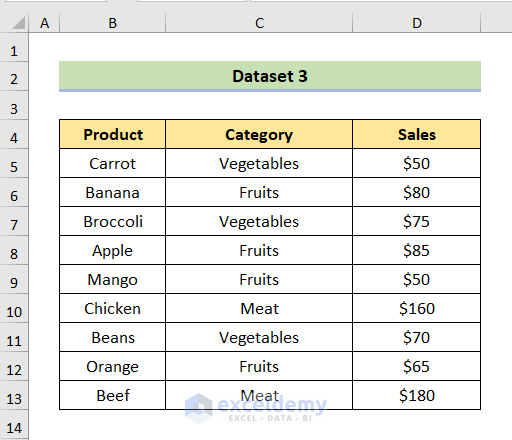
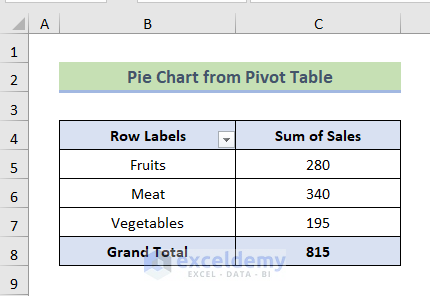
In the following data set, we have monthly sales data of different categories of a grocery store. Let’s create a Pivot Table and add a Pie Chart from that Pivot Table.
- After following the steps on how to create pivot tables, we can get the following output.
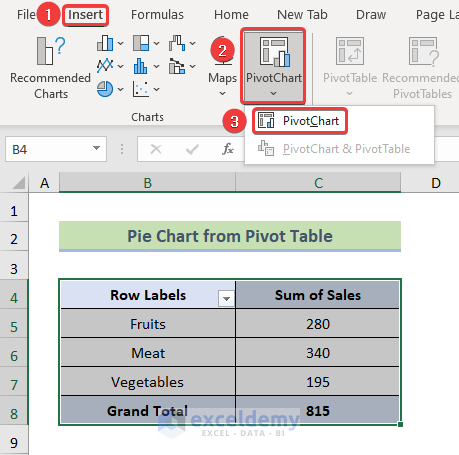
- Select the data set and go to the Insert tab from the ribbon.
- Click on the Pivot Chart from the Charts group.
- Select Pivot Chart from the drop-down.
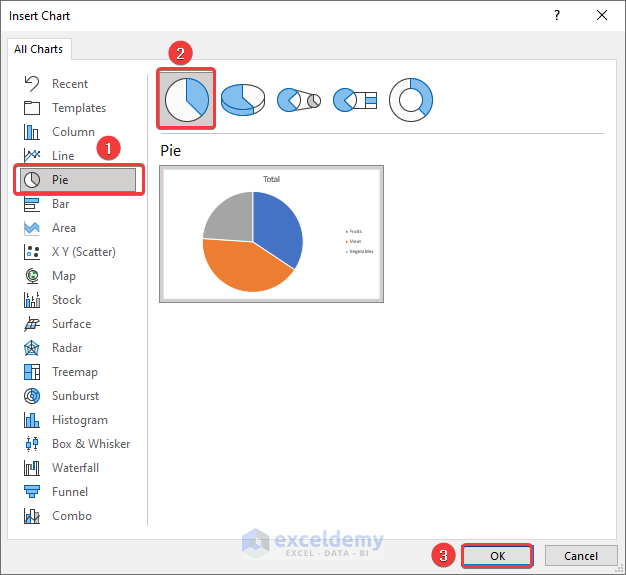
- Select Pie from the Insert Chart dialogue box.
- Click OK.
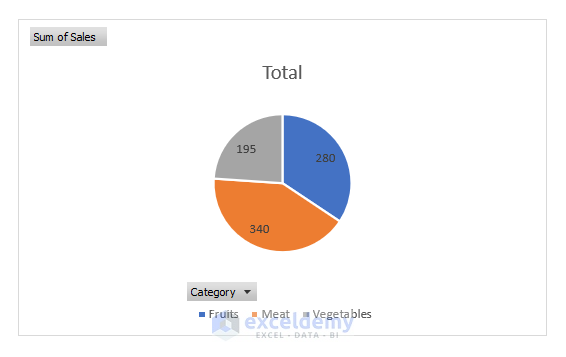
- This has created a Pie Chart from a Pivot Table.
How to Edit a Pie Chart
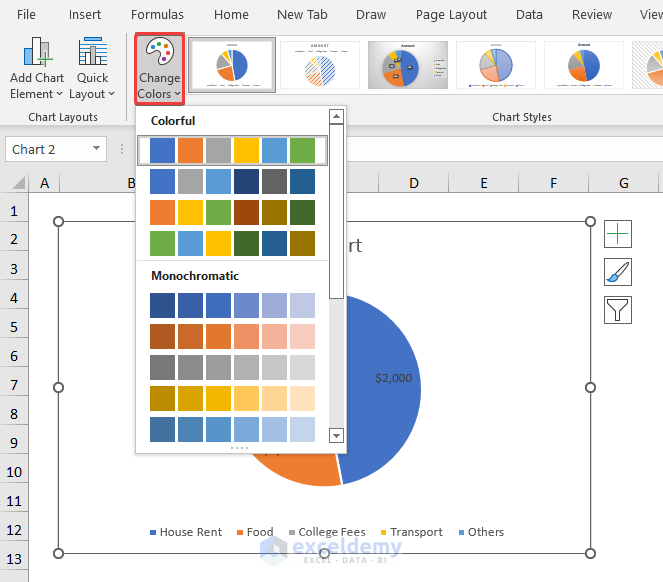
Method 1 – Editing Color of Pie Chart
Steps:
- Click on any portion of the chart area. The Chart Design tab will open.
- Click on the Change Colors option.
- From the drop-down, you can choose your preferred color.
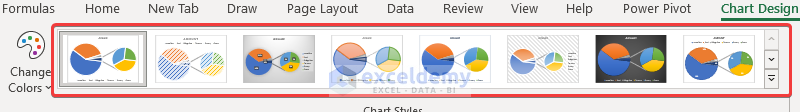
Method 2 – Customizing Style of Pie Chart
Steps:
- Click on the Pie Chart, and the Chart Design tab will be visible in the top ribbon.
- Select your preferred Style of the Pie Chart from the list of styles.
Method 3 – Formatting Data Labels
Steps:
- To add Data Labels, click on the Plus sign as marked in the following picture.
- Check the box of Data Labels.
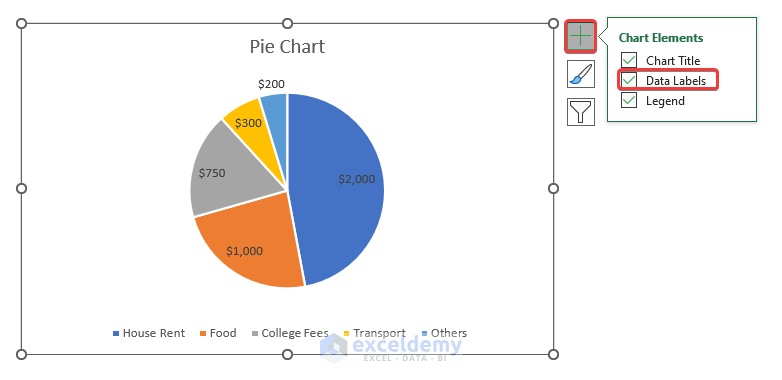
- At this stage, you will be able to see that all of your data has labels now.
- Right-click on any of the labels and select Format Data Labels.
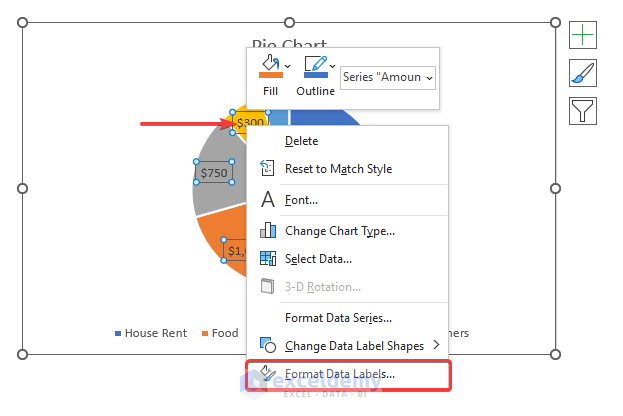
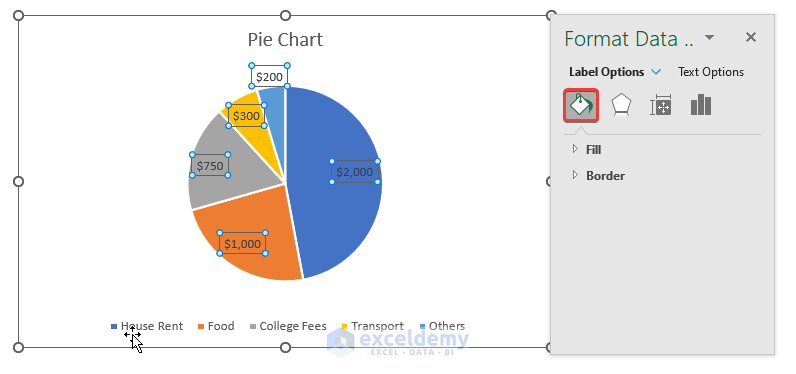
- Anew dialogue box named Format Data Labels will pop up.
- To edit the Fill and Border of background of the Data Labels, select the Fill & Line tab.
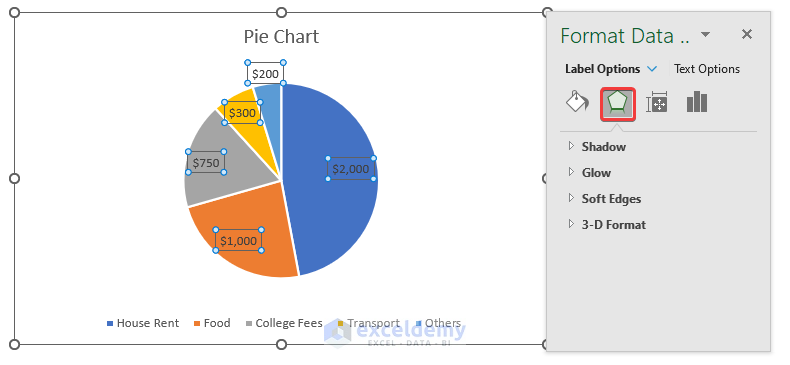
- You also have customization options for adding Shadow, Glow, Soft Edges,3-D Format under the Effects tab.
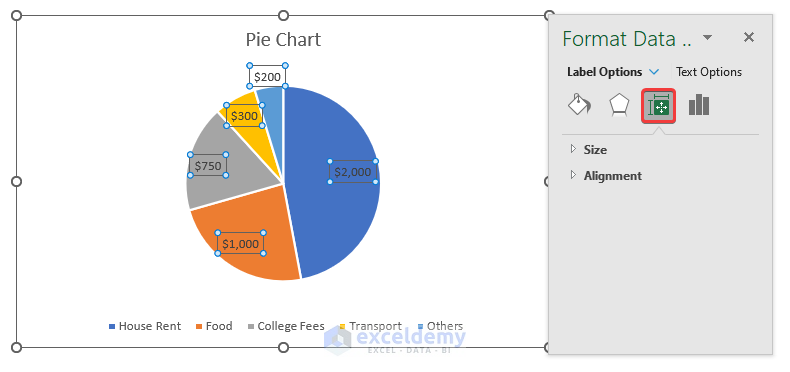
- In the Size and Properties tab, you can adjust the Size and Alignment of the Data Labels.
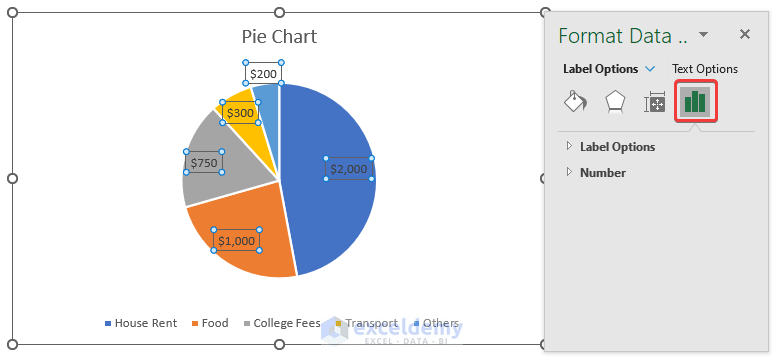
- From the Label Options tab, you can adjust position of your Data Label, format the data type of the Data Label and so on.
Read More: How to Make a Pie Chart in Excel with One Column of Data
How to Make a Pie of Pie Chart
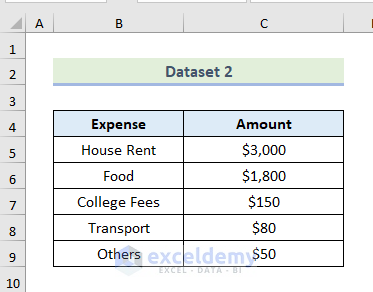
In the following data set, we have someone’s monthly expenses for various household activities. If we look closely into our data set, we can see that the bottom three values are way lower than the top two values. This is a perfect opportunity to implement the Pie of Pie Chart.
Steps:
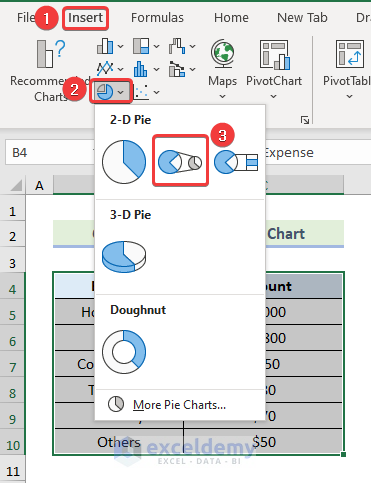
- Select the entire data set and go to the Insert tab from the ribbon.
- Choose Insert Pie and Doughnut Chart from the Charts group.
- Click on the 2nd Pie Chart among the 2-D Pie options as marked on the following picture.
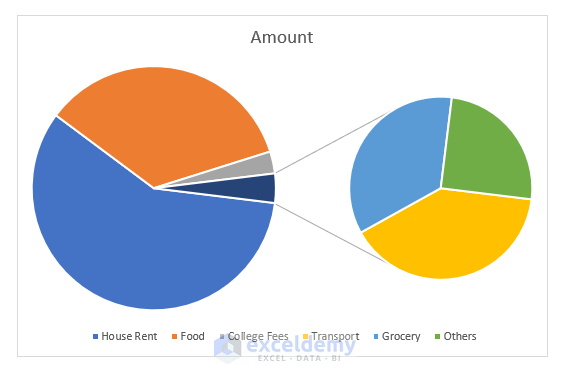
- Excel will create a Pie of Pie Chart in your worksheet.
You can also tell Excel how many of the bottom values you want to show in the 2nd Pie Chart.
Steps:
- Right-click on any part on the Pie Chart.
- Select Format Data Series.
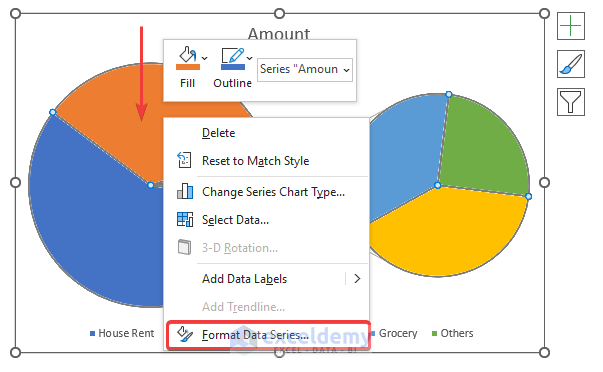
- In the Format Data Series dialogue box, go to Values in second plot option.
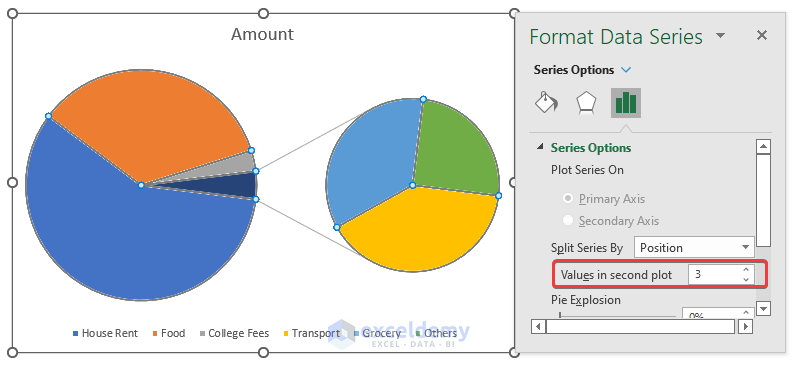
- Increase or decrease the number of values you want to show in the Second Pie Chart.
Read More: How to Make a Pie Chart in Excel with Words
Things to Remember
- To make the Chart Design tab visible, you must click anywhere on the Pie Chart.
- While editing the Pie of Pie Chart, make sure that you right-click on the Pie Chart inside the chart area. Otherwise, the Format Data Series option will not be visible.
Download Practice Workbook
Related Articles
<< Go Back To Make a Pie Chart in Excel | Excel Pie Chart | Excel Charts | Learn Excel
Get FREE Advanced Excel Exercises with Solutions!
