Make a Pie Chart in Excel
Nov 11, 2025
Square Pie Chart is a kind of synchronized grid with an equal number of rows and columns. Usually, it shows the dataset value in percentage. Suppose ...
Aug 13, 2024
This is an overview:
Method 1 - Using the Percentage to Create a Gender Pie Chart in Excel
Steps:
Select the cell to get the ...
Aug 2, 2024
What Is the Bar of a Pie Chart in Excel?
The Bar of pie is a type of chart that displays a bar chart with the pie chart.
The sample ...
Nov 11, 2025
If you are looking for how to make two pie charts with one legend in Excel, then you are in the right place. In our practical life, we often need to ...
Nov 11, 2025
The 3D pie chart consists of a circle that is divided into segments, each representing a proportion of the share of each value in a dataset. The ...
Jun 15, 2024
Step 1 - Prepare Dataset
Before we delve into creating the pie chart, we need to collect and organize the information that we will plot. ...
Jun 15, 2024
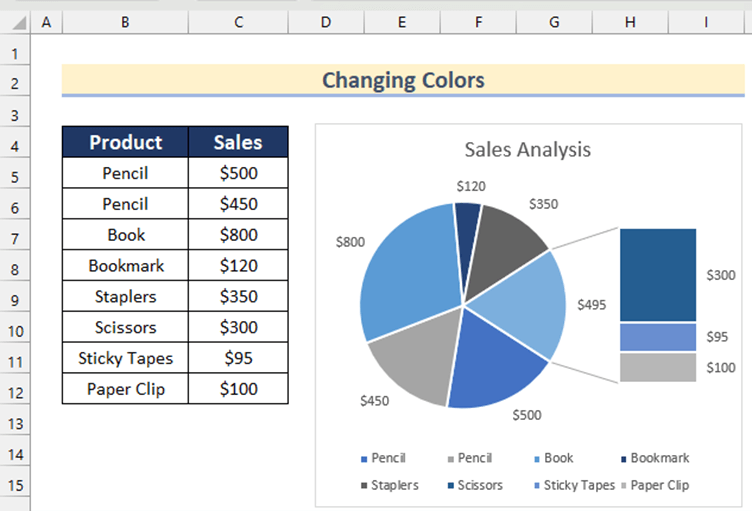
Suppose you have sales data categorized by different product types. However, you want to see how individual subcategories contribute to the total ...
Jul 3, 2024
What Is a Pie of Pie Chart?
Pie of Pie Chart is a Pie chart under which there will be a secondary Pie chart. The Pie of Pie chart separates some ...
Jul 6, 2024
Step 1 - Arranging the Dataset for a Pie Chart in Excel
Insert the data you need to plot in the chart. We'll use a list of employees and their ...
Jun 15, 2024
Let’s consider sales of flowers at a shop. With the help of a pie chart, we can show the sales of different flowers graphically.
Note: One ...
Nov 11, 2025
In this tutorial, you will learn how to make a Pie Chart in Excel without numbers. This type of situation is very common where you need people’s ...
Jun 18, 2024
Here, we have a dataset containing the sales data of 5 shops for three consecutive months: January, February, and March. We will use this dataset to ...
Jul 16, 2024
What is a Pie Chart?
A Pie Chart is a circular graph where each slice represents a proportionate part of the entire dataset. In Microsoft Excel, ...
Nov 11, 2025
Excel datasets contain sectionized data that can be referred to as breakout. The typical way to make a pie chart with breakout in Excel involves ...
Aug 12, 2024
This is the sample dataset.
Method 1 - Inserting a PivotTable to Create a Pie Chart in Excel
Step 1:
Select the entire column. Here, ...