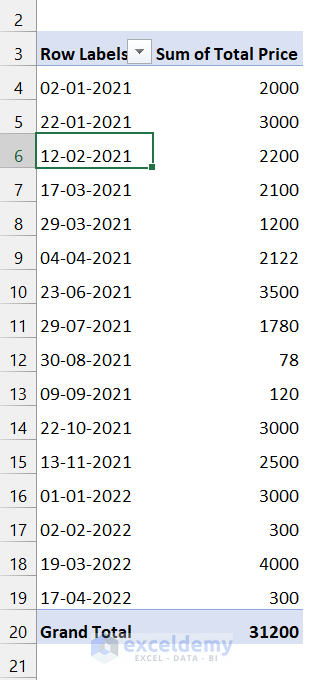
Method 1 – Group Dates by Years in Pivot Table
Steps
- Select any date from the pivot table.
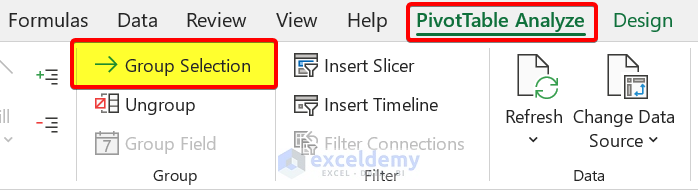
- Go to the PivotTable Analyze, and from the Group field, select Group Selection.
- Find the following box:
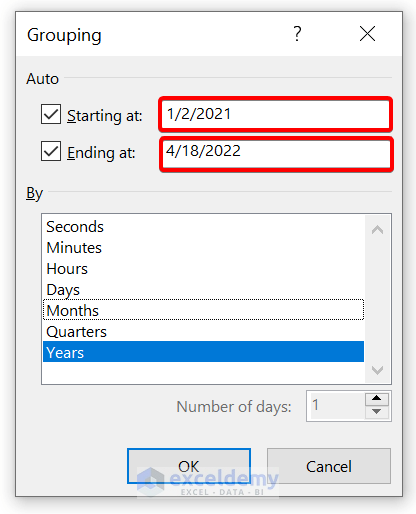
- See the starting and ending dates of a group. You can change this according to your needs.
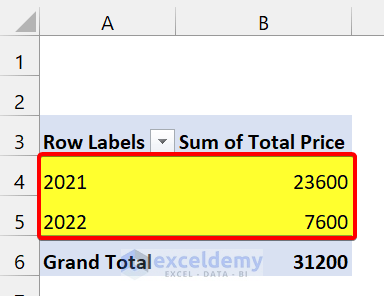
- Select Years and click OK.
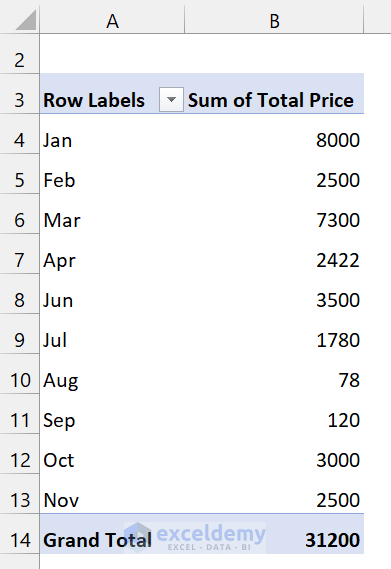
Method 2 – Group Dates by Months
Steps
- Select any date from the pivot table.
- Go to the PivotTable Analyze and from the Group field, select Group Selection.
- Find the following box:
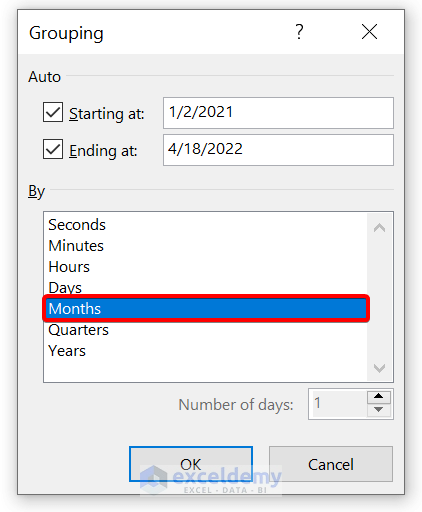
- Select Months and click OK.
Method 3 – Group Dates by Months and Years Together
Steps
- Select any date from the pivot table.
- Go to the PivotTable Analyze, and from the Group field, select Group Selection.
- Find the following box:
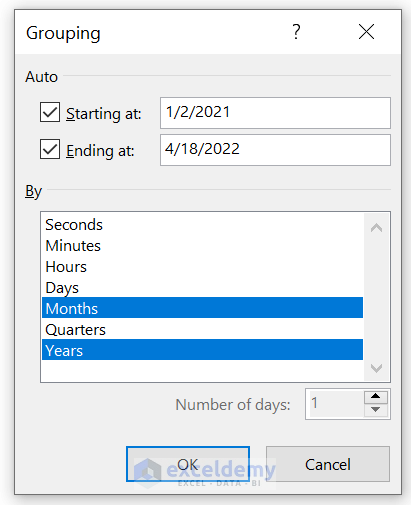
- Select Months and Years. Click OK.
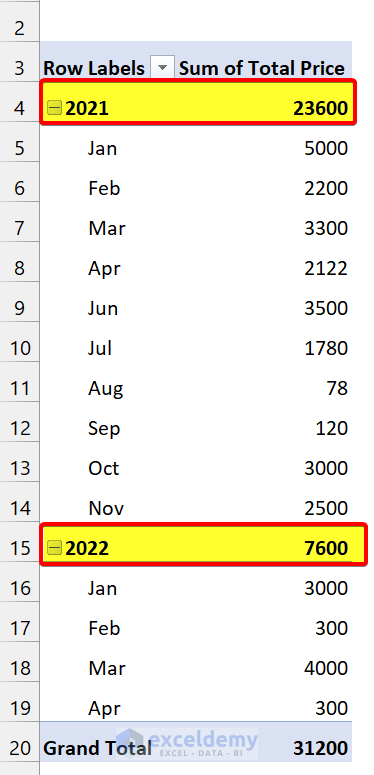
The output from the above screenshot shows that you can easily group dates based on Months and Years in a pivot table.
Method 4 – Group Dates by Weeks in Pivot Table
Steps
- Select any date from the pivot table.
- Go to the PivotTable Analyze, and from the Group field, select Group Selection.
- Find the following box:
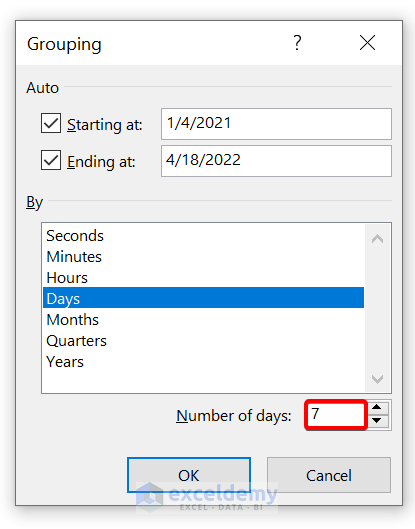
Remember the starting dates, if you want to start with any particular day of the week, change there.
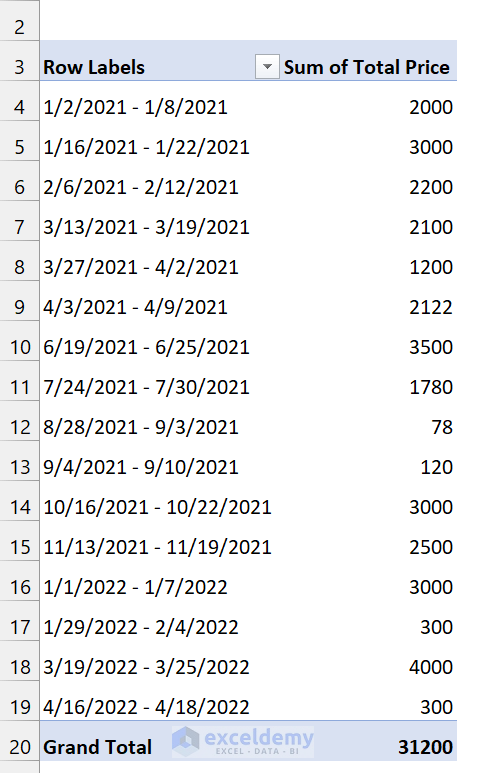
- Click OK.
Method 5 – Group Dates by Quarters in Pivot Table
Steps
- Select any date from the pivot table.
- Go to the PivotTable Analyze, and from the Group field, select Group Selection.
- Find the following box:
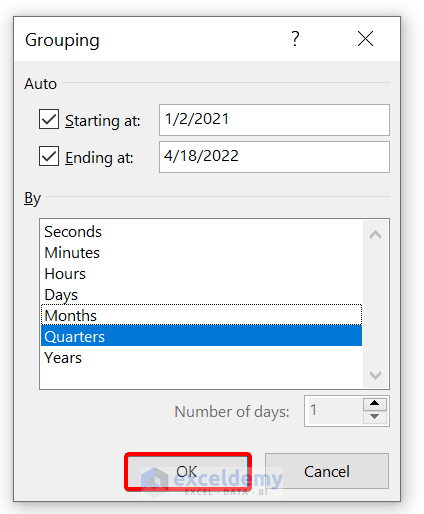
- Select the Quarters and click OK.
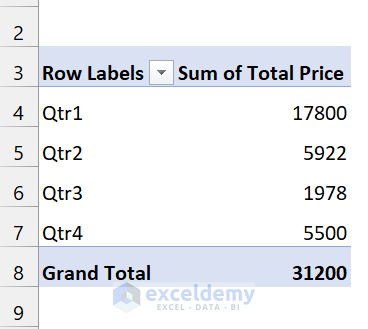
- The issue with this is all the quarters also include the quarters both 2021 and 2022. You can differentiate them from here. Group them in separate years and do the following:
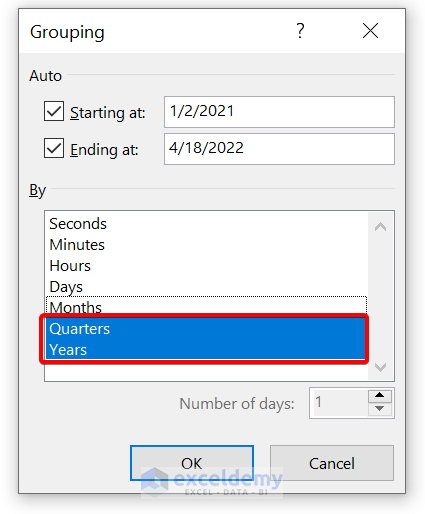
- Select both Quarters and Years. Click OK.
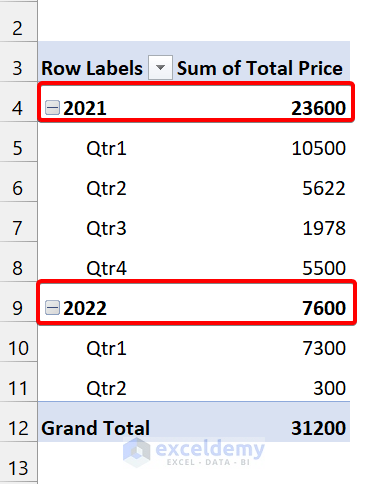
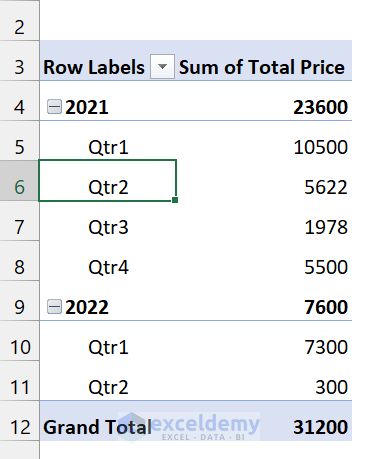
We grouped the dates based on Quarters in the pivot table.
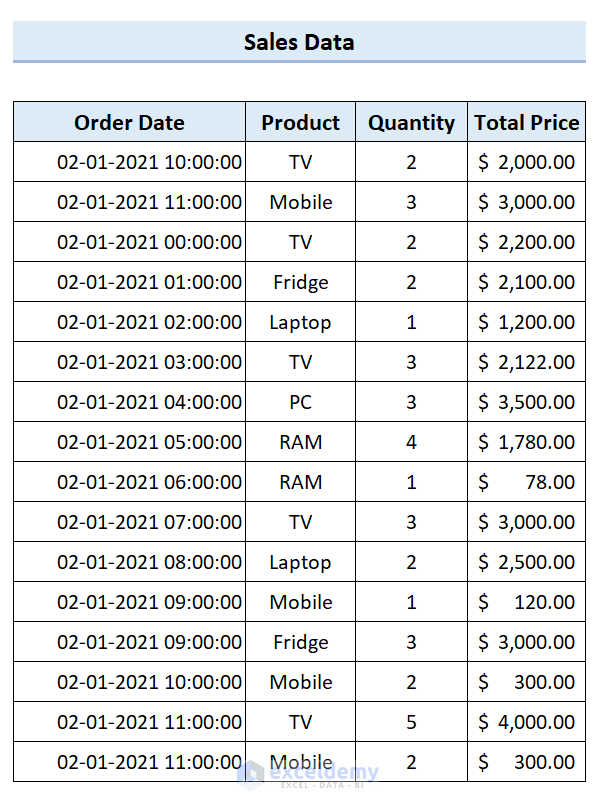
Method 6 – Group Dates by Hours/Seconds/Minutes
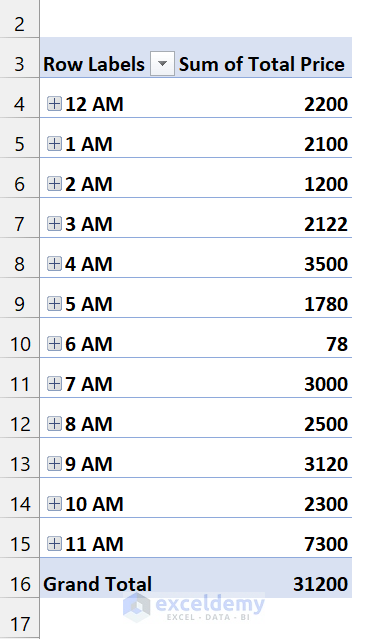
Group dates into Hours if your dataset looks like this:
Steps
- Select any date from the pivot table.
- Go to the PivotTable Analyze, and from the Group field, select Group Selection.
- Find the following box:
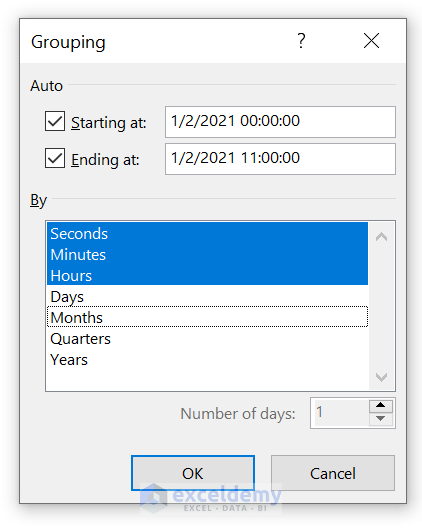
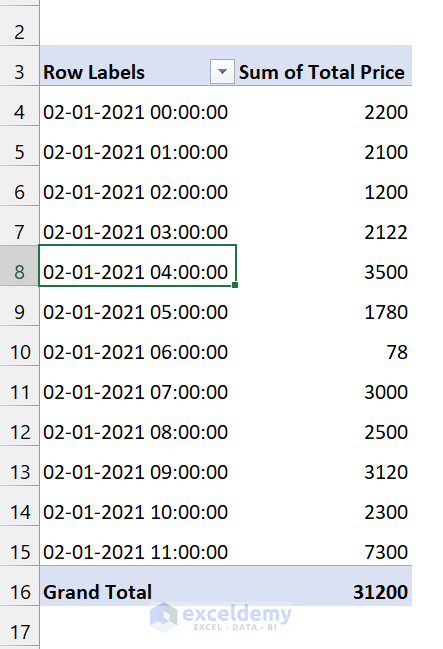
- Select Hours, Minutes, and Seconds and click OK.
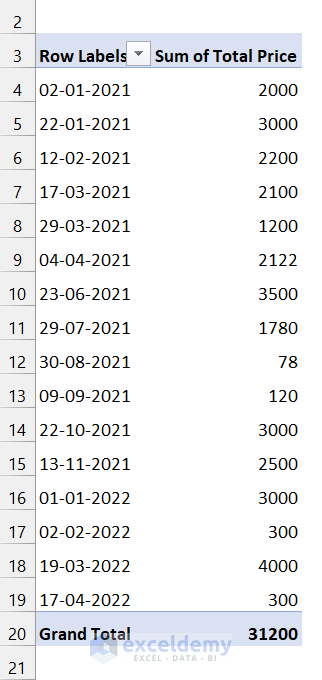
Method 7 – Group Dates by Adding Extra Items in Pivot Table
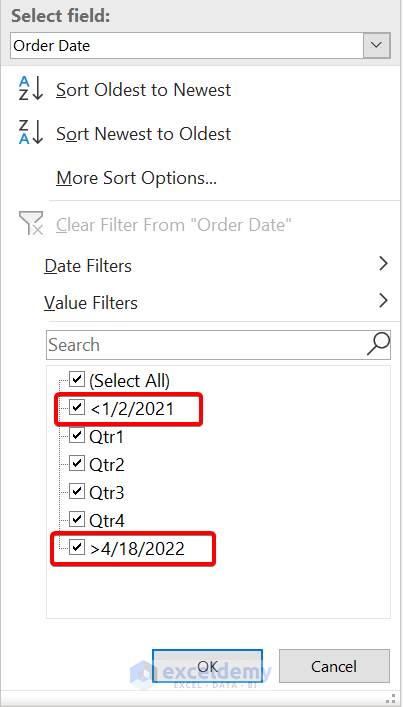
When you add data before the starting date or after the ending date, the pivot table represents them with “<” or “>” signs.
Fnd this in the filter section after grouping dates.
Find the sum of the total price after you have added the newest data.
Ungroup Dates in Pivot Table
Steps
- Select any element of your grouped date.
- Right-click on your mouse.
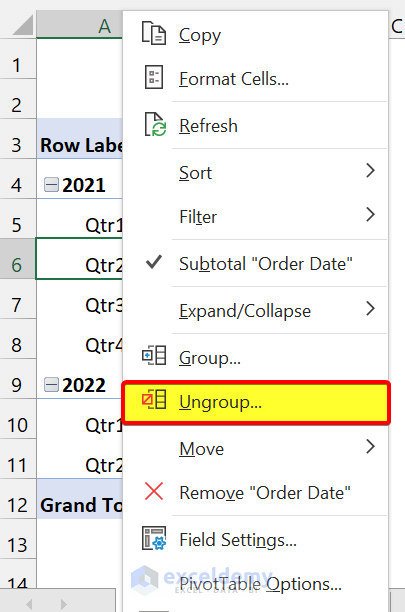
- Click Ungroup.
There are no dates in a particular group of that pivot table.
Things to Remember
✎ You can easily group dates in the pivot table by right-clicking and selecting the Group command.
✎ When you group dates based on Days, some calculated fields won’t work.
✎ If your dataset doesn’t contain the hours, minutes, and seconds, it won’t produce the output like this article.
Download Practice Workbook
Group Dates in Pivot Table : Knowledge Hub
<< Go Back to Group Pivot Table | Pivot Table in Excel | Learn Excel
Get FREE Advanced Excel Exercises with Solutions!
