In the laboratory, when we work with empirical data, there is this possibility of inaccuracy. The Excel workbook can find this inaccuracy. In this article, we will show you how to find the uncertainty of slope in Excel on the basis of a dataset.
Download Practice Workbook
You can download and practice this workbook.
Basics of Slope and Uncertainty of Slope
Slope:
It defines the steepness. The slope indicates whether there is an upward trend or a downward trend.
There are many formulas for slope. The basic one is:
Slope = (y2-y1)/(x2-x1)Uncertainty of Slope:
If our data is consistent that is increasing or decreasing at the same rate, we will get a straight line and there will be no uncertainty of slope. But the empirical data for research purposes are not quite consistent.
Uncertainty of Slope is essentially the amount of compensation that we associate with a slope value in case of an inconsistent dataset.
Steps to Find Uncertainty of Slope in Excel
The empirical data are not consistent when we determine their slope. There is more than one possible straight line that we can be drawn out of an inconsistent dataset. We are going to find this uncertainty using the LINEST function. So let’s start.
Step 1: Dataset to Find Uncertainty and Slope
We need two variables to find the slope and its uncertainty. One variable is along the Y axis and the other is on the X axis.
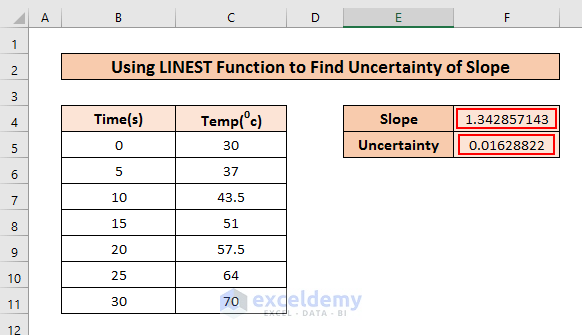
That’s why we have taken a dataset of temperature that varies inconsistently with time. We will determine the slope and its uncertainty.

Read More: How to Find the Slope of a Line in Excel (5 Easy Ways)
Step 2: Allocating Blank Cells
We need two blank cells to show the result of the slope value and uncertainty value. If you want more statistical value use more blank cells.
➤ Allocate two blank cells where you will get the values of slope and its uncertainty.

Read More: How to Find Instantaneous Slope on Excel (2 Effective Ways)
Step 3: Using LINEST Function to Find Uncertainty of Slope
The LINEST function is used to analyse data, especially slope, uncertainty of slope, y-axis intercept, uncertainty of y-intercept, and some other statistical values. Out of those, we will find slope and uncertainty of slope.
➤ First, select both the cells F4 and F5.
➤ Then, write the following formula and press CTRL+SHIFT+ENTER simultaneously.
=LINEST(C5:C11,B5:B11,1,1)In this equation,
C5:C11:- values for Y axis
B5:B11:- values for X axis
1 :- best fit line not goes through the origin
1 :- returns uncertainty value

Thereby, we get the slope and uncertainty values in F4 and F5 respectively.
Read More: How to Calculate Standard Error of Regression Slope in Excel
Practice Section
You can download the practice workbook from the download section and practice yourself.

Conclusion
So, we have shown how you can find uncertainty of slope in Excel. We hope you find this article useful. And, if there are any questions or suggestions about this procedure, please leave them in the comment section.
Related Articles
- How to Calculate Slope of Exponential Graph in Excel (Easy Steps)
- Calculate Confidence Interval for Slope in Excel
- How to Find Slope of Tangent Line in Excel (2 Suitable Ways)
- Find Slope of Trendline in Excel (2 Easy Methods)
- How to Find Slope of Polynomial Trendline in Excel (with Detailed Steps)
- Use Excel SLOPE Function (5 Quick Examples)
- How to Find Slope of Logarithmic Graph in Excel (with Easy Steps)
<< Go Back to Excel LINEST Function | Excel Functions | Learn Excel
Get FREE Advanced Excel Exercises with Solutions!
