What Is SLA and SLA Percentage?
SLA stands for service level agreement. It expresses the level of service quality the customer expects from the vendor or service provider. It also includes a set of penalties if the service level is below the expected value.
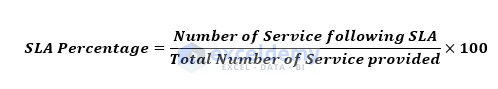
The formula for the SLA percentage is given below.
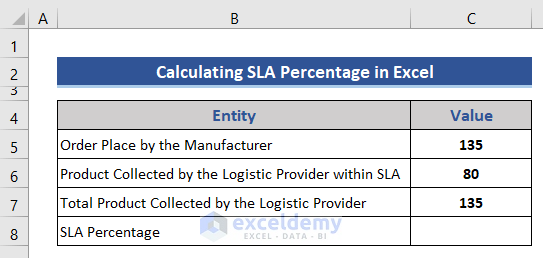
The sample dataset showcases the SLA conducted by a logistic service provider and electronics product manufacturer. The manufacturer requires the logistic provider to collect the product from 9:00 AM to 02:00 PM every day. The logistic provider will collect the product until 4:00 PM according to the SLA. But the product can also be collected between 4:00 PM and 6:00 AM incurring on a 25% penalty for late collection.
Step 1 – Calculate the SLA Percentage with a Formula
- Go to C8 and enter the following formula.
=C6/C7
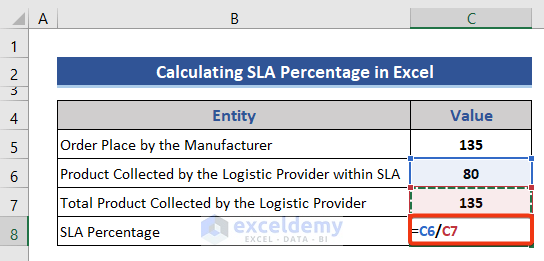
Division of the product collected within the SLA criteria and the total number of products collected on that day.
- Press Enter
Read More: Make an Excel Spreadsheet Automatically Calculate Percentage
Step 2 – Apply a % Format to Get the SLA Percentage in Excel
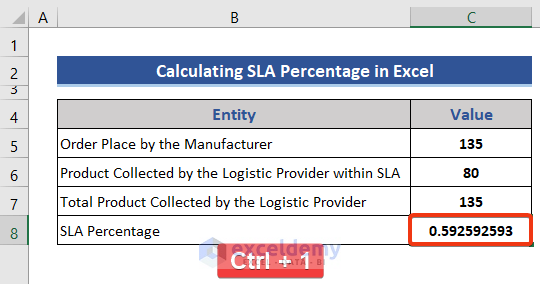
To see the result in percentage form, change the format of C8. Press Ctrl + 1.
- In Format Cells, select the Number tab.
- Choose Percentage.
- Select the number of decimal places.
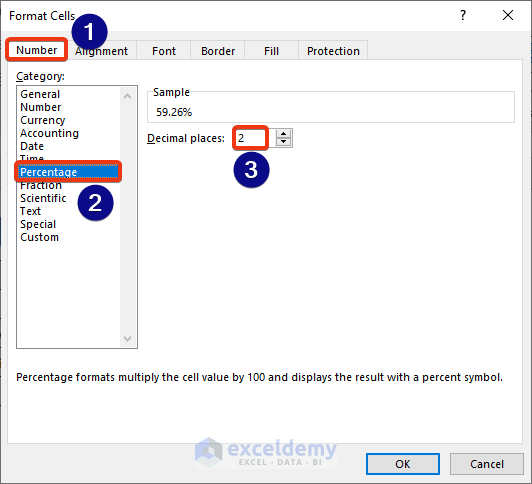
- Press OK.
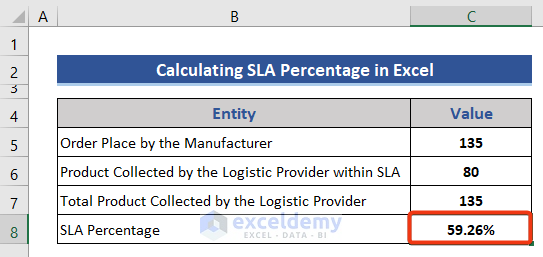
The SLA percentage is displayed.
Download Practice Workbook
Download this practice workbook to exercise.
Related Articles
- How to Calculate Error Percentage in Excel
- How to Calculate Cumulative Percentage in Excel
- How to Calculate Mean Percentage Error in Excel
- How to Calculate Remaining Shelf Life Percentage in Excel
- How to Calculate Percentage of Completion in Excel
- How to Calculate Percentage of Budget Spent in Excel
- How to Calculate Utilization Percentage in Excel
- How to Calculate Absenteeism Percentage in Excel
- How to Calculate Savings Percentage in Excel
- How to Calculate Productivity Percentage in Excel
- How to Calculate Variance Percentage in Excel
- How to Calculate Accuracy Percentage in Excel
- How to Calculate Grade Percentage in Excel
- How to Calculate Win-Loss Percentage in Excel
<< Go Back to Percentage Formula Examples | Calculating Percentages | Calculate in Excel | Learn Excel
Get FREE Advanced Excel Exercises with Solutions!
