Excel is the most widely used tool for dealing with massive datasets. We can perform myriads of tasks of multiple dimensions in Excel. Especially when it comes to summarizing data, there is no alternative to Excel. In this article, I will explain 5 easy ways in Excel to summarize data by multiple columns.
How to Summarize Data by Multiple Columns in Excel: 5 Easy Methods
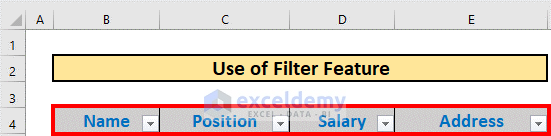
This is the dataset for today’s article. We have some employees along with their positions, salaries, and addresses. I will summarize this dataset.

1. Use Filter Option to Summarize Data by Multiple Columns
The first method to summarize data by multiple columns is the use of the Filter feature. You can use this feature and filter your data to get a summary based on multiple columns. Let’s do it step by step.
Steps:
- First of all, select the columns.
- Then, go to the Data tab.
- After that, select Filter.

- Excel will add a drop-down box to each column.
- Now, you can summarize your dataset.
- Suppose you want to find out the employees who are Content Developer and live in Paris. To find out them,
- Select the drop-down box of the Position.

- Then, select Content Developer from the list.
- After that, click OK.

- Excel will show all the employees who are Content Developer.

- Now, in a similar fashion, filter Paris from the Address column.
- Then, press OK.

- Excel will get you summarized data based on the columns Position and Address.

Read More: How to Summarize Text Data in Excel
2. Create an Excel Table to Summarize Data by Multiple Columns
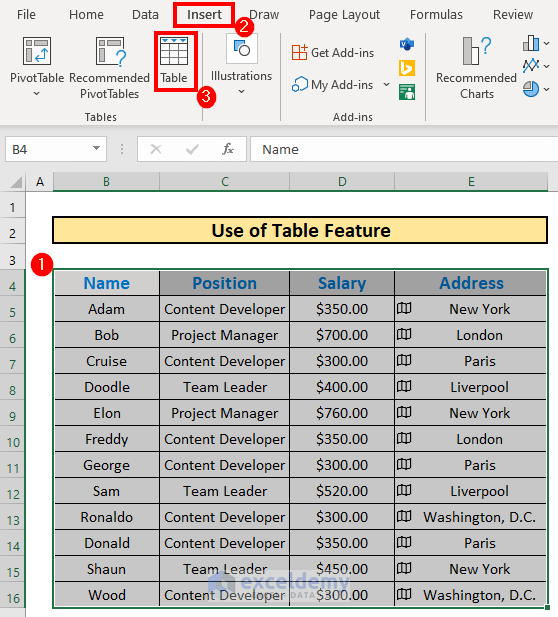
Now, I will explain another way to summarize data in Excel. This time, I will show how you can create a table and summarize data.
Steps:
- First of all, select the entire dataset B4:E16.
- Then, go to the Insert tab.
- After that, select Table.
- Create Table box will appear.
- Check the box if your table has headers.
- Then, press OK.

- Excel will create a table. You will see the drop-down boxes in the headers.

- Now, you can summarize the data following method-1.

Read More: How to Make Summary in Excel From Different Sheets
3. Apply Slicers Feature to Summarize Data by Multiple Columns
In this section, I will show you how to apply Slicers and get summarized data in Excel.
Steps:
- First, create a table following method 2.

- Then, go to the Table Design. This tab will appear when you select any cell inside your table.
- After that, select Insert Slicer.

- Insert Slicers box will pop up. Choose the slicers.
- Then, click OK.

- Position and Address slicers will appear.
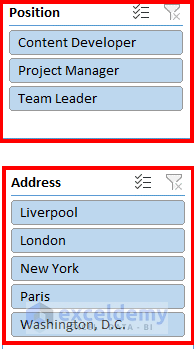
- Suppose you want to find out the Team Leaders from Liverpool. Then, choose them from the slicers.

- Excel will return the list.

Read More: How to Summarize Data Without Pivot Table in Excel
4. Create a PivotTable to Summarize Data by Multiple Columns
Now, I will show another effective method to summarize data in Excel. This time, I will create a Pivot Table and summarize the dataset.
Steps:
- First of all, select the dataset.
- Then, go to the Insert Tab.
- After that, select PivotTable.
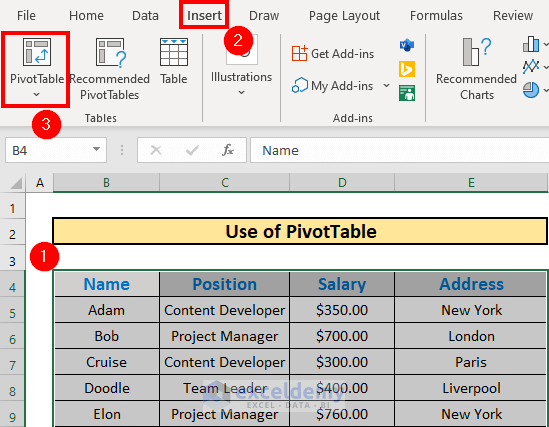
- Excel will create a Pivot Table.

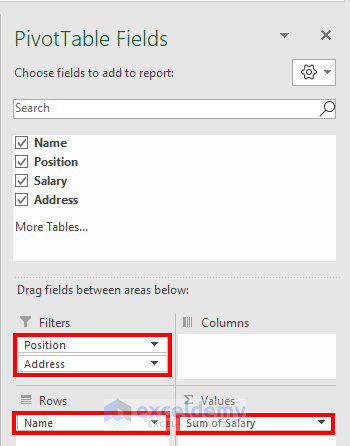
- Now, drag Position and Address in the Filter field, Name in the Row field, and Salary in the Values Values field will automatically show the sum of Salary.
- Excel will edit the Pivot Table.

- Now, you can filter the Position and Address to summarize the data.

Read More: How to Create Summary Table in Excel
5. Apply Conditional Formatting to Summarize Data by Multiple Columns
Now, I will show how to apply conditional formatting to summarize data by multiple columns. You have to insert a customized formula for this purpose.
Steps:
- Select the range B5:E16. Do not select the Headers.
- Then, go to the Home tab.
- After that, select Conditional Formatting.
- Finally, choose New Rule.

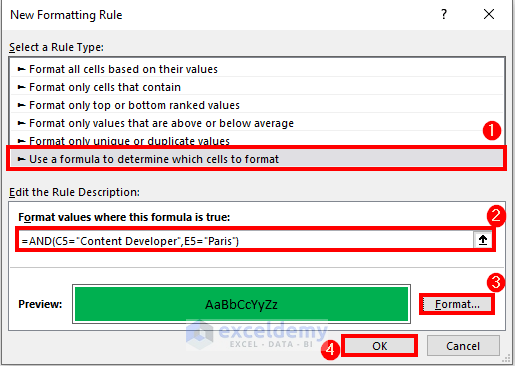
- New Formatting Rule box will appear.
- Select “Use a formula to determine which cells to format”.
- After that, write down the following formula
=AND(C5="Content Developer",E5="Paris")- Then, set the format of the cells.
- After that, click OK.
- Excel will format the cells.

- After that, activate the Filter feature following method-1.
- Then, select the drop-down of the Name column.
- After that, select Filter by Color.
- Then, choose Green.
- After that, click OK.
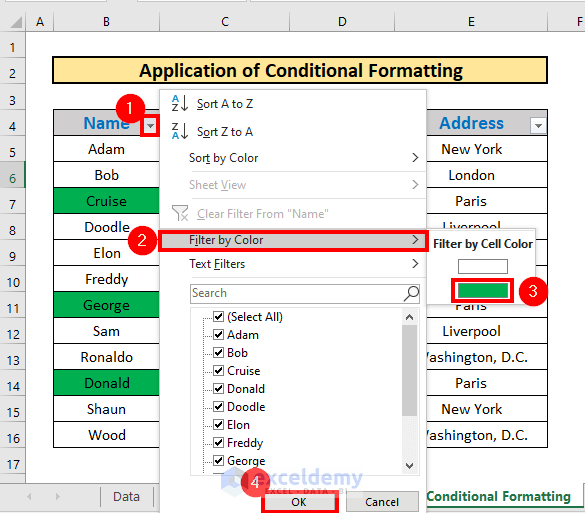
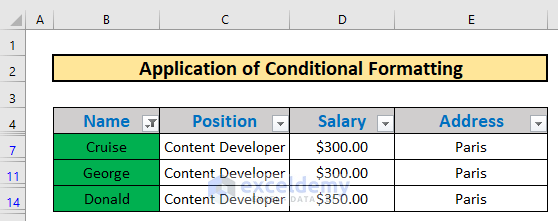
- Excel will get you the names.
Read More: How to Create Summary Table from Multiple Worksheets in Excel
Things to Remember
- Press CTRL+T to create a table in the shortcut.
- Do not select Headers in Conditional Formatting.
Download Practice Workbook
Download this workbook and practice while going through the article.
Conclusion
In this article, I have explained 5 ways in Excel to summarize data by multiple columns. I hope this helps everyone. If you have any suggestions, ideas, or feedback, please feel free to comment below.
Related Articles
- How to Summarize Subtotals in Excel
- How to Summarize a List of Names in Excel
- How to Group and Summarize Data in Excel
- How to Create a Summary Sheet in Excel
<< Go Back to Summarize Data In Excel | Data Analysis with Excel | Learn Excel
Get FREE Advanced Excel Exercises with Solutions!

Thank you for your useful information.i have a table it’s row is animal names found in different columns of geographic coordinates. Sometimes in one corrdinate or column I have many animals. How can make a summary table contain only three columns that show me at one repeat ed coordinate for example have many animals.thank you in advance