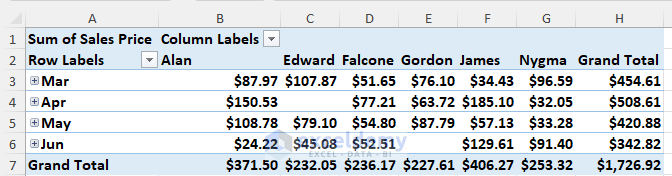
In this sample dataset there is sales data for a few products and the vendors that sold them in the months of March, April, May, and June. To ...
Summarizing the subtotals in Excel helps us to understand the overall output and group-based output at a time that would take a lot of time if we ...
Sometimes we have to make a summary from different sheets of a workbook in Microsoft Excel. It is frequently used in schools, companies, and shops ...
Consider an Excel workbook that contains 4 worksheets named Level-1, Level-2, Level-3 and Level-4, respectively. Each worksheet contains a dataset ...
The following dataset contains three months: January, February, and March, and products for three months. Let's see how to group the dataset by month ...
Method 1 - Using the 'Remove Duplicates' Command Steps: Copy the ‘Sales Rep’ column and paste it below ‘Output’. To remove ...
Let's use a summary of the Covid-19 epidemic between 2020 and 2022 as our sample dataset. Method 1 - Using UNIQUE and SUMIFS ...
The dataset showcases Products and their Groups. To summarize all products: Step 1 - Create a Pivot Table Select the whole dataset ...
Excel is the most widely used tool for dealing with massive datasets. We can perform myriads of tasks of multiple dimensions in Excel. Especially ...
The sample dataset shows trip spending for five people, with repeated entries in the Participants column indicating they had multiple ...
Advanced Excel Exercises with Solutions PDF