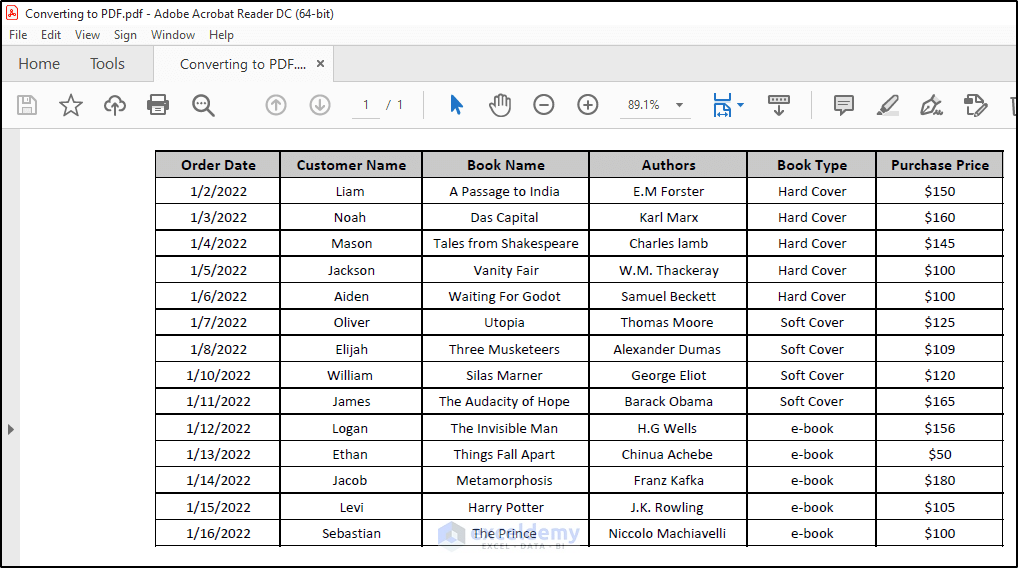
Method 1 – Converting to PDF
If you want to prevent other people from changing your data, convert your spreadsheet to PDF and send it out. Converting Excel documents to a PDF file is simple, and all current versions of Excel can do it without the need for additional software.
Method 2 – Using the Fill Function
You need to keep 12 months of complex accounts in one workbook. You have created 12 sheets and named them from January to December, laid out and formatted the January sheet, and then copied and pasted the spreadsheet to the other 11 sheets.
This is a tedious method, and if the data is pasted incorrectly, it may even prevent you from quickly generating a summary sheet later on. In fact, the best method for doing this is to use Excel’s “Fill Across Sheets” tool. Using the Fill function will allow you to duplicate one sheet across many others quickly and accurately.
Method 3 – Using Named Ranges
We have a formula here that sums the total of three different ranges on three separate sheets:
=SUM(‘Jan Sales’!$D$10:$L$10, ‘Feb Sales’!$D$10:$L$10, ‘Mar Sales’!$D$10:$L$10)And another one that does the same thing:
=SUM(JanTotal, FebTotal, MarTotal)Master Excel Formulas & Functions in Just 3.5 Hours!
with my FREE COURSE at Udemy.
Excel Formulas and Functions with Excel Formulas Cheat Sheet!
The second formula makes use of the so-called named ranges. Named ranges (or defined names) apply to a single cell or a range of cells and, as you can see in the formula, can be used as a direct replacement for the cell or range address.
Named ranges are also intrinsically absolute, so there is no need for dollar symbols to anchor refs. Named ranges are also, by default, global – so when you create a named range on one sheet, you can use that name on any other sheet, and it always refers back to its original location.
Method 4 – Formatting a Dataset
Once you’ve created your spreadsheet, you will do either of two things: enter data or review data. Neither of these things is helped by a proliferation of fonts, sizes, and colors.
To make your spreadsheet easier to understand, try to pick one font and stick with it. Use emphasis (bold or italics) to highlight differences between headers and data and use light cell coloring to pick out summary rows and formulas.
Leave all the formatting until later. A working spreadsheet with no formatting may not look good, but it works. An unfinished spreadsheet that looks fantastic is, however, useless.
Method 5 – Choosing the Right Layout
It may seem obvious, but many people just open Excel, start typing, and hope for the best. You need to do a little planning before you dive in and start creating a spreadsheet. We tend to understand the data that we need to enter into the spreadsheet but give little thought to what we want to get out of it.
Think carefully about what you hope to get out of the spreadsheet and ensure that you lay it out in a way that will achieve this.
Method 6 – Protecting Your Work
You have gone through a great deal of trouble designing the perfect spreadsheet, so the last thing you need is someone opening it and accidentally overwriting a formula or changing something they are not supposed to change. This is where protection comes in.
Excel has great tools for protecting your work and controlling what your users can change. You can protect formula cells to prevent them from being changed, prevent columns or rows from being resized, or even prevent the user from changing the structure of the workbook by adding or deleting sheets. At an advanced level, you can only allow certain users to edit particular regions.
Method 7 – Using Keyboard Shortcuts
Here’s a list of common shortcuts.
| Keyboard Shortcut | Function |
|---|---|
| Ctrl + * | Expression is that text string or cell value that we want to format according to our needs. |
| Ctrl + Space | This is our desired cell formatting. |
| Shift + Space | Select the current row |
| Ctrl + 0 | Hide the current column |
| Ctrl + 9 | Hide the current row |
| F4 | Apply absolute refs (in a formula) |
| F3 | Shows the name box (in a formula) |
| Ctrl + : | Enter the current date |
| Alt + = | Auto-sum the adjacent data |
Method 8 – Saving Time with Auto-fill
Just enter a formula and need to use the same thing in adjacent cells? Instead of typing the formula again, you can use auto-fill. Auto-fill allows you to quickly copy the values from one cell to many adjacent cells, either vertically or horizontally.
And it doesn’t just work with formulas, either. You can use auto-fill to quickly create lists of days and months or even create your own lists. Auto-fill will also automatically increment dates and numbers for you, saving you lots of time.
Method 9 – Analyzing Large Data Sets
One of Excel’s main tasks is to organize data, and with the new versions of Excel able to handle over a million rows, you can have a lot of data. And when you need to get answers to complex questions from this data, it has all the tools you need.
Pivot tables can be scary to the uninitiated. Still, once you understand how they work, you will quickly see how easy they can be and how useful they are at summarizing and organizing data. And all this with just a few clicks!
Method 10 – Customizing the Ribbon
It can be irritating to switch from one tab to the other to find the commands you want to use. The good news is that since Excel 2010, we have been able to customize the ribbon. You can add your own custom tabs and then drop a selection of the commands you use most frequently, including macros, onto it.
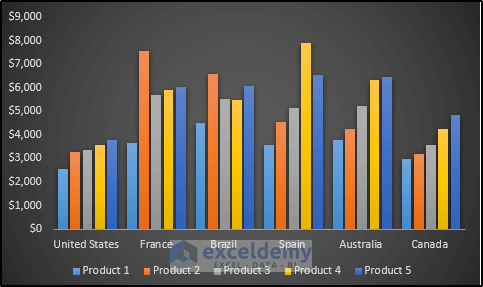
Method 11 – Creating Charts
Your boss doesn’t want to see a table full of data for the past year’s sales; they want to see trends, the number of products sold each month, or the average customer evaluation results in graphical form.
Graphs and charts can be pretty complex if you want them to be, but a basic chart can be produced in literally a couple of clicks, and the latest versions of Excel make it very easy to try out different charts and formats as well.
Method 12 – Using Array Formulas
Array formulas are the answer if you need to do calculations on multiple ranges and don’t want to go to the trouble of adding lots of redundant columns. They can be pretty complex and impenetrable, but they can also save you lots of time and, as a bonus, impress your colleagues.
Method 13 – Using Custom Views
How often have you carefully set up a spreadsheet for printing, got the page breaks just right, scaled it correctly, added headers and footers, and then had to change it again to print out a different region? It can be frustrating to set up a spreadsheet for printing repeatedly, and this is where custom views can help.
A custom view records all of your current print settings and allows you to re-apply them instantly at a later stage. In addition to print settings, it can record filters and hidden rows and columns.
Method 14 – Grouping and Outlining
If you have a lot of columns or rows on your spreadsheet, it can be a bit of a chore constantly scrolling left and right or up and down to get to the point where you want to be, only to have then to go back to where you started. Grouping and outlining can help by instantly allowing you to expand and collapse several rows or columns. It’s like a super hide/unhide feature, and once you understand it, it’s very easy to apply.
Method 15 – Locking Headers
How often have you found yourself on row 987 of your spreadsheet only to realize that you can’t remember what the values in the columns are? This is a common problem, especially when working with several columns with similar values.
The answer to this problem is to lock or freeze your header row or columns. Excel makes it very easy to ‘freeze’ the top rows or first column of your spreadsheet, so the headers will always be visible as you scroll.
Method 16 – Automating Complex Tasks with Macros
Macros are an incredibly useful and powerful tool in Excel. With macros, you can make Excel do things that it can’t do already or take those tasks that take you an hour to complete and do them in a couple of seconds.
Although macros can be very complex and the programming side can take a bit of learning, it is possible to create useful and time-saving macros without knowing anything about programming. Here’s Exceldemy’s complete step-by-step guide on Excel VBA.
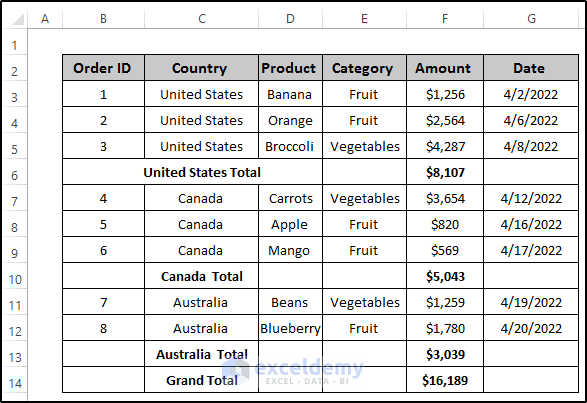
Method 17 – Automating Sub-totals
One of the most common tasks in Excel is to add subtotals to a column of values. If you have a sheet full of sales data and want to show how much of each product was sold, you could insert new rows after a group of products, sum the values above, and then repeat the process for each product.
I have encountered people who spend hours each month doing just that, which is a huge time-waster. The sub-totals tool will do the same job in seconds, and when you’re finished, it can also remove the totals just as quickly, leaving your spreadsheet exactly as it was.
Method 18 – Filtering Data
When dealing with large data sets, you often only need to look at a particular subset of that data. Rather than searching for the data by scrolling up and down, the smart solution is to filter your database.
Filtering using auto-filter is quick and easy and allows you to get the data you are interested in in an efficient way. Recent Excel versions also have many pre-set filters to find text, numbers, and date ranges quickly.
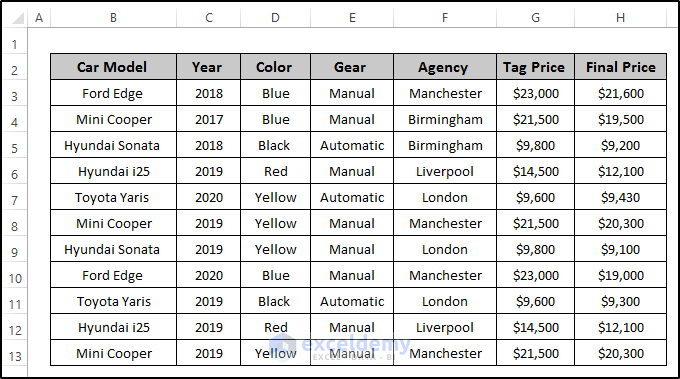
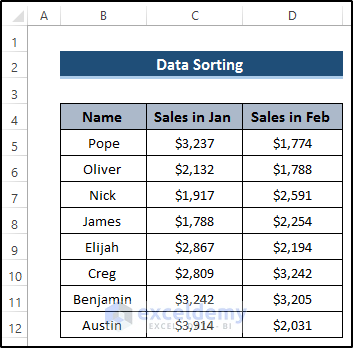
Method 19 – Data Sorting
You can sort your data in ascending or descending order. While sorting, check whether the sorting is correct or not. For basic sorting, we can use A to Z sorting, which means lowest to highest, and Z to A sorting, which means highest to lowest.
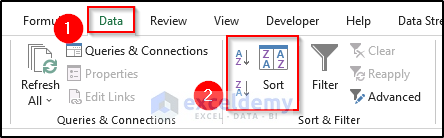
After clicking the Sort option, you will see the following three options.
- Sort by: it denotes the column which is the base of sorting.
- Sort On: This section provides you with four different options: cell values, cell color, font color, and conditional formatting icon.
- Order: In this section, you can get three options: ascending order, descending order, and custom list.
When you utilize the ascending order, you will get the following result where the data is sorted from A to Z.

When you utilize the descending order, you will get the following result where the data is sorted from Z to A.
Method 20 – Using a Pivot Table
The pivot table is one of the most valuable assets in Excel. This illustrates the best possible ways to analyze data. Using the pivot table, you can prepare a summary of a large dataset.
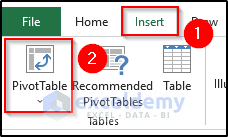
To create a pivot table, select the range of cells. Go to the Insert tab on the ribbon. From the Tables group, select the Pivot Table.
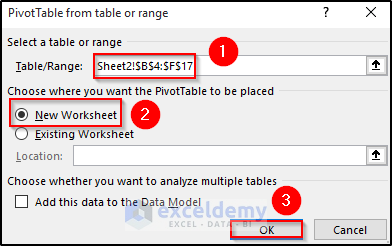
You will get the PivotTable from table or range dialog box where you need to select the range of cells or the range of cells may appear automatically if you select it before applying the pivot table. Choose the place where you want to put your pivot table. Click OK to apply.
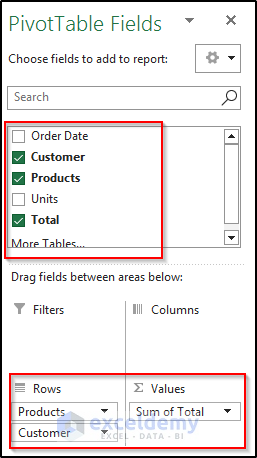
The PivotTable Fields will appear, where you can select the fields through which you want to create the pivot table.
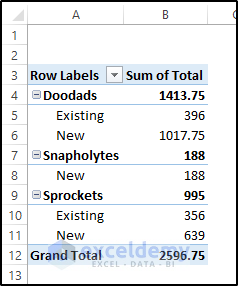
You will get the required pivot table that summarizes the large dataset and provides a well-established summary. The pivot table is one of the most valuable Excel skills in your day-to-day life.
Method 21 – Learn to Use SUMIF/SUMIFS Functions
Sometimes we may need to apply conditions or criteria when calculating the summation of some numbers. MS Excel helps us with these problems by providing another powerful SUMIF function. When evaluating the sum of the range of cells under multiple conditions, you need to use the SUMIFS function instead of the SUMIF function. Both of these functions help you to get the sum of a given range of cells.
Method 22 – Learn to Use COUNTIF/COUNTIFS Functions
The COUNTIF function is widely used to count cells with a given condition or criterion. In this function, you need to define the range and criterion. Using these inputs, the function returns the output of the total number of cells that meet the criterion. You can use the COUNTIFS function to count the number of cells satisfying one or more criteria from any range of cells in Excel. This function Returns the total number of values in the array that maintain all the given criteria.
Method 23 – Data Validation
To limit input to a cell or a range, we use Data Validation. This feature is most useful in times of data collection. This ensures the data is error-free. If we want to record the age of Students in a cell range, then we can set the Data Validation to be numerical values only. We can set upper and lower limits for a particular data type, and it will not accept any values beyond that. Excel allows us to enter custom functions to achieve complex conditions using this feature.
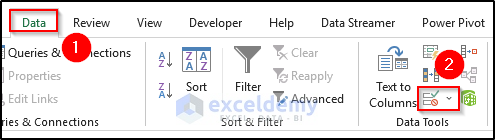
To open data validation, go to the Data tab on the ribbon and select the Data Validation option from the Data Tools group.
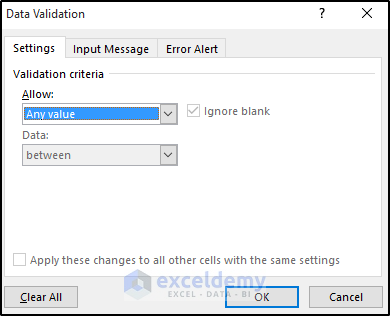
As a result, the data validation dialog box will appear where you can add validation criteria.
Method 24 – Moving Columns to Rows – Transposing
Another important Excel skill is to move the columns to rows. You have data in columns that need to be rotated in rows. Use the transpose feature.
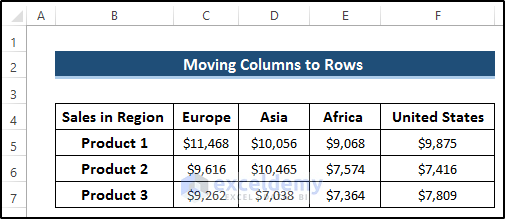
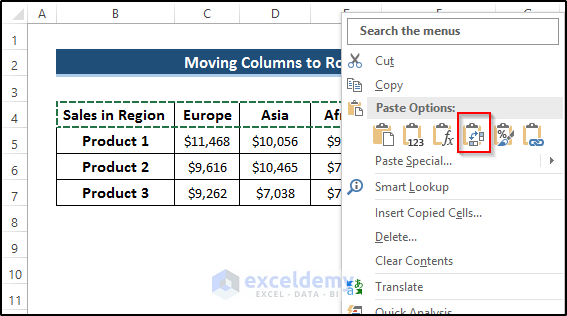
Copy the column headers from cell C4 to cell F4. Select a new cell where you want to paste it as a transposed format. Right-click on a cell, and a Context Menu will appear. Click on the transpose option.
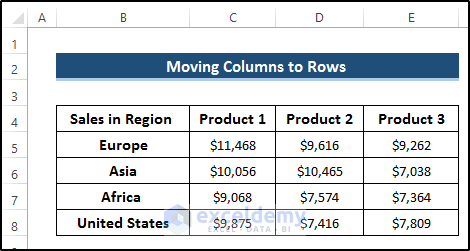
After doing some modifications, we get the following result. See the screenshot.
Method 25 – Using the IF Formula
The IF function is used to check if a condition is met, and then the defined statements will be shown based on the given condition. It will show blank or false. Using the IF formula, you can easily set the criterion, if it meets the criterion then it returns a certain value. It returns another value. You have a dataset that includes the sales target and sales achieved column. By using the IF function, you can set a criterion: if the sales achieved are greater than the sales target, then it returns achieved. It returns not achieved. This function is one of the most essential Excel skills in our day-to-day life.
Method 26 – Apply Conditional Formatting
When you format a cell or more than one cell based on some conditions, that is conditional formatting. For example, you have a dataset in Excel. The dataset has some numbers in some cells. You need to format the cells with a Red background color with values less than zero. The condition part is if the numbers are less than zero, and the format part is to fill those cells with the Red background color. You can do it manually, find out the cells with values that are less than zero, and make their background color Red. Manual formatting is not the worst job if your worksheet has 10-15 numbers; you will use Excel’s conditional formatting feature.
Go to the Home tab on the ribbon to do the conditional formatting. From the Styles group, select the Conditional Formatting drop-down option.
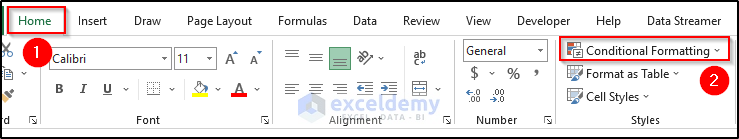
You’ll get several conditional formatting options from the drop-down option. Select your preferred one.

Method 27 – Find and Replace Option
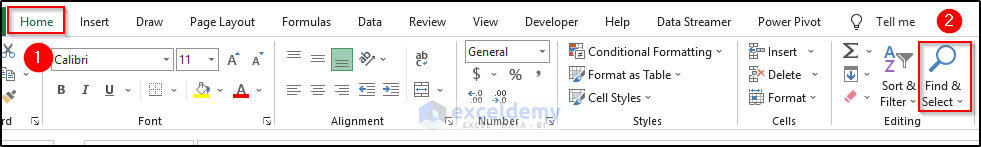
The find-and-replace option is another essential skill in Microsoft Excel. You can find a certain value or text and replace it with a certain value or text on all other worksheets. This skill saves a lot of time because you don’t need to find values manually. Go to the Home tab on the ribbon. Select the Find & Select drop-down option from the Editing group.
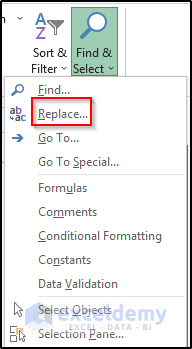
Select Replace from the Find & Select drop-down.
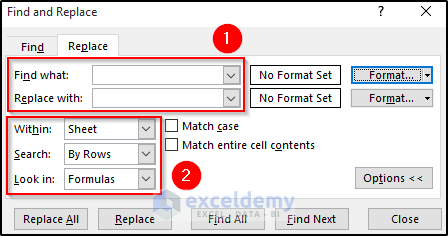
The Find and Replace dialog box will appear. Write what you want to find and what you want to replace it with. Set the search with a sheet or workbook.
Method 28 – Paste Special Option
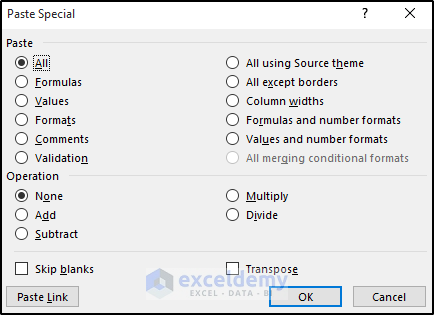
The paste special option is a part of 28 essential Excel skills. This option helps you to get a total command of how you want to paste your values. You have cell values where you applied formulas previously. You want to paste it as a value. The paste special option helps you to solve this issue. Copy the cell values in your dataset. Go to the Home tab on the ribbon. Select the Paste drop-down option from the Clipboard group.
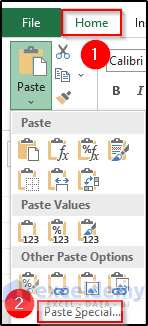
The Paste Special dialog box will appear. Here, you get several paste options and operations. To paste only values, select Values from this dialog box.
Essential Excel Skills for Accountants
While in terms of the accounting sector, Excel skills can be a vital part of the calculation. To be a well-known accountant, you must have some basic Excel skills. You need to know all the previous 28 Excel-related essential skills. Besides those 28 skills, you must master a few more skills to be an accountant.
1 – What If Analysis
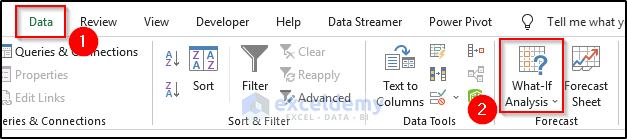
What-if analysis is a process through which you can see the outcome by changing any cell in the dataset. By using the what-if analysis in Excel, you can use several sets of values and get the desired outcome. In the what-if analysis, you can calculate several houses’ total expenses and select your preferred house. Using the what-if analysis, you can establish a proper overview of all types of things and also denote how they react in the future.
The main purpose of the what-if analysis in Excel is to determine the outcome in a statistical mood and assess the risk. The main advantage of using what-if analysis in Excel is that there is no need to create a new worksheet but we can get the final results for different inputs. There are three types of what-if analysis in Excel: Scenario, Goal Seek, and Data Table. The scenario and data table take the input values and provide the possible outcome using these inputs. To get the What-If Analysis in Excel, go to the Data tab on the ribbon. From the Forecast group, select the What-If Analysis drop-down option.
2 – Auditing Formulas
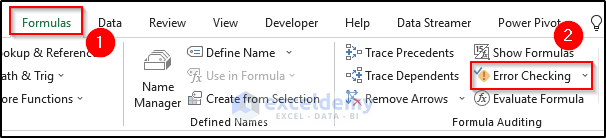
Accountants need to work with a large dataset where they apply several formulas to get the desired results. In a large dataset, it is tough and time-consuming to check all the possible errors. You can use the formula auditing approach through which you can check whole dataset formulas. For small datasets, you can also use formula auditing. Formula auditing is an essential skill for accountants in the long run. To do formula auditing, go to the Formulas tab on the ribbon. Select the Error Checking option from the Formula Auditing group.
3 – Sparkline Charts
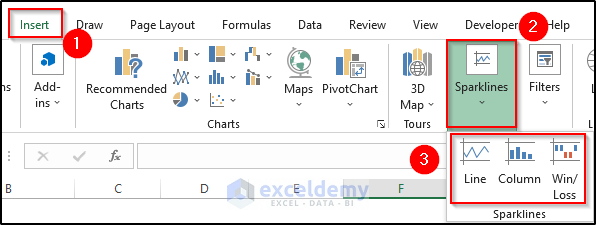
The sparkline chart helps you to embed charts in a cell. It allows consolidating a large amount of data into a single spreadsheet. The sparkline charts can be useful for data analysts and accountants to create a better spreadsheet with valuable information. The sparkline charts can be of three different types: Line, Column, and Win/Loss. You need to select the range of numbers to use the sparkline charts. Go to the Insert tab on the ribbon. Select the Sparklines drop-down option. You can select any of the chart options.
Essential Excel Skills for Data Analysts
To become a data analyst, you have to have some specific Excel-related essential skills through which you can do the job. Before doing anything, you need to cover all the Excel skills that were discussed previously. Those skills are also valuable for a data analyst. After that, you need to cover the following skills also.
1 – VLOOKUP Function
The VLOOKUP function can be a valuable asset for the data analyst. In the function, the lookup value can be a single value or an array of values. If you enter an array of values, the function will look for each of the values in the leftmost column and return the same row’s values from the specified column. In the case of data analysis, you need to take values from another table, the VLOOKUP function helps to do this.
2 – FORMULATEXT Function
The use of the FORMULATEXT function can be another useful skill, you need to learn as a data analyst. As a data analyst, you need to work with lots of data where you have to utilize numerous formulas. After finishing the task of checking the formula of a certain cell, in that case, the text formulas can be vital.
3 – TRIM Function
While dealing with lots of data, sometimes you may face problems with having extra space. In that case, you have to use the TRIM function. The Excel TRIM function is categorized under the TEXT functions. It removes the extra spaces from a text string. It saves valuable time. Otherwise, you need to do it manually. Because of this extra space, the calculation can be different. So, the TRIM function is vital for a data analyst.
4 – CONCATENATE Function
In data analysis, you need to split values from one cell to another cell. After completing the task, if you want to combine those values into one text value, the CONCATENATE function helps you to do so. It joins two or more text values or numbers into one single text value. That is why using this Excel function is essential for any data analyst.
5 – LEN Function
When you need to count the characters in cells, you need to utilize the LEN function. This function returns a number of characters in a text string. If any data analyst needs to count the character in one cell or multiple cells, he/she needs to use the LEN function effectively.
6 – LEFT/RIGHT Function
When you take data from different sources, these data aren’t ready for analysis. The data analysts spend most of their time clearing data. By default, Excel calculates formulas from left to right. The LEFT function helps to pull a set of numbers from the left and the RIGHT function does the opposite.
7 – Add Slicer in Pivot Table
The slicer helps to filter the pivot table and makes an excellent report. The data analysts use several slicers to filter several pivot tables and finally, provide a meaningful output. Slicers help to take your dataset to the next level through their unique functioning. That is why it is an essential Excel skill for data analysts.
8 – IFERROR Function
Data analysts use the IFERROR function to handle and eliminate errors from the given formulas. IFERROR is categorized under the Logical functions in Excel. It returns an alternate value if a formula results in an error. It helps data analysts with various problems while dealing with a big dataset.
Essential Excel Skills for Business Analysts
To become a business analyst, you need to have several Excel-related skills through which you can do the job properly. You need to adapt all the possible Excel skills that we discussed previously. After that, you can focus on the following essential Excel skills.
1 – Excel File Format
While using the Excel file, you may experience some file format-related issues. Some tools only take CSV files. Some clients may not accept macros Excel workbooks. In that, you need to be careful about the Excel file format which is one more preferable compared to others. Otherwise, you may face misunderstandings with customers.
2 – Visualize Patterns in Data
One of the biggest roles of a business analyst is to visualize patterns in data. Then, provide an optimum decision that is good for both customer and their own business. To visualize patterns in the data, you need to have a profound knowledge of Excel commands and Excel functions. All of these combine with you a better business analyst and help you to make correct decisions.
3 – Understand Industry Specific Functionalities
To become a well-known business analyst, you need to understand industry-specific functionalities such as NPV, PMT, IRR, etc in Excel. Otherwise, you can’t figure out what you need to do in some specific condition. The business analyst should be capable of using statistical distribution functions. The overall ability to understand all of these functions will make them better business analysts.


It’s my pleasure Bob. Thanks for sharing.
I have data like 2-feb-17,3-feb-17,4-feb-17,2-feb-17
How can I get the result as 3 by counting only the unique date.
Very nice information Kawser! Excel has always been a mystery box for me. The more I feel familiar with Excel, the more it presented me new formula. There is a non-ending learning on Excel and your blog post give just another opportunity for us to enhance our knowledge in Excel. Thanks for sharing!