If you’re a fitness enthusiast or an expert, the possibility is that you may have heard about the Lactate threshold. The lactate threshold is an indicator of exercise physiology. The lactate threshold determines an athlete’s training intensity zones. So, you need the Lactate threshold analysis to continue the intense exercise. In this regard, Excel offers great scope to analyze Lactate threshold. You may use the DMAX method for the Lactate threshold in Excel. In this article, I’m going to demonstrate how to do so. So to get a clear detailed understanding so that you can analyze it for yourself, follow along with me!
You can get an overview of what we’re going to do in this article from this image.
What Is Lactate Threshold?
First of all, let’s get an idea of what the Lactate threshold means. I’m putting it simple here so that you can understand it properly.
Lactate is a substance that is produced when body cells turn food into energy. So, during exercise, Lactate is produced in the body. The lactate threshold is a measurement of the maximum intensity level of an exercise that you can continue for an extended period of time without increasing your Lactate level. For example, if you’re running at a speed of a maximum of 5m/s without significantly increasing your Lactate level, then your Lactate threshold will be 5m/s or its corresponding Lactate value.
Introduction to Excel Dmax method
The DMAX function in Excel returns the largest number in a field of records in a database that matches your specified conditions.
And our goal is to find out the maximum intensity level of an exercise that changes the Lactate level in a minimum amount. So, our condition will be the change in Lactate concentration minimum(close to 0) and find the largest intensity value of the exercise. From this perspective, we can use the DMAX function to calculate the Lactate threshold.
Again, if we look at the mathematical aspect, we can get the threshold point by plotting an intensity vs Lactate graph. The slope of the curve will be the same as the slope of the straight line that connects the first and last point of the curve. From this concept, we may calculate the Lactate threshold.
DMAX Method for Lactate Threshold in Excel: 2 Effective Methods
From our discussion, it is clear that we can calculate the Lactate threshold using the DMAX method in two ways. We can use the DMAX function directly. Alternatively, we can calculate the Lactate threshold by using a graph and its derivative. I’m going to demonstrate it to you both.
Method 1: Using DMAX Function to Determine Lactate Threshold Point
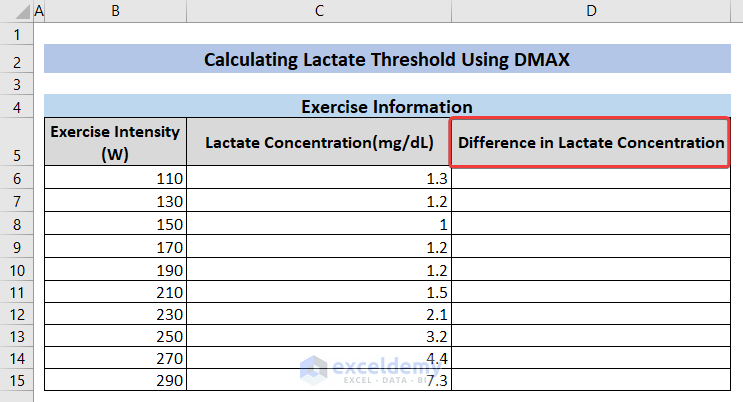
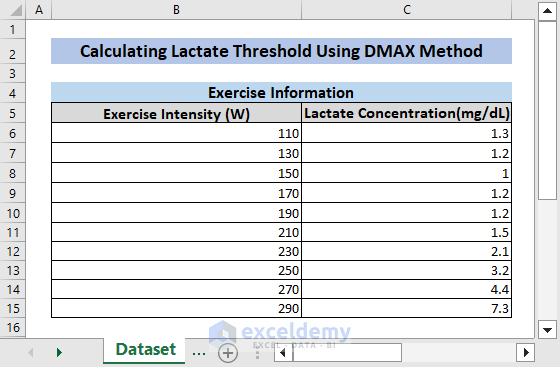
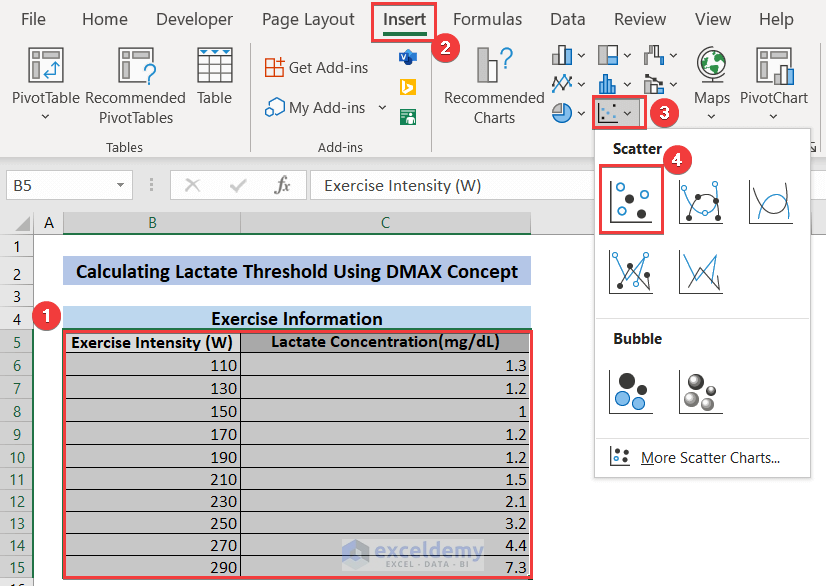
In this method, we’ll use the DMAX function to get the Lactate threshold. Our dataset looks like this:

The dataset contains Exercise Intensity (W) measured in Watts and Lactate Concentration(mg/dL) measured in mg/dL units. We’ll find the Lactate threshold from this dataset.
Steps:
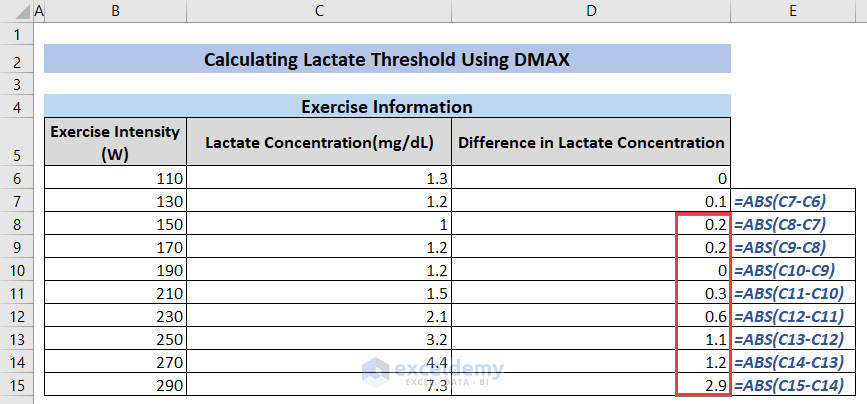
- Create a column named Difference in Lactate Concentration to calculate the difference in Lactate concentration.
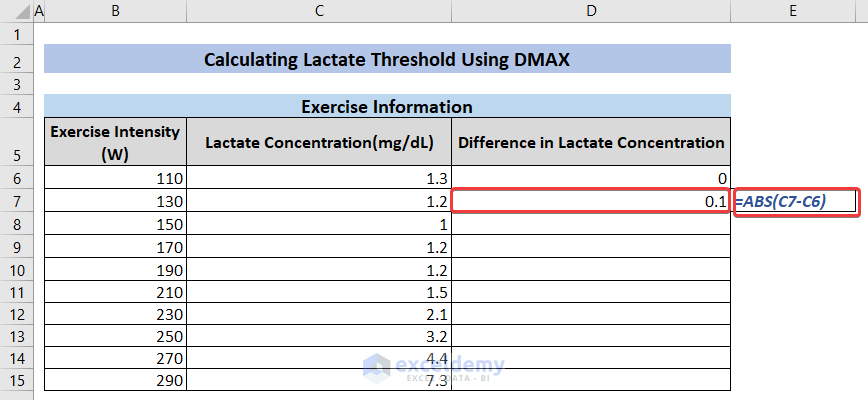
- Now calculate the difference between the first two consecutive Lactate concentrations by using the formula in cell D7 and pressing ENTER.
=ABS(C7-C6)Note that, the difference for the first cell is 0.
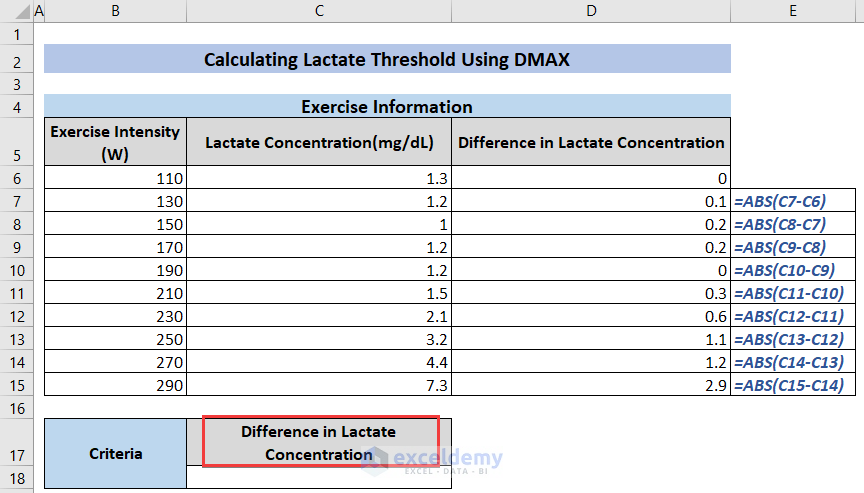
- Now, Double click on the AutoFill Handle
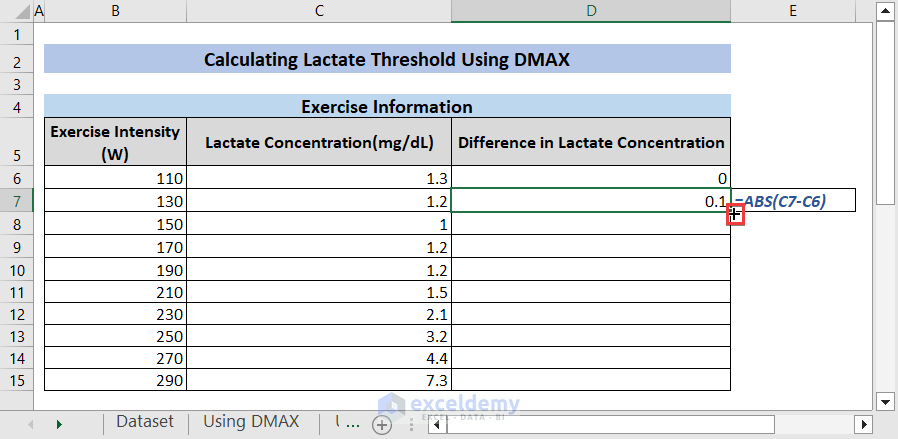
- The output looks like this.
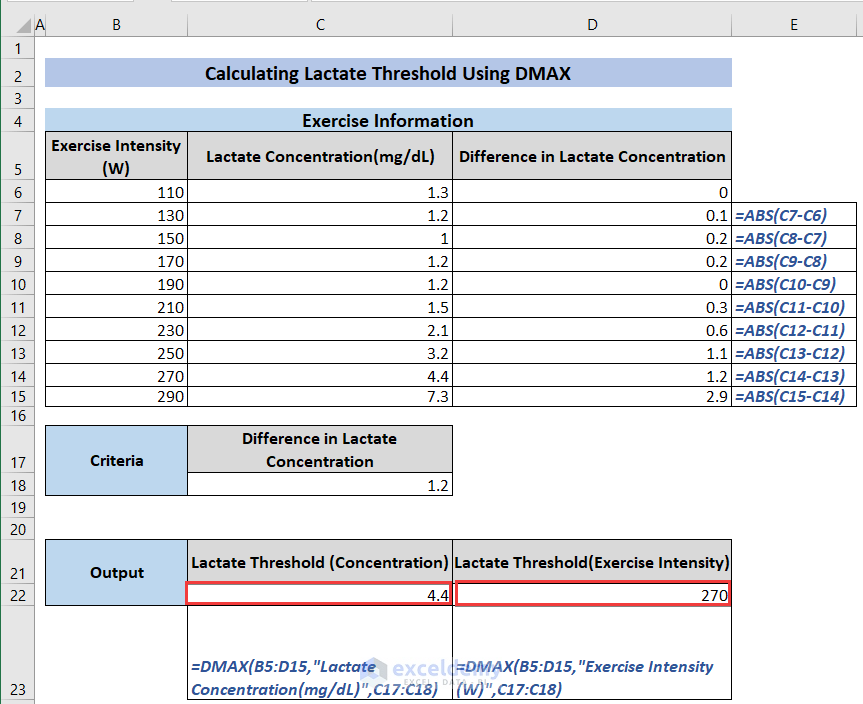
- Now, set the criteria name based on which we’ll use the DMAX formula. Keep it exactly the same as it appears in the dataset. Hence, we’re typing Difference in Lactate Concentration in cell C17.
- Now we’ll set 1.2 as the Difference in Lactate Concentration value in cell C18 to set the criteria. Note that your criteria value may differ.
- Now type the =DMAX(B5:D15,”Lactate Concentration(mg/dL)”,C17:C18) formula in cell C22 and =DMAX(B5:D15,”Exercise Intensity (W)”,C17:C18) in cell D22 and press ENTER to calculate the Lactate threshold. I’ve shown the corresponding formulas below the respective cells so that you can visualize them easily.
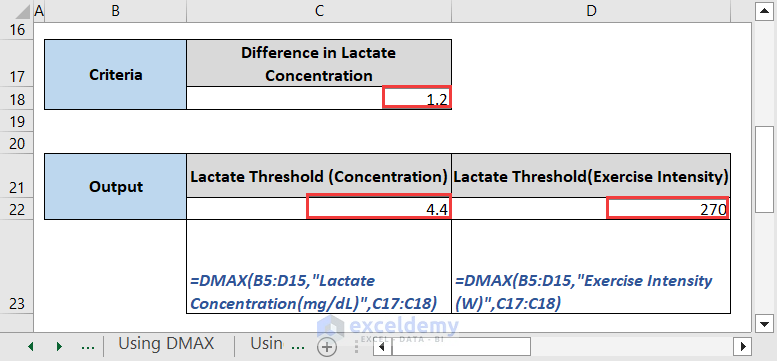
From the image, we can see that the Lactate Threshold in terms of concentration is 4.4 and in terms of Exercise Intensity is 270.
Method 2: Using DMAX Methodology to Find Lactate Threshold in Excel
In this method, we’re going to find the Lactate threshold by using a graph. Note that the method requires basic knowledge of differentiation. So if you just want to avoid differentiation, you may use the first method using the DMAX function.
The core idea of the DMAX method is to get the distance between two parallel straight lines. In this case, the straight lines are – the first is the straight line connecting the first and last data point of the scatter plot and the second straight line is the straight line that is tangent to the curve of the scatter plot.
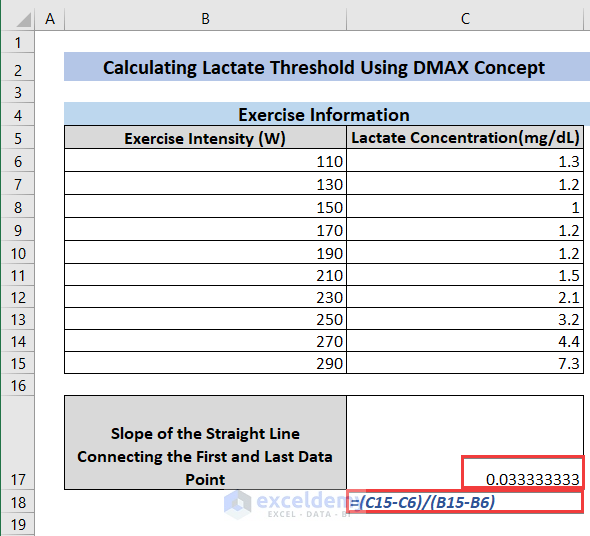
Now, our dataset looks like this.
Step 1: Creating Scatter Plot
Now we’ll create a Scatter Plot using our data. I’m focusing on the key parts of the Scatter Plot here. However, if you are required to review the use of Scatter Plot, you may check the mentioned tutorial. Now, we’ll plot a graph with Exercise Intensity (W) on the x-axis and Lactate Concentration(mg/dL) on the y-axis.
To do so:
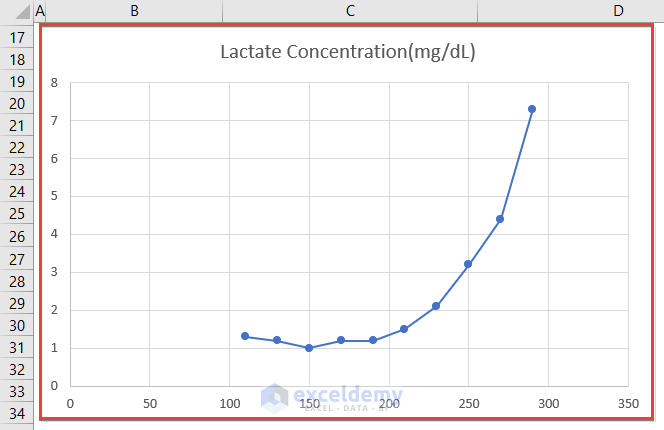
- Select cells B7:C15>>Insert>>Chart>>Scatter.
- The graph will look like this.
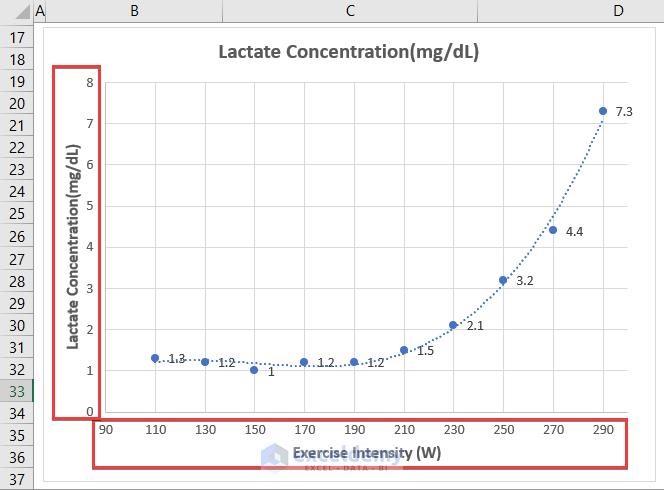
You may adjust the Format Axis and Format Axis Title accordingly. The output is:
Step 2: Adding Trendline
Now, we’ll add Trendline
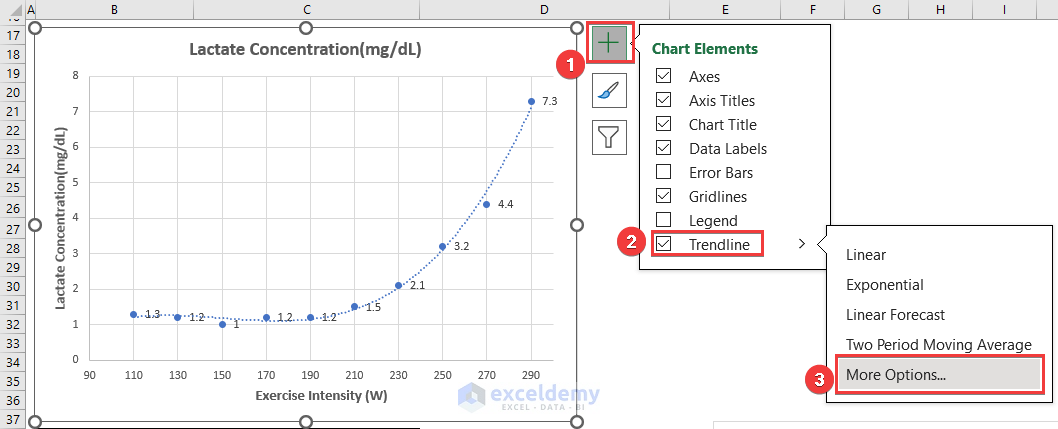
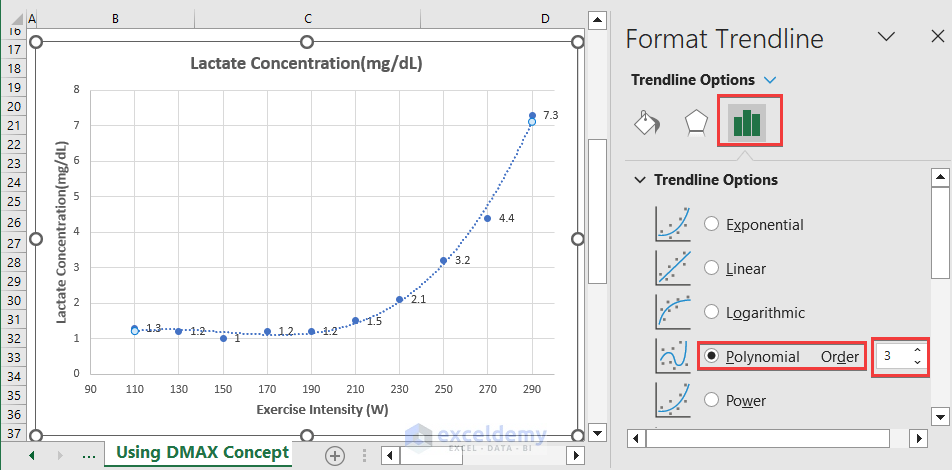
Now, set the Trendline Options to Polynomial Order of 3 to fit the curve.
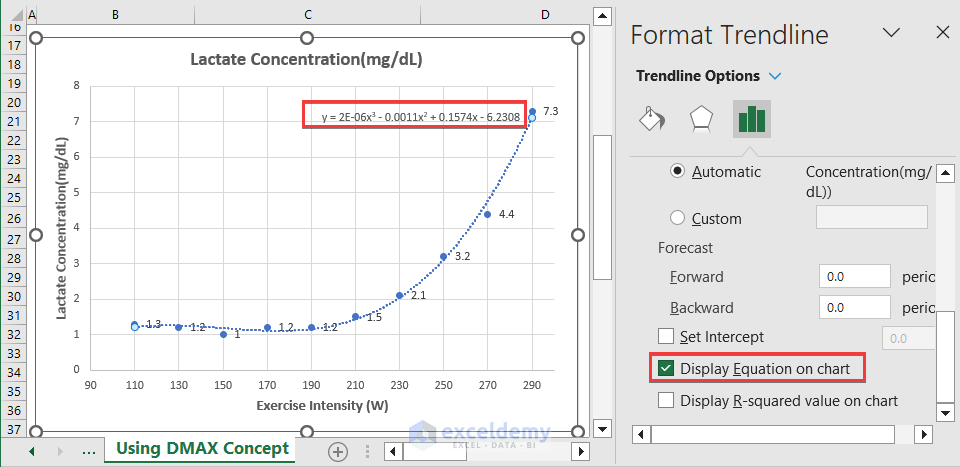
Check the Display Equation on Chart option to display the equation of the trendline.
Step 3: Calculating Derivative for Curve
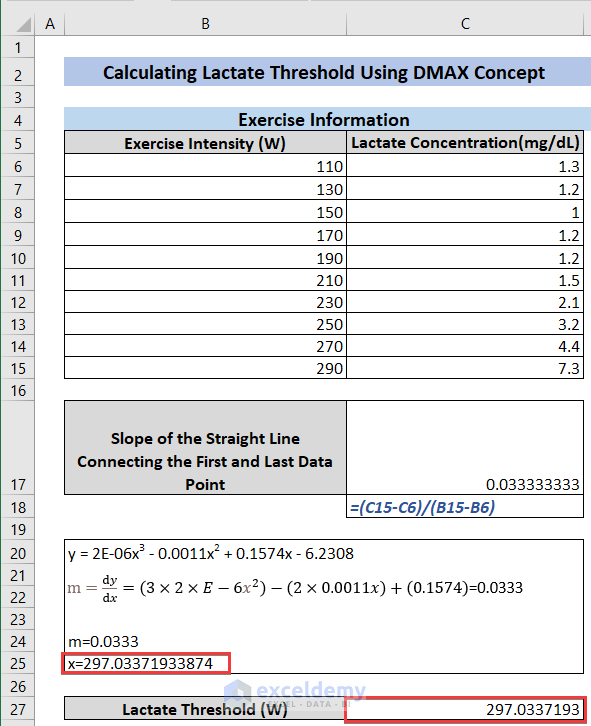
We can see from the image that the equation of the curve is as follows:
y = 2E-06x3 - 0.0011x2 + 0.1574x - 6.2308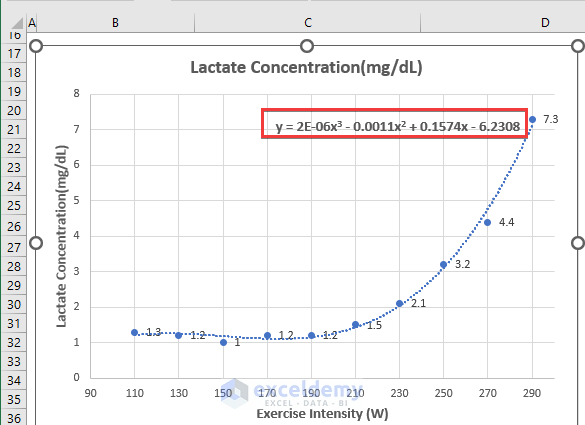
Now, we’ll calculate its first derivative using the first derivative formula.
m=ⅆy/ⅆx=(3×2×E-6x^2 )-(2×0.0011x)+(0.1574)m=ⅆy/ⅆx=(3×2×E-6x^2 )-(2×0.0011x)+(0.1574)Step 4: Calculating Derivative for First and Last Point
Now we’ll calculate the derivative for the first and last data point of the scatter plot. For this reason, type the following formula in cell C17 and press ENTER. I’ve displayed the formula in cell C18 to ease your understanding.
Step 5: Lactate Threshold Calculation
Now the derivatives calculated in Step 3 and Step 5 are equal if they represent two parallel lines. So, equating them, we get the following equation.
m=ⅆy/ⅆx=(3×2×E-6x^2 )-(2×0.0011x)+(0.1574)=0.0333m=ⅆy/ⅆx=(3×2×E-6x^2 )-(2×0.0011x)+(0.1574)=0.0333Solving the equation, we get:
x=297.03371933874This is the highest value of x and this is the Lactate threshold. We can see this in the image here.
Takeaways from This Article
In this article, I’ve demonstrated two effective ways to calculate the Lactate threshold. If you’ve followed the entire process, now you know how to calculate the Lactate threshold using the DMAX method. You can do this by using the DMAX function. Otherwise, you may use the DMAX methodology using Scatter Plot. Note that the latter requires derivative calculation and equation solving.
Things to Remember
While working on DMAX you should remember some facts.
- Keep the name of the criteria the same as it appears in the dataset. To ensure this, you may copy paste it from the dataset.
- Carefully select the trendline that matches your Scatter Plot.
Download Practice Workbook
You can download our practice workbook from here for free!
Conclusion
In this article, I’ve demonstrated the DMAX method to calculate the Lactate threshold in Excel. Calculating the Lactate threshold is a performance indicator. I’ve covered every aspect of calculating the Lactate threshold using the DMAX method in this article. If you’ve followed the entire article thoroughly, I hope you are now able to calculate the Lactate threshold yourself. Having said that, if you face any trouble doing so, please let me know in the comment section. We’ll try our best to provide you with a solution. Have a good day!
<< Go Back to Weight Loss | Formula List | Learn Excel
Get FREE Advanced Excel Exercises with Solutions!
