What Are Pivot Tables and Pivot Charts?
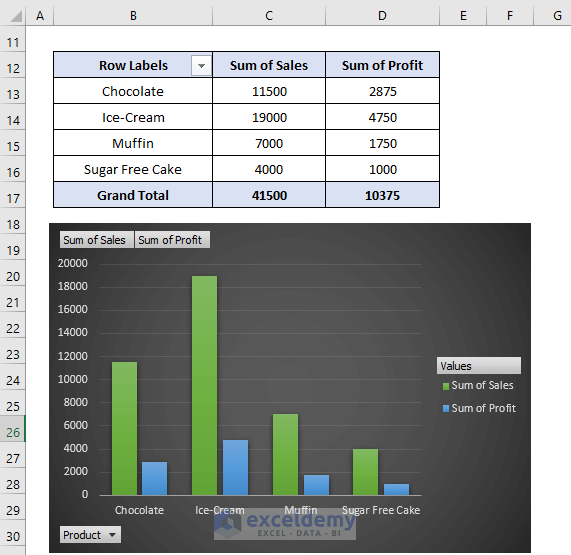
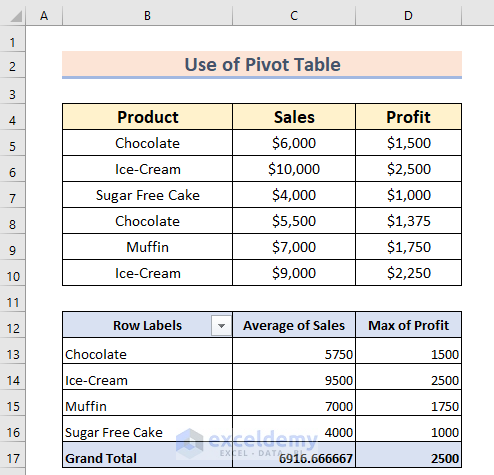
A Pivot Table is a functional table that represents the summary of data collection. On the other hand, a Pivot Chart is the visual presentation of the pivot table.
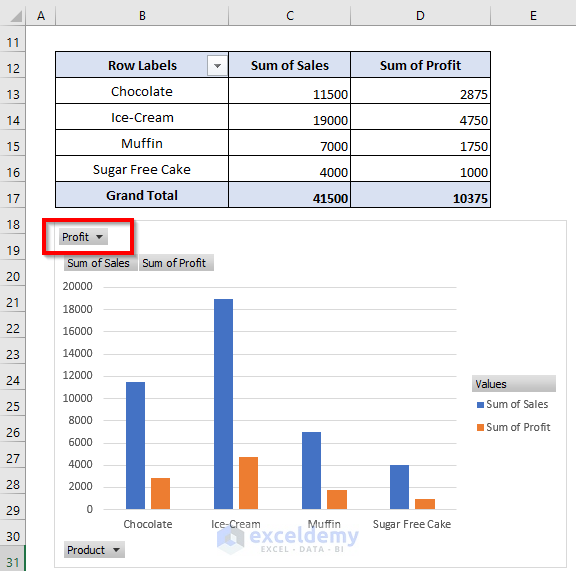
The B12:D17 range represents a pivot table, and the corresponding pivot chart is below it.
How to Create a Pivot Table
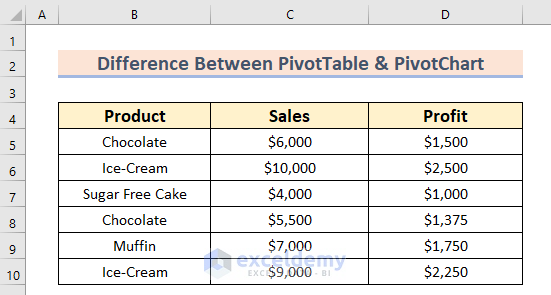
We’ll use the following sample data set.
Steps:
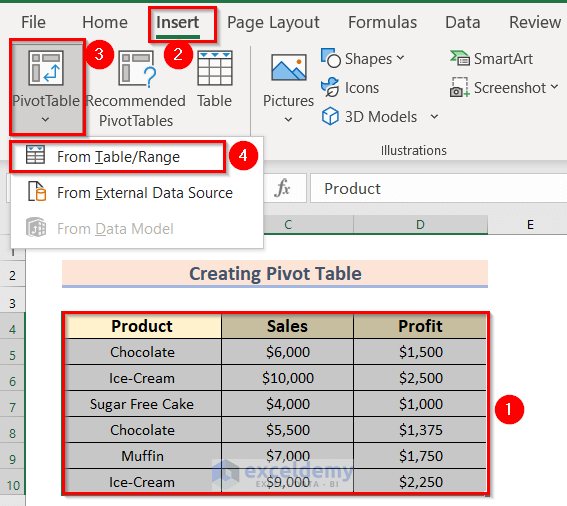
- Select the range you want to put into the table. We have selected the range B4:D10.
- From the Insert tab, choose Pivot Table.
- Select From Table/Range.
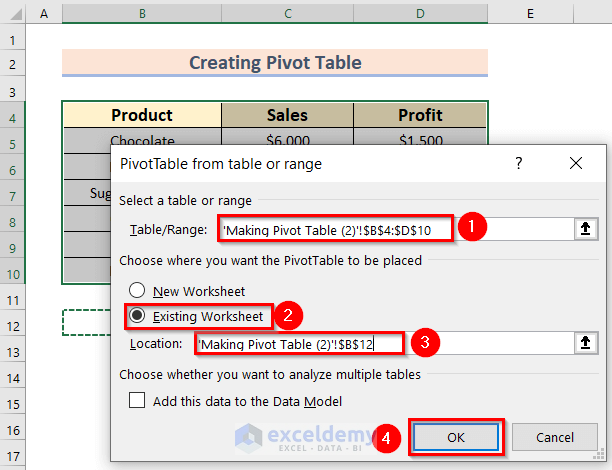
- A dialog box named PivotTable from table or range will appear.
- Select the range for your pivot table, which should be auto-selected.
- Choose Existing Worksheet.
- Select the Location for the PivotTable. We have selected the B12 cell.
- Press OK to get the pivot table.
- You will get a new window.
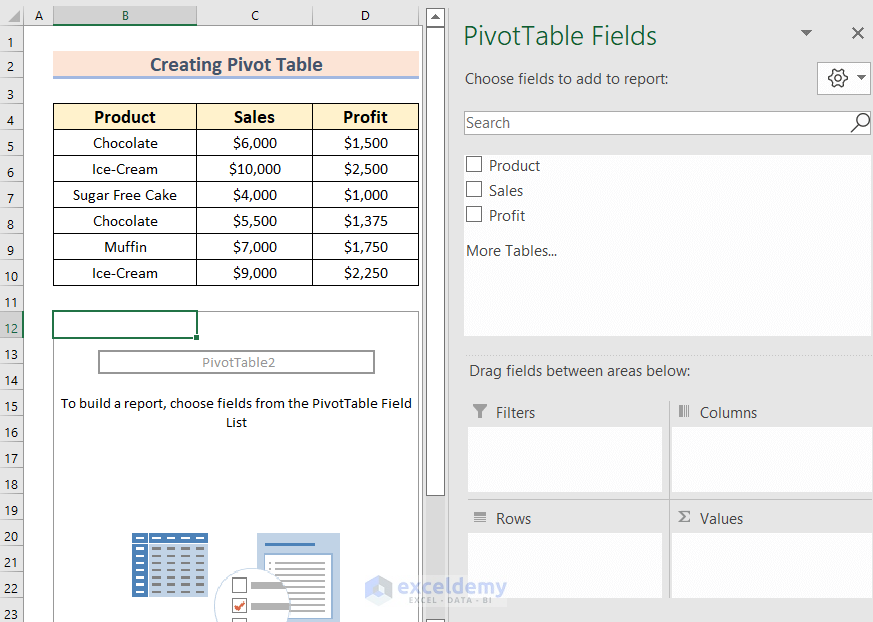
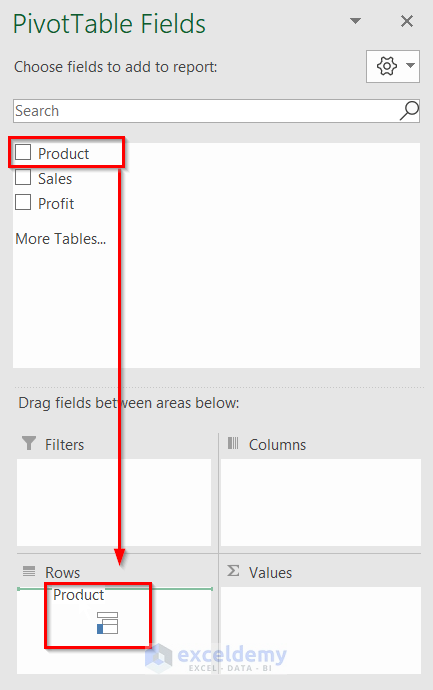
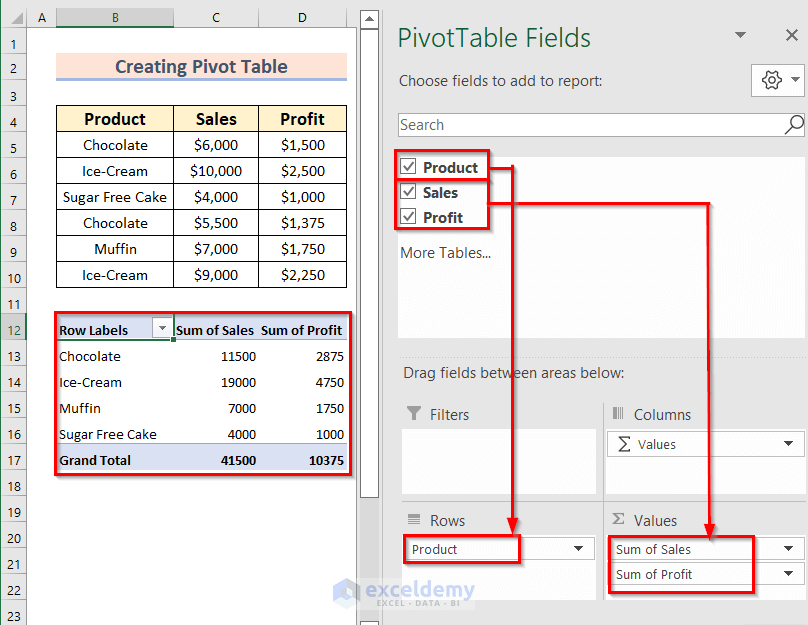
- In PivotTable Fields, drag Product to Rows.
- Drag Sales and Profit to Values.
- Our pivot table is done.
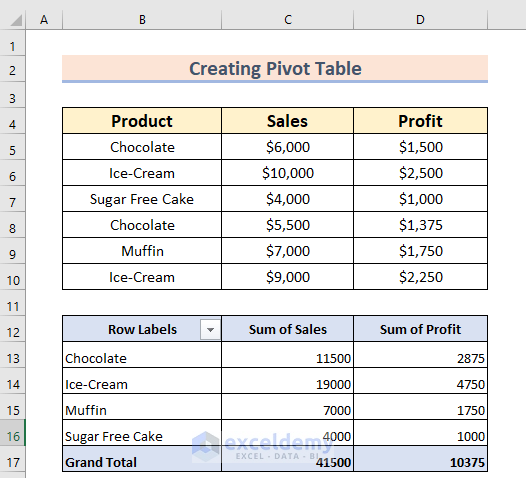
- Here’s the created pivot table.
How to Use a Pivot Table in Excel
- You can sort or filter your data to find out any targeted values.
- You can automatically perform basic array functions such as summing, averaging, calculating subtotals based on category, or multiplying.
- You can group and conditionally format data.
- You can easily transpose the columns.
We’ll change the function from Sum of Sales to Average of Sales and Sum of Profit to Max of Profit.
Steps:
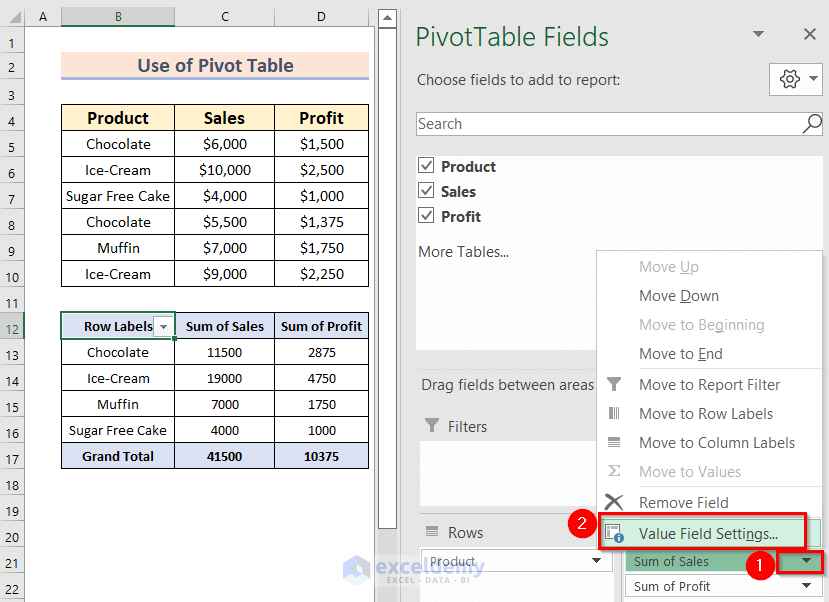
- From PivotTable Fields, click on Sum of Sales.
- Choose Value Field Settings from the Context Menu bar.
- You will see the following dialog box named Value Field Settings.
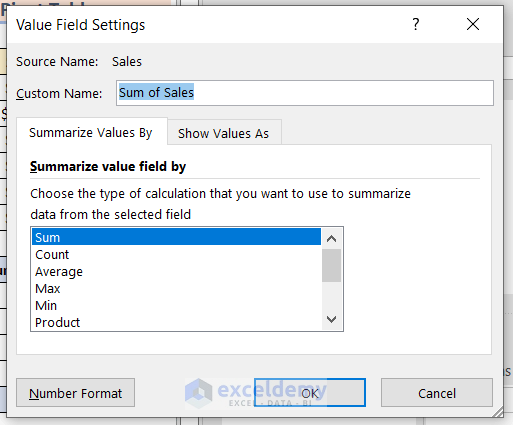
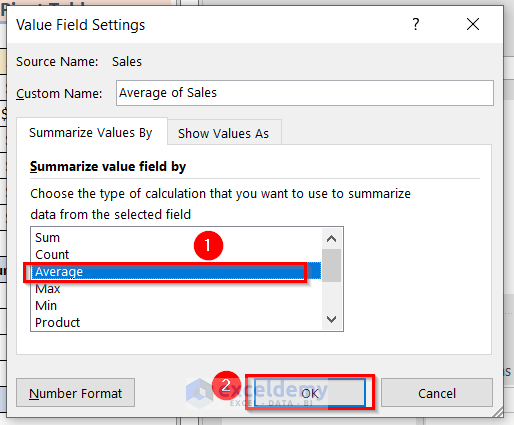
- In the Summarize value field by option, select an operation. We have selected Average.
- Click on OK to see the changes.
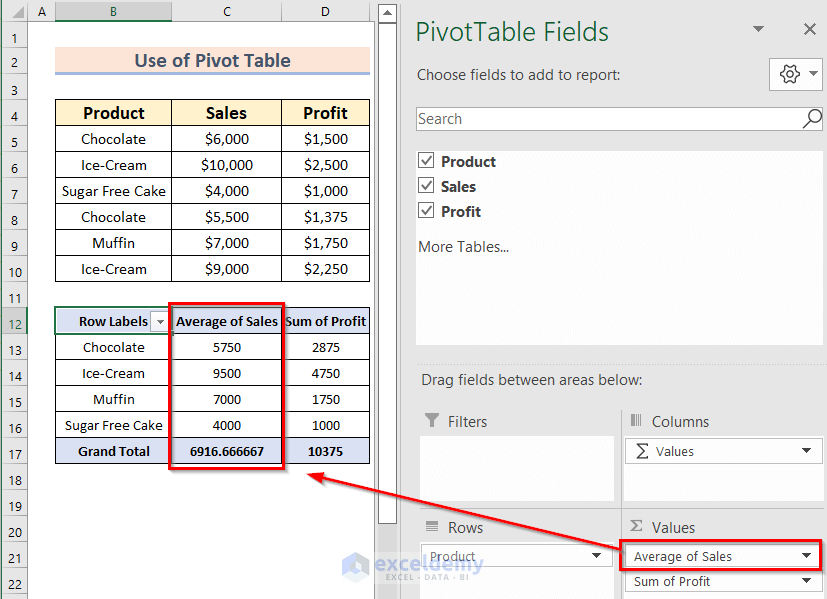
- Here are the results.
- By changing the operation for the Profit column from Sum to Max, you will get the following result.
How to Make a Pivot Chart
Steps:
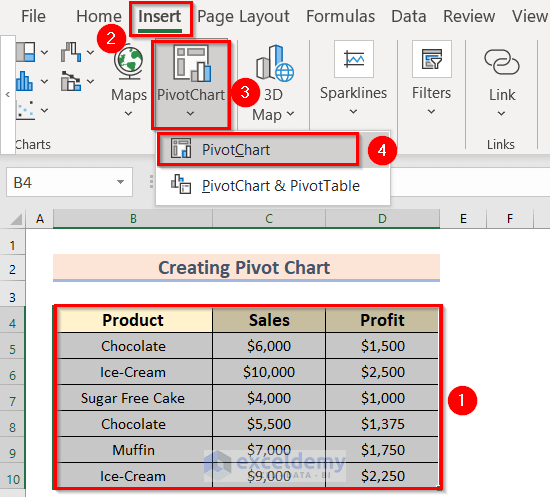
- Select the data range to plot with a pivot chart. We have selected the range B4:D10.
- Go to the Insert tab.
- From PivotChart, choose PivotChart.
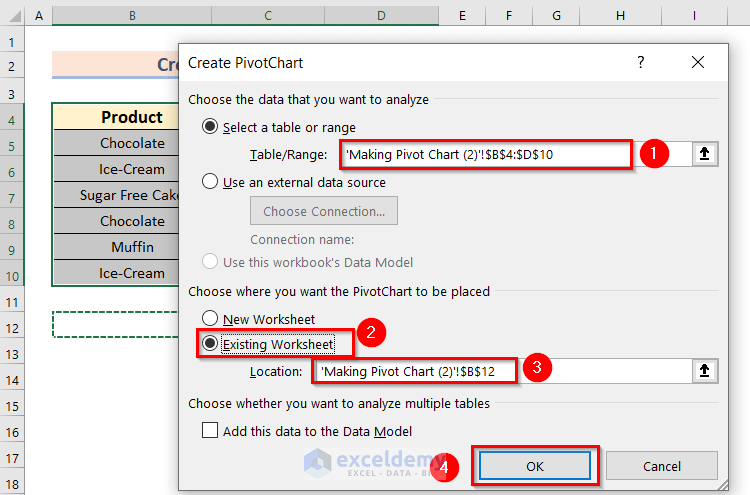
- A dialog box named Create PivotChart will appear.
- For Table/Range, keep the default selection.
- Click on Existing Worksheet under the choose where you want the PivotChart to be placed option.
- Choose the Location. We have chosen the new Location as cell B12.
- Click on OK.
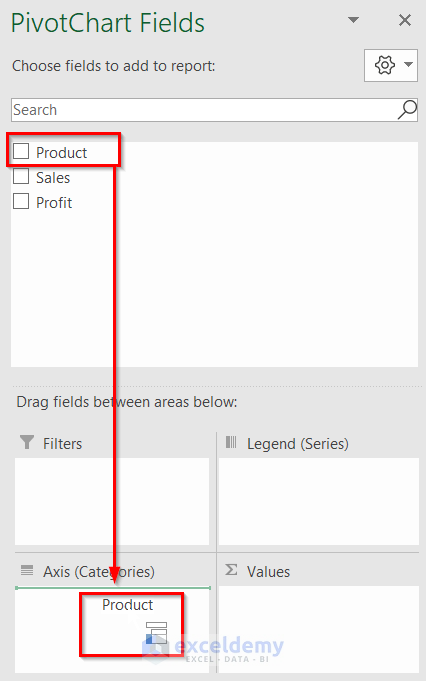
- You will get a blank chart and a Fields section on the right.
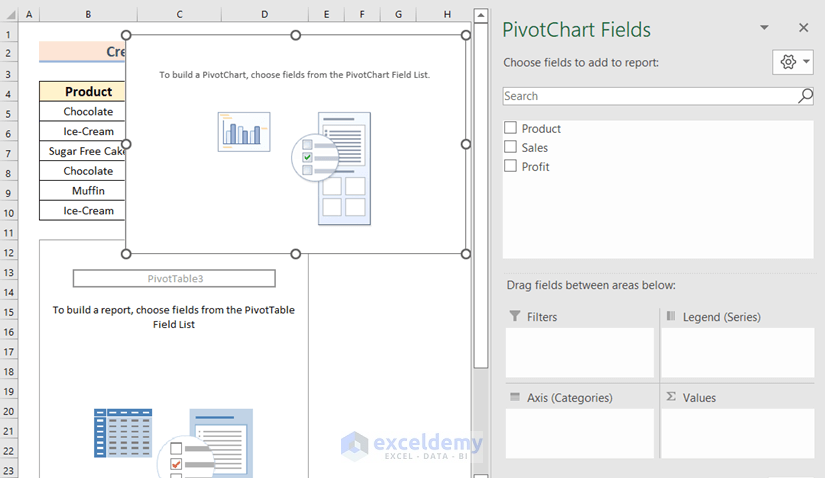
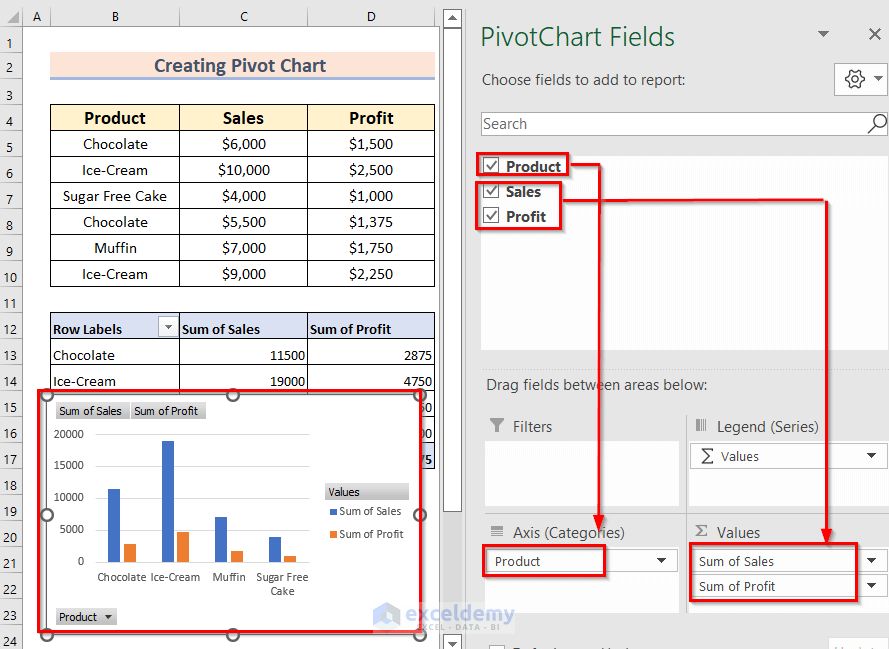
- In PivotChart Fields, drag Product to Axis (Categories).
- Drag Sales and Profit to the Values.
- The corresponding PivotTable will be auto-generated.
- Change the style and color of the pivot chart by clicking on the brush icon.
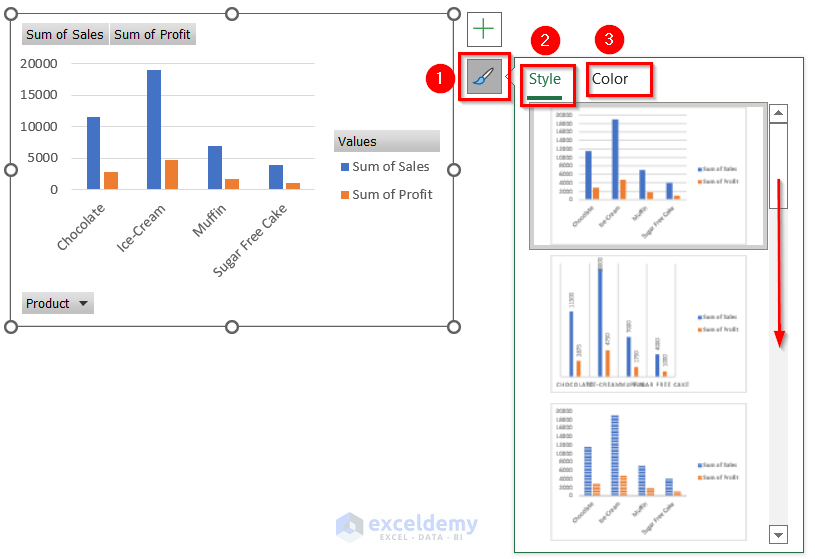 Here’s the formatted result.
How to Use a Pivot Chart in Excel
- You can sort or filter your data to see the graphical presentation of any targeted values.
- Also, you can do so many mathematical operations on your data using the PivotChart Fields feature. Such as summation, average, max, min, deviation, product, and so on.
- Moreover, you can use the pivot chart as a normal standard chart.
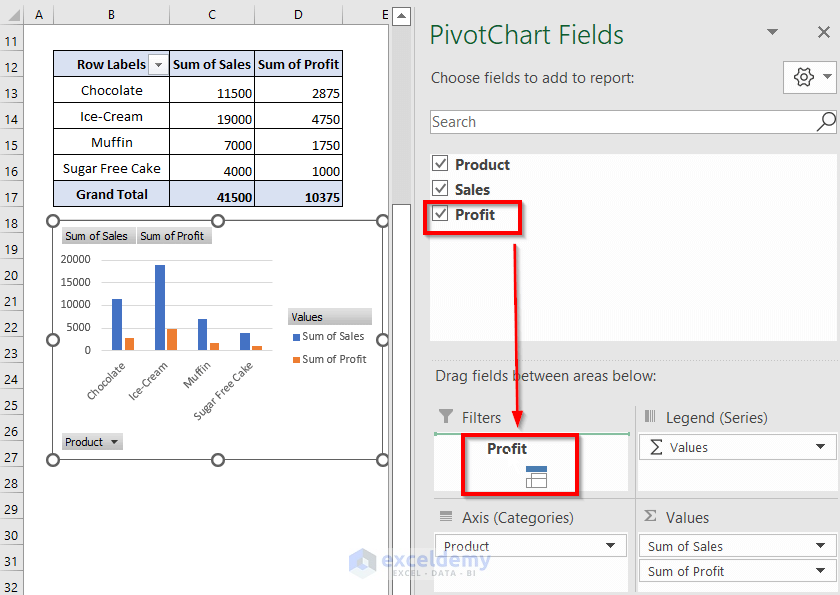
We’ll use a filter on the chart.
Steps:
- From PivotChart Fields, drag the Profit to Filters.
- Click on the Profit icon on the chart.
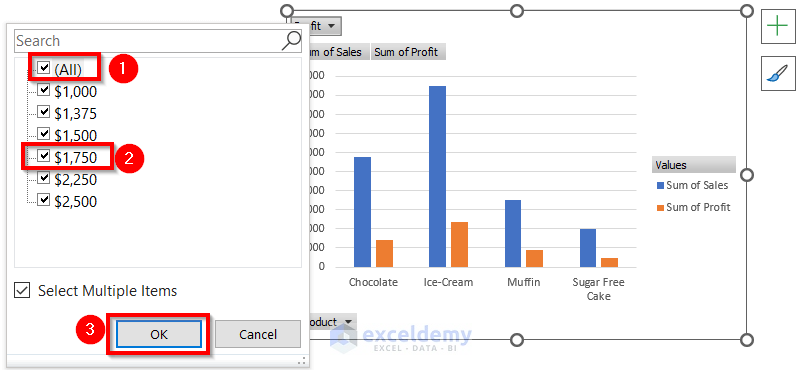
- Click on (All) to unselect all values.
- Select the target value(s). We have selected $1,750.
- Press OK.
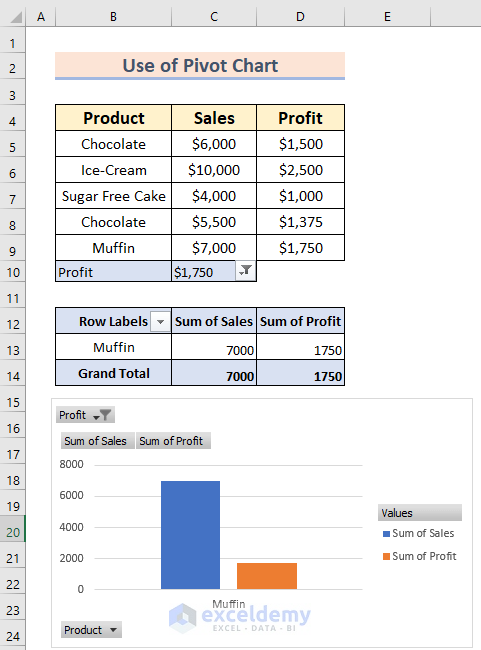
- Profit $1,750 was the value for Muffin, so you will see the following filtered output.
Read More: Use Excel VBA to Create Chart from Pivot Table
Differences Between a Pivot Table and a Pivot Chart
| Pivot Table | Pivot Chart |
|---|---|
| A pivot table is a table of summarized data. | A pivot chart is the visual representation of the corresponding pivot table. |
| You can create only a pivot table. | If you create a pivot chart, the corresponding pivot table will be auto-generated. |
| There are lots of features in the pivot table. | In the pivot chart, you can use the features that are available in the corresponding pivot table. |
Things to Remember
- To delete the pivot table, select the entire table and press the Delete button.
- To keep the pivot chart only, hide the pivot table. If you delete the pivot table, you can’t make any functional changes to the corresponding chart.
- Deleting the pivot table will convert the corresponding pivot chart into a normal chart.
- If there are any square brackets in your workbook name, you may get the Data Source Error. In this case, remove all the invalid Excel characters from the file name.
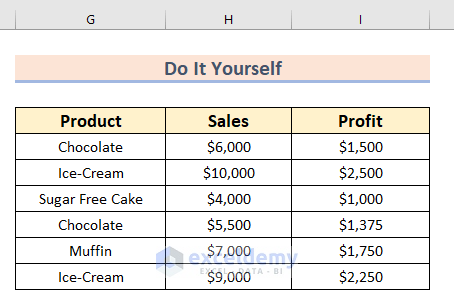
Practice Section
We’ve included a practice datasheet in the download file.
Download the Practice Workbook
Related Articles
- Types of Pivot Charts in Excel
- How to Refresh Pivot Chart in Excel
- How to Edit Pivot Chart in Excel
- Data Labels in Excel Pivot Chart


Very well presentation of the subject. important steps are shown with RED mark which is a premium graphics. I appreciate such efforts.
I request you to read your other article if you can share it, as a professional.
I am a qualified CA & keep learning to enhance my knowledge to upgrade.
Regards
CA JK Pahuja