In business, the debt-to-equity ratio is an essential factor to evaluate, because it expresses the condition of a business. We can easily guess the risk of our business at any time. And it’s quite easy to calculate. From this article, you will learn 3 practical examples of using the Excel debt-to-equity ratio formula.
What Is Debt to Equity Ratio?
The debt-to-equity ratio (D/E) is called a financial ratio expressing the ratio of the debt used to finance a company’s assets and shareholders’ equity. It is quite related to leverage. This ratio is also known as risk, gearing. The two terms are often picked from the company’s balance sheet or financial statement. but we can also calculate the ratio using market values for both.
What Is the Formula of Debt to Equity Ratio?
The formula is so simple, that we’ll just have to divide the total debt by the total shareholder’s equity.
What Does the Value of Debt to Equity Ratio Interpret?
The debt-to-equity ratio helps to understand whether is there enough shareholder’s equity to cover the debts or not. Investors can change the ratio if they guess the risks in the long term. The lenders can also make decisions on whether they should invest more or not. Because higher debts compared to shareholder’s equity indicates that the company is in a risky situation. It can also be negative although it’s not a regular scenario. A negative ratio indicates that the company’s shareholder equity turned negative which means the company has more debt than assets. It’s a very risky sign for a company because can face bankruptcy at any time.
How to Use Debt to Equity Ratio Formula in Excel: 3 Examples
Now let’s explore three easy practical examples to understand the debt-to-equity ratio properly.
Example 1: Single Equity with Limited Number of Debts
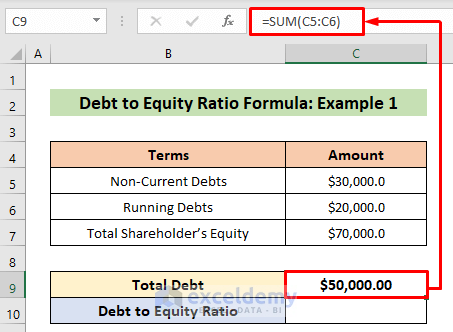
We have a company that has only two kinds of debts- Non-current debts and running debts. So we’ll have to sum up first to get the total debts using the SUM function.

Steps:
- Activate cell C9 by clicking there.
- Then insert the following formula into it-
=SUM(C5:C6)- Later, just hit the ENTER button to get the total debt.
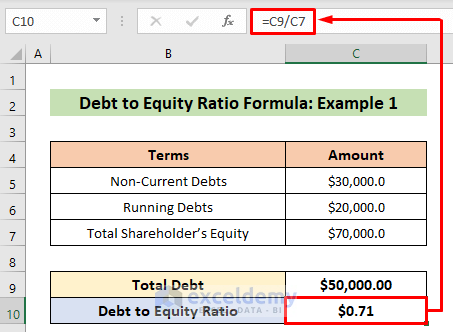
- Now we’ll just divide the total debt by the total shareholder’s equity. So, type the following formula in cell C10–
=C9/C7- Finally, just press the ENTER button to get the debt-to-equity ratio.
The ratio is less than 1, which means the company has enough equity compared to the total debts.
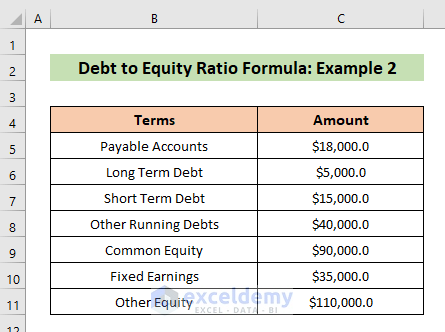
Example 2: Multiple Number of Equity and Debts
Here’s another balance sheet of a company that has four kinds of debts and three kinds of equity. So we’ll have to calculate the sum individually before finding the debt-to-equity ratio.
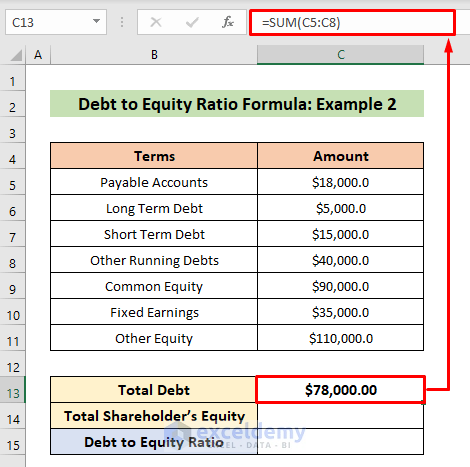
Steps:
- Firstly, insert the following formula in cell C13 to calculate the total debts-
=SUM(C5:C8)- Next, press the ENTER
- After that, write the following formula in cell C14 to determine the total equity-
=SUM(C9:C11)- Then press the ENTER button for the output.
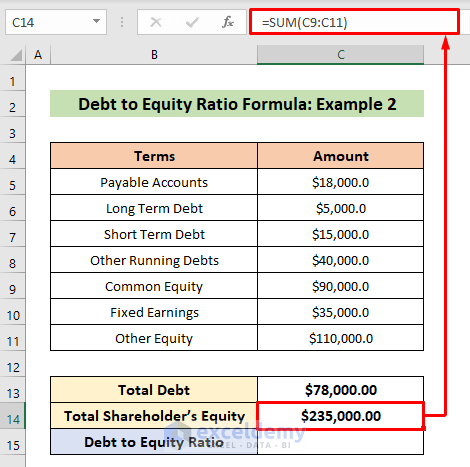
- Now it’s time for the final calculation. In cell C15, insert the formula as given below-
=C13/C14- Finally, just hit the ENTER button to finish.

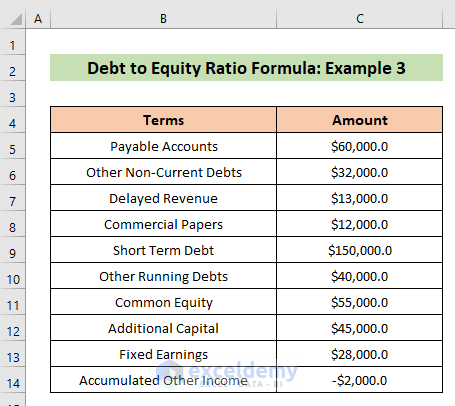
Example 3: Dealing with Any Negative Value
Assume another company, which has 6 kinds of debts and 4 kinds of equities on its balance sheet. Here, one of the values is negative (C14). You need to see whether the value is negative or positive (as long as you have the correct value), all you need to do is apply the formula and Excel performs the calculation. The procedures are the same as in the previous example. It doesn’t matter how many debts or equities are on the balance sheet, we’ll calculate the debt and equity separately and then will just divide.
Steps:
- First, insert the following formula in cell C16 to calculate all the total debts-
=SUM(C5:C10)- Next, hit the ENTER button for the result.

- After that, use the formula given below in cell C17–
=SUM(C11:C14)- Later, press the ENTER button and it will give the total equity.

- Lastly, divide the total debts by the total equity by using the following formula-
=C16/C17- Hit the ENTER button to finish.
Have a look, here the ratio is pretty high which means the total debt is greater than the equity. So the company is in a risky situation.

Download Practice Workbook
You can download the free Excel workbook from here and practice independently.
Conclusion
That’s all for the article. I hope the procedures described above will be good enough to use the debt-to-equity ratio formula in Excel. Feel free to ask any question in the comment section and please give me feedback.
<< Go Back to Debt Calculation | Formula List | Learn Excel
Get FREE Advanced Excel Exercises with Solutions!
