Latest Posts From Adnan Masruf

Method 1 - Using VBA Code Select the graph from which you want to extract data points. Create a new worksheet and name it VBACode. ...

Method 1 - Using the STOCKHISTORY Function The STOCKHISTORY function is a powerful tool in Excel that retrieves historical data for stocks or financial ...
Method 1 - Using a Pivot Table to Create a Table with Subcategories in Excel Steps: Select a cell in the dataset. Go to the Insert tab. Click Pivot ...

Method 1 - Determining Average Price Steps: Select the F5 cell and write down the following formula, ...

Method 1 - Using the Translate Command to Translate English to Hindi in Excel Steps: Select the C5 cell. Go to the Review tab. Select Translate. ...

Solution 1 - Enabling Automatic Hyperlink Steps: Go to the File tab. Select Options. In Excel Options, select Proofing. Select ...
Method 1 - Applying Advanced Option Steps: Select the B5 cell and double-click on it. See the formula within the cell depicting the summation of ...

In recent years, Google Sheets has become a strong alternative to Excel. As more and more people are using Google Sheets and the number of Excel users is also ...
Method 1 - Using Combination of Text to Columns and Paste Special Commands Steps: Select the email addresses that you want to paste and press Ctrl+C. ...
![[Fixed!] Paste Special Not Working in Excel (4 Possible Solutions)](https://www.exceldemy.com/wp-content/uploads/2022/11/paste-special-not-working-in-excel-8.png?v=1697441952)
We often need to paste special values or numbers or characters in Excel. Excel allows users to paste different types of data through a feature called Paste ...

Method 1 - Using the Paste Special Command Steps: Select the cell that contains the drop-down list in the Excel file. In this case, it will be B4. ...

The confidence interval is a very important statistical parameter. It gives a proper insight into how precise a data survey is. This allows users to validate ...

In Excel operations, we often need to write complicated formulas. While presenting those operations those complex formulas may seem arcane to the spectators. ...

Method 1 – Applying the TEXTJOIN Function to Convert Column to Text with Delimiter The TEXTJOIN function combines values from a range or ranges and separates ...
Download Practice Workbook You can download the practice workbook here. Change Color of One Line in Chart.xlsx Method 1 - Applying Righ-Click on ...
See Our Reviews at


Dear Nirmal,
Could you please provide me with your Excel file that you have mentioned or some screen shots from your dataset? That would help me to understand your dataset and answer your query accordingly.
Thanks for your query.
Regards,
Adnan
Team ExcelDemy
Dear Raman,
1. First, make sure you are using MS Office 365 as they are only available in that version.
2. Secondly, make sure you are logged into your MS Excel account.
3. Thirdly, make sure to have the English, French, German, Italian, Spanish, or Portuguese editing language added to Office Language Preferences.
If these do not work then,
-Go to File > Options > Trust Center > Trust center Settings > External Content > Security settings for “Linked data types” > Activate “Enable all Linked Data Types”
or
– Go to Options>Customize Ribbon> All Commands
– Then, choose the Datatype Command
-Add the command to a “New Group”
-Finally, restart your Excel Application.
*Also, make sure to keep your internet connection ON; as this data type is linked datatype.
*You should also see if this datatype is available in your geopolitical locaton.
Dear K,
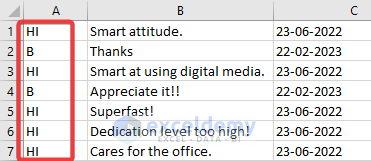
Thanks for your query. If we add replies to the comments (Like the first picture), we can find the replies by simply looking at the initials without changing the macros (Like the second picture)