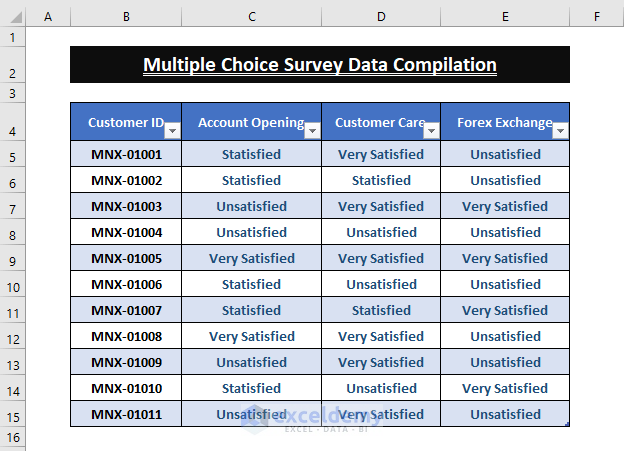
Suppose we have a dataset of compiled survey data and we want to analyze it.
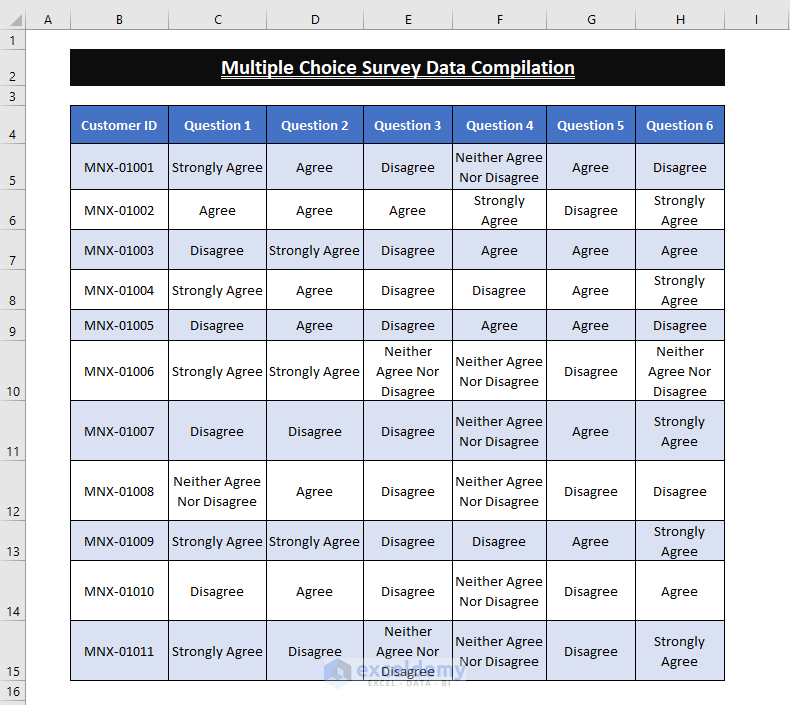
In this article, we’ll use multiple formulas and the Power Query method to analyze this survey data by preparing a visual representation of the responses to every question.
Method 1 – Using Multiple Formulas to Analyze Survey Data with Multiple Responses
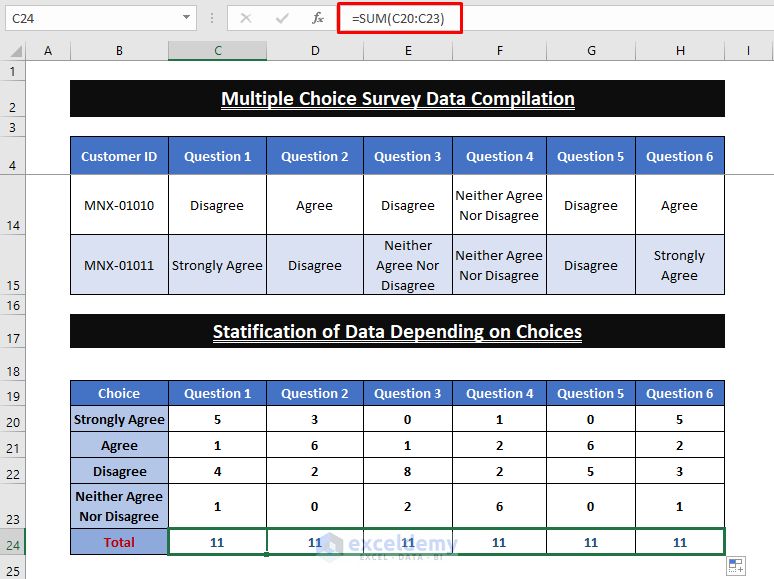
In the survey data, we have multiple responses to individual questions from different customers. First we need to count the number of each response to a particular question. The percentage of each response compared to the total number of responses will reflect the customer’s opinion.
Step 1 – Creating a Survey Data Report
- Count a specific response (for example Strongly Agree in cell B20) from the Question 1 array (cells C5:C15) using the following COUNTIF formula:
=COUNTIF($C$5:$C$15,B20)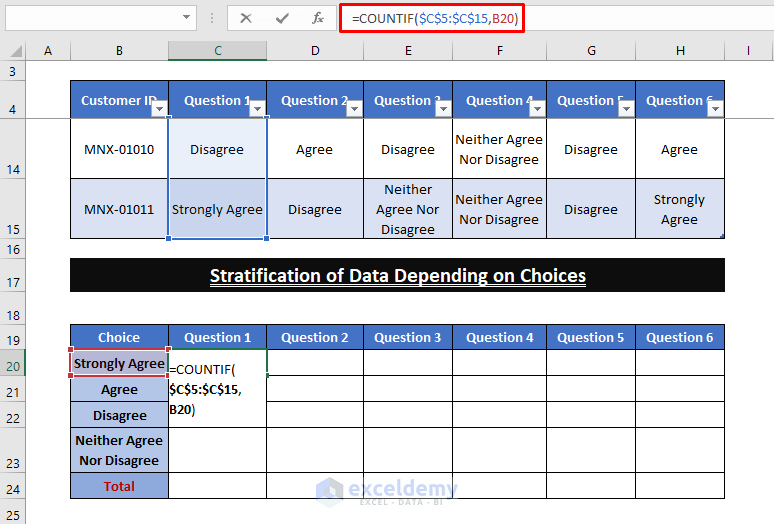
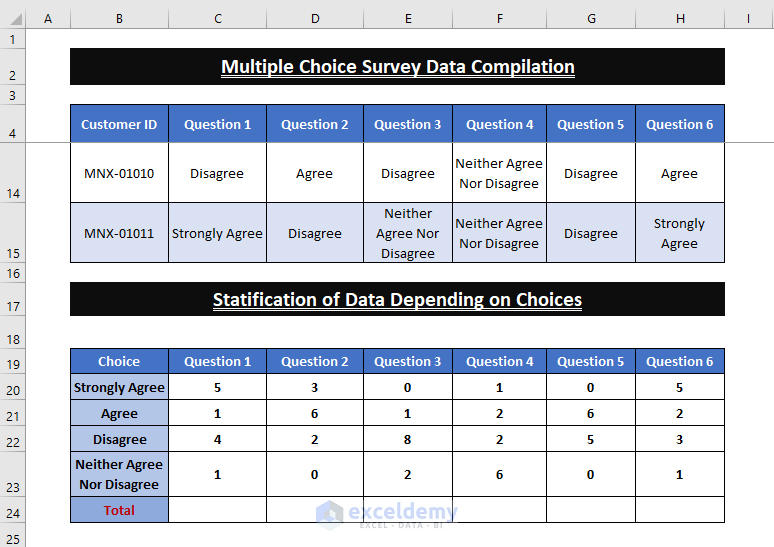
- Repeat the formula for the other responses as shown in the below image.
- To find the total responses for each question, type the below SUM formula in any blank cell in the Total row:
=SUM(C20:C23)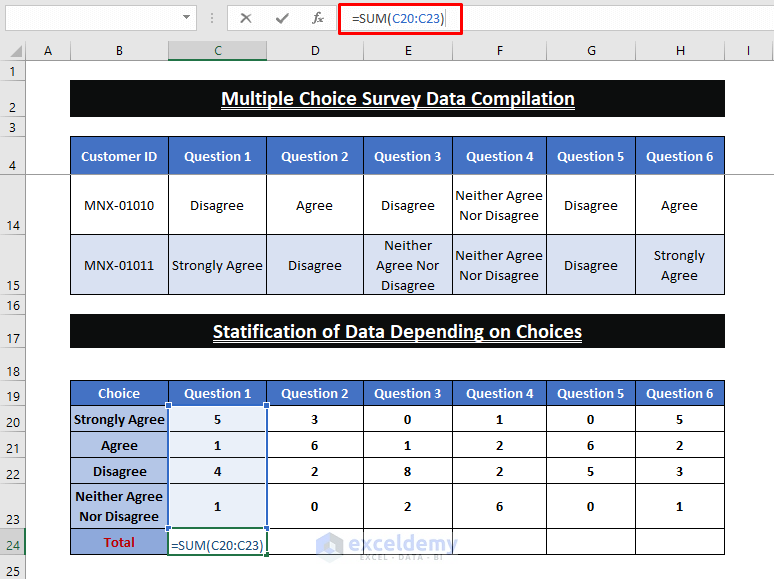
- Repeat the SUM formula to find the total responses to the other questions.
- To generate a report, enter the below formula in any cell in the Multiple Responses range (for example cell C29):
=C20/$C$24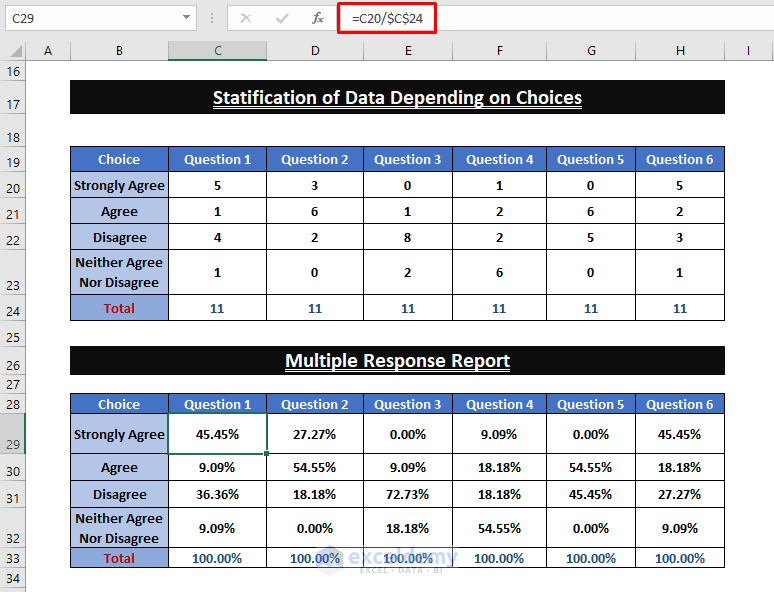
The percentage for each response for each question is returned, indicating the customers’ overall view concerning that question.
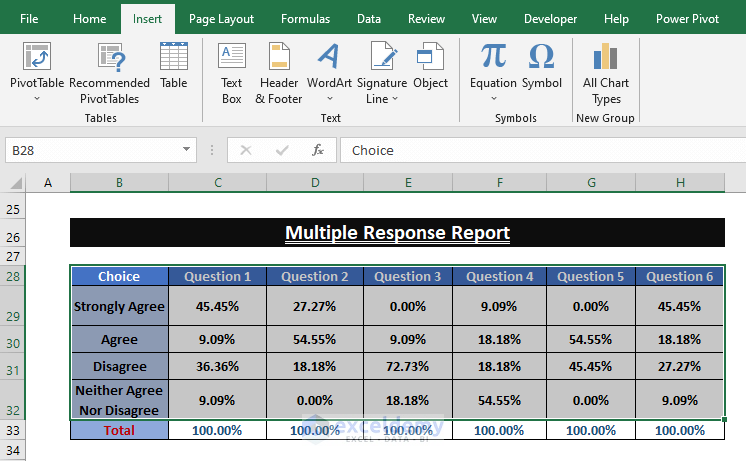
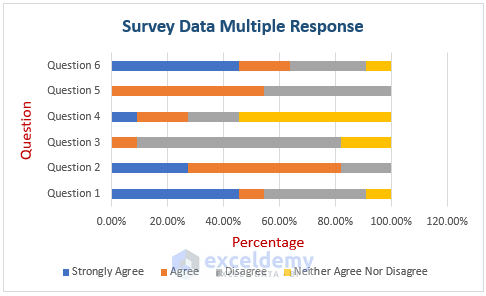
Step 2 – Presenting the Report in a Stacked Bar Chart
- Highlight the range.
- Go to the Insert tab.
- Click on All Chart Types.
The Insert Chart window opens.
- Choose any of the Recommended Charts (here, Stacked bar).
- Click on OK.
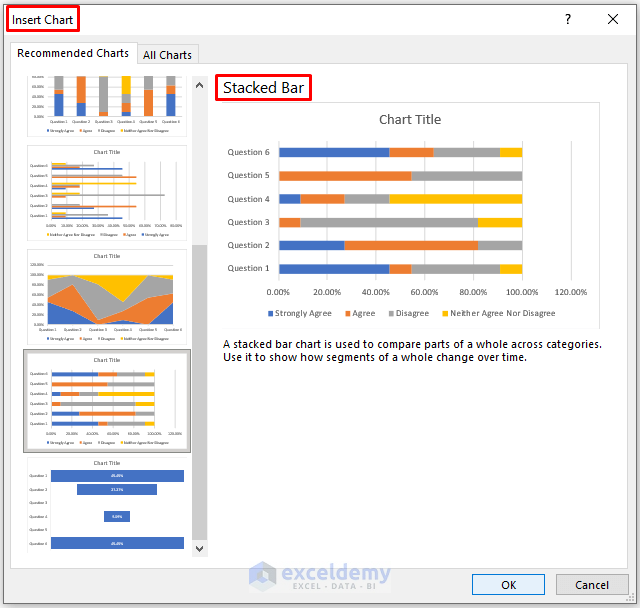
Excel inserts a Stacked bar Chart as depicted in the below picture.
- Format your Data Chart as desired.
Method 2 – Using Power Query to Analyze Survey Data with Multiple Responses
We can also use Power Query for better representation of our data in a Table.
Steps:
- Select the entire range.
- Go to the Data tab.
- Click on From Table/Range.
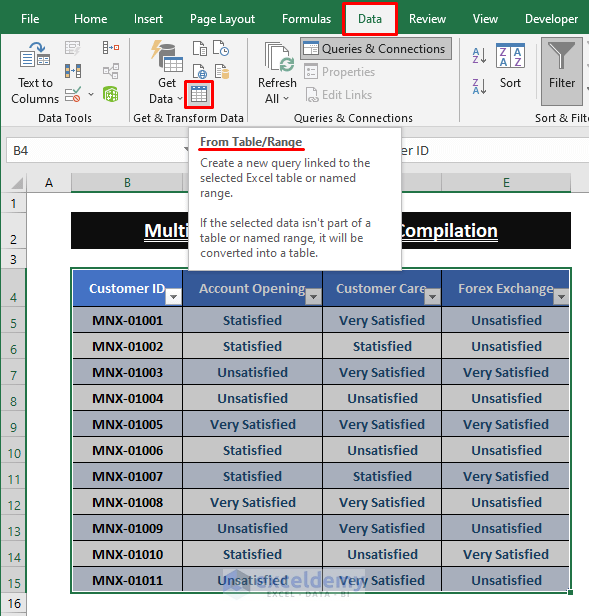
Excel loads the Power Query Editor window.
- Select columns (using CTRL+Click) except the Column ID column.
- Select the Transform tab.
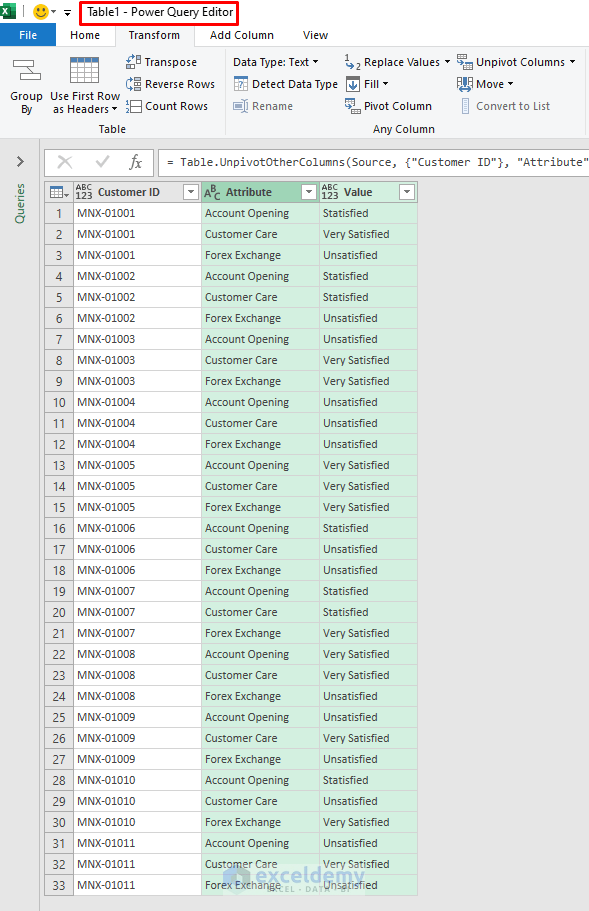
- Click on Unpivot Columns.
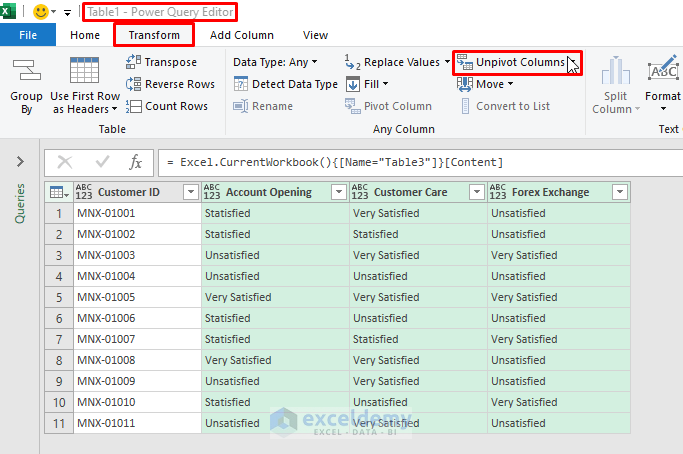
Excel transforms all the data as depicted in the below picture. All the entries within the selected columns get unpivoted.
- Go to the Home tab.
- Select Close & Load, then the Close & Load option.
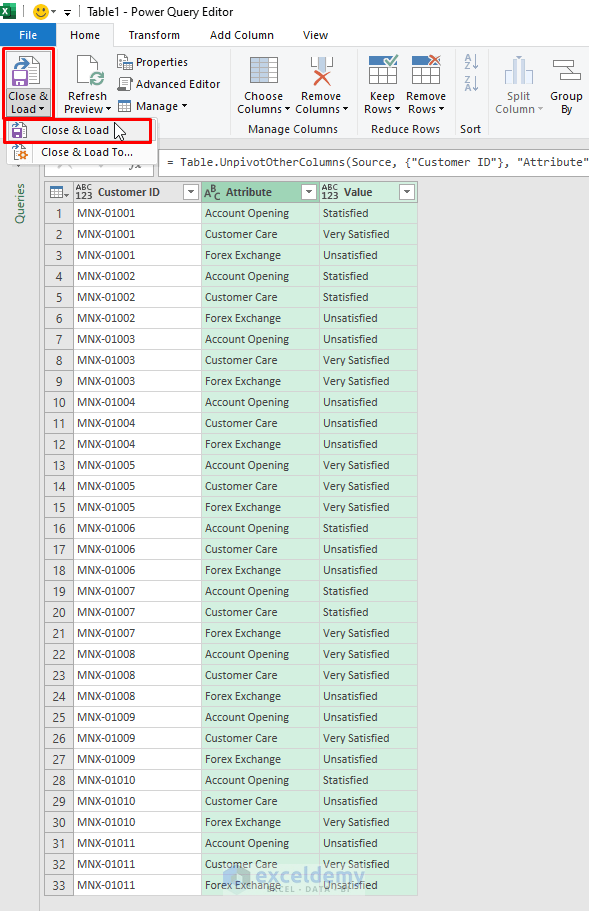
Excel loads all the columns.
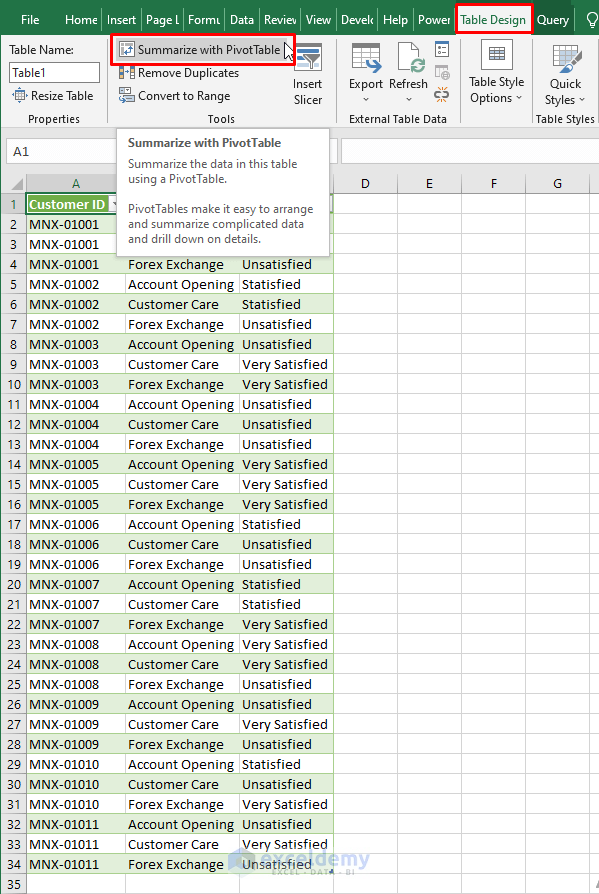
- Place the cursor in any cell and the Table Design tab appears.
- Click on the Table Design tab.
- Click on Summarize with Pivot Table in the Tools section.
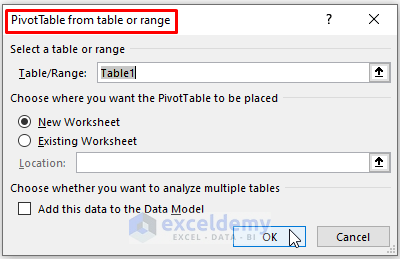
The PivotTable from table or range window appears.
- Choose New Worksheet as Choose where you want the PivotTable to be placed.
- Click on OK.
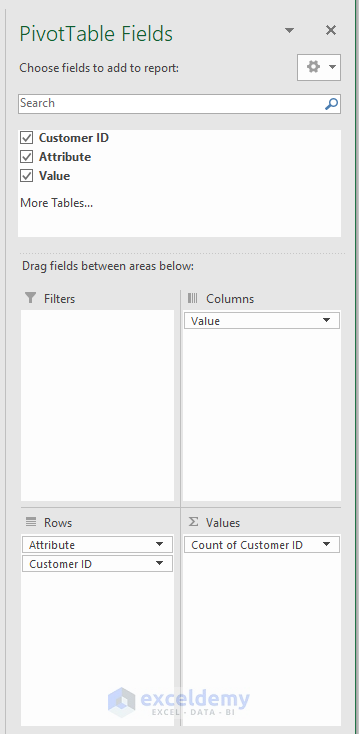
- In the PivotTable Fields section, under Choose fields to add to report, tick all the fields.
- Drag the respective fields to the Rows and Values boxes as shown below.
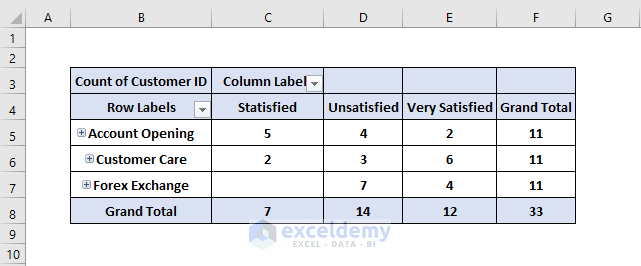
A Pivot Table is created, as shown in the below image.
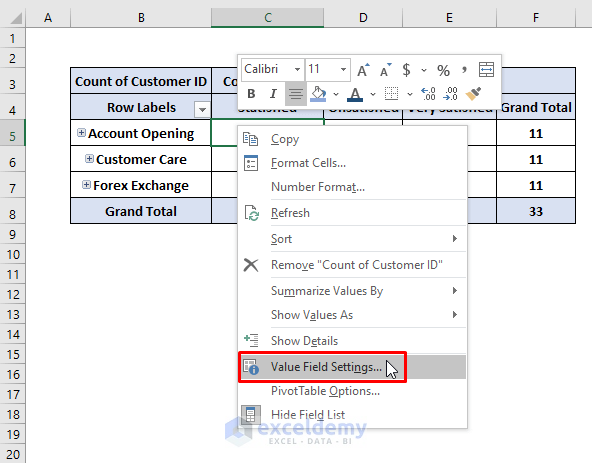
- Right-click on a cell value.
- Choose the Value Field Settings option from the Context Menu.
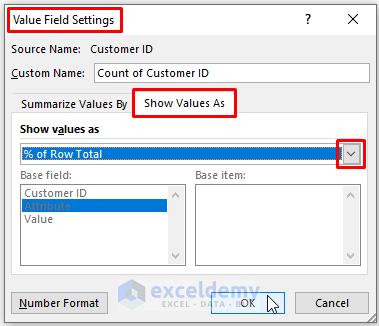
The Value Field Settings dialog box appears.
- Select Show Value As section.
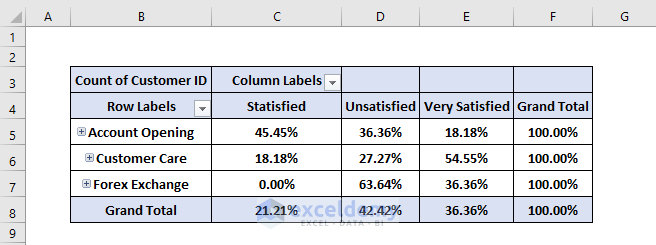
- Choose % of Row Total under the Show values As command (as the rows represent an entire section response).
- Click OK.
Each response’s results are now displayed as a percentage of total responses.
We have used just a small portion of our survey data to analyze survey responses and provide a better overview. Using the techniques above, add more response items for each section as desired.
Read More: How to Analyze Satisfaction Survey Data in Excel
Download Excel Workbook
Related Articles
- How to Tally Survey Results in Excel
- How to Tabulate Data in Excel
- Display Survey Results in Excel
- How to Create a Questionnaire in Excel
- How to Analyze Survey Data in Excel
- How to Encode Survey Data in Excel
<< Go Back to Survey in Excel | Excel for Statistics | Learn Excel
Get FREE Advanced Excel Exercises with Solutions!
