Dataset Overview
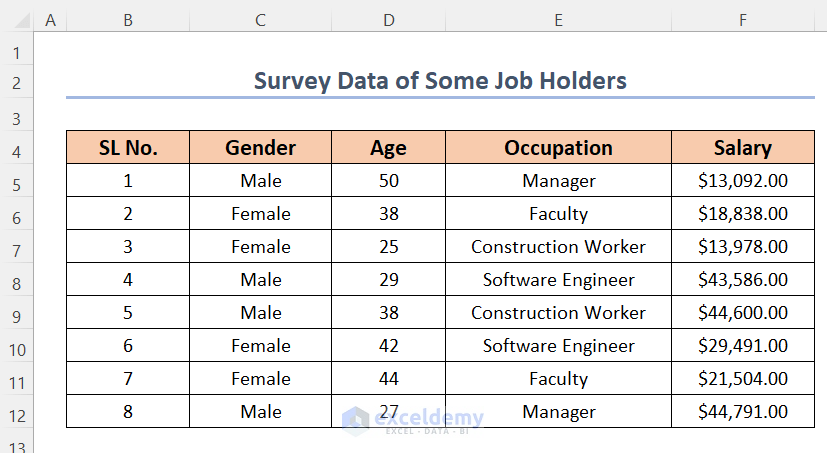
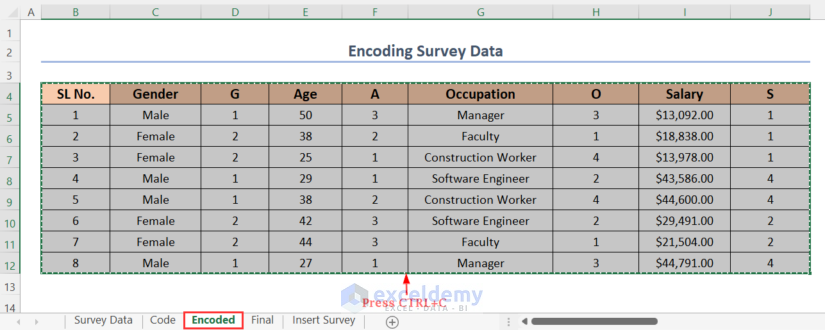
In the following dataset, we have data from a survey among some jobholders. We have gathered their gender, age, occupation, and salary here. We want to encode the data.
Step 1 – Classifying Values into Different Groups
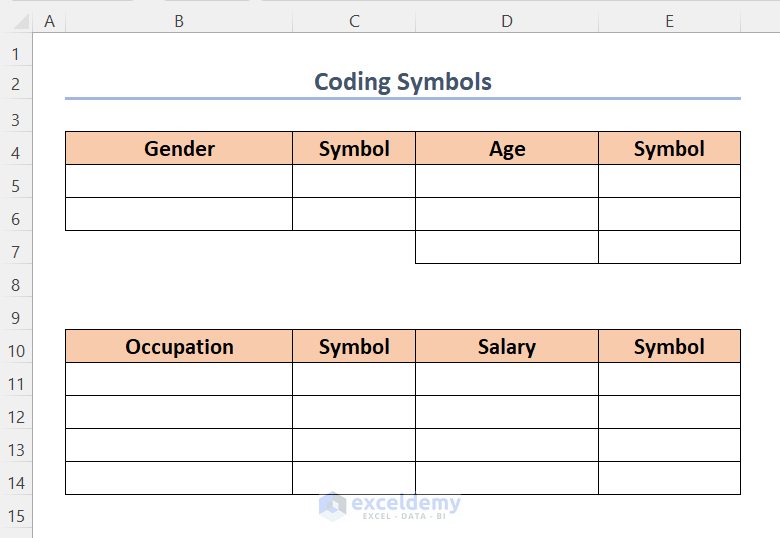
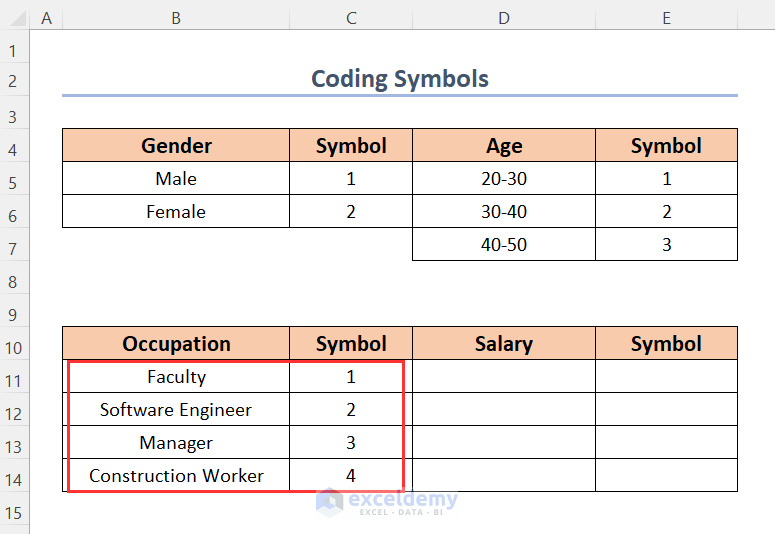
- Create tables to store corresponding symbols for genders, ages, occupations, and salaries.
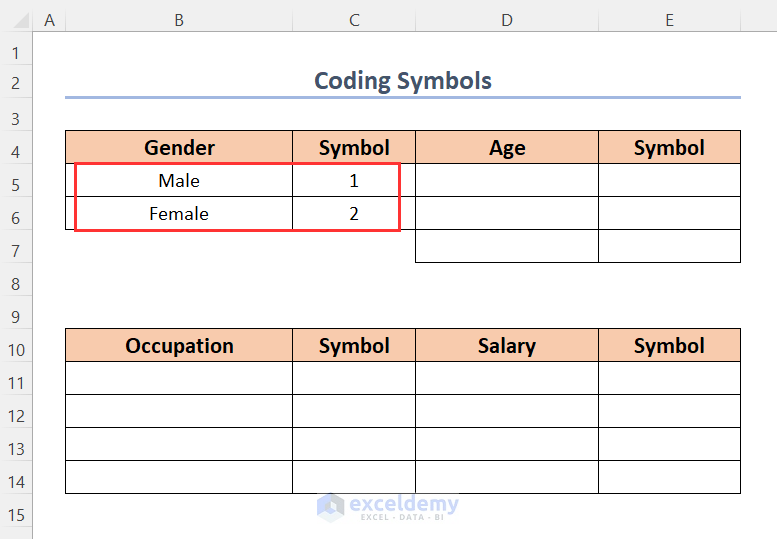
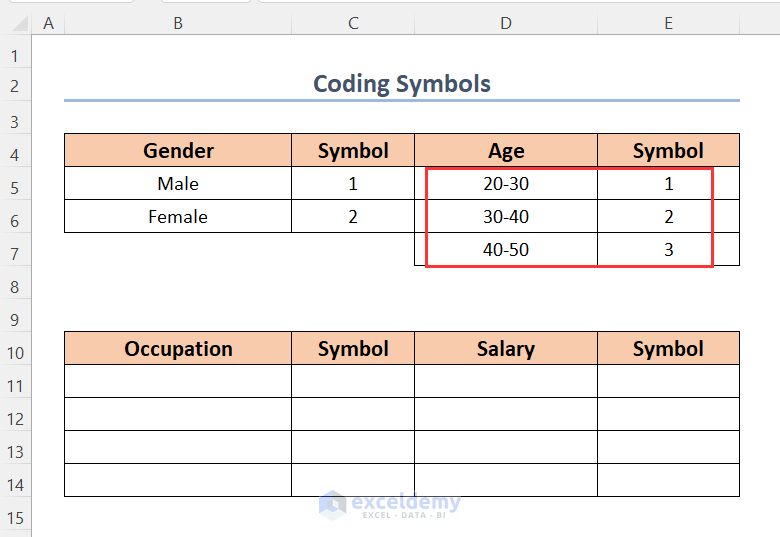
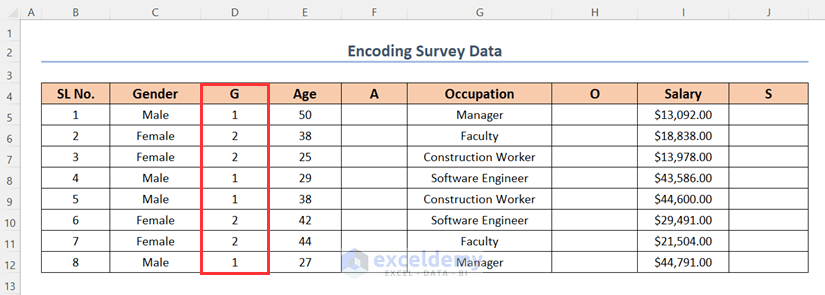
- Assign codes: Male (1), Female (2).
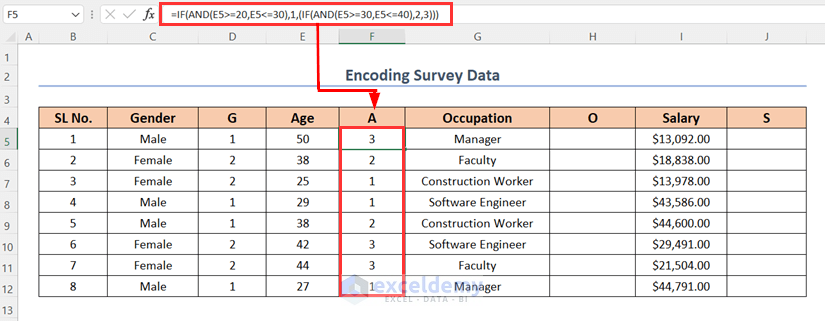
- Assign codes: Age groups: 20-30 (1), 30-40 (2), 40-50 (3).
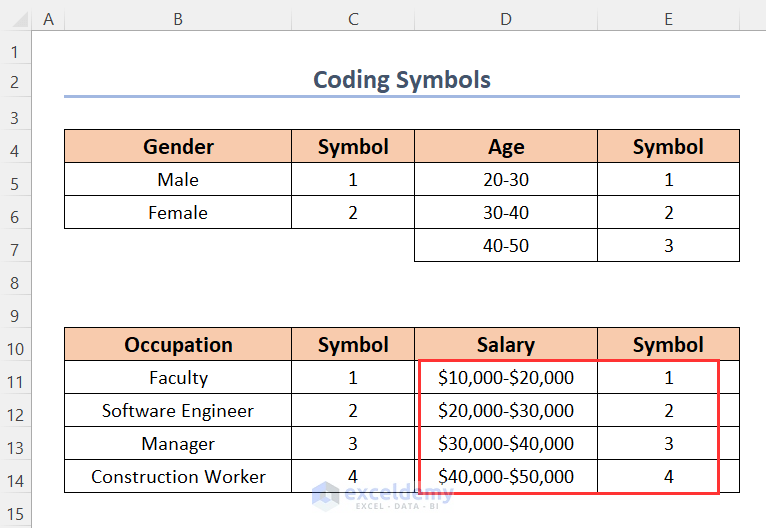
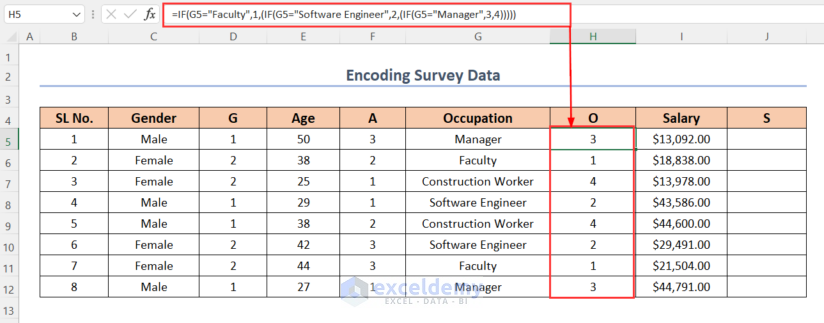
- Assign codes: Occupations: Faculty (1), Software Engineers (2), Managers (3), Construction Workers (4).
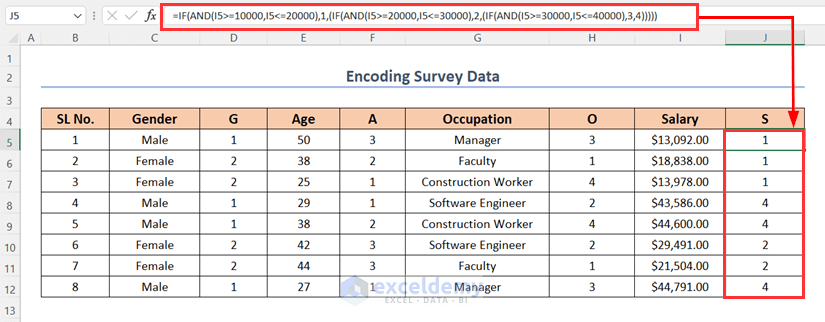
- Assign codes: Salary ranges: $10,000-$20,000 (1), $20,000-$30,000 (2), $30,000-$40,000 (3), $40,000-$50,000 (4).
Step 2 – Inserting New Columns with Coded Column Headers
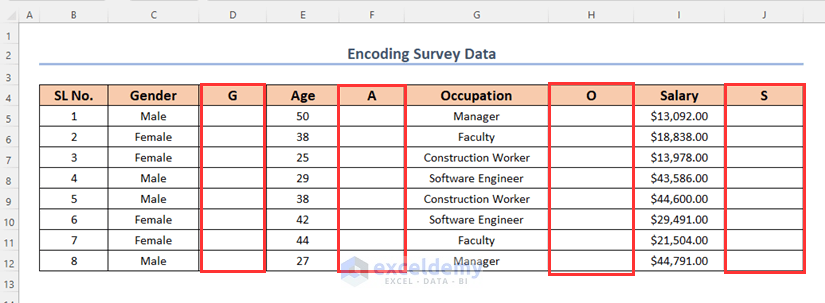
- Add four new columns after the existing Gender, Age, Occupation, and Salary columns.
- Name these columns as G (Gender), A (Age), O (Occupation), and S (Salary).
Step 3 – Inserting Formulas to Encode Survey Data
- For Gender (cell G5):
=IF(C5="Male",1,2)Here, IF will check if the value in cell C5 is Male, if it is we will get 1 otherwise 2.
-
- Drag down the Fill Handle tool.
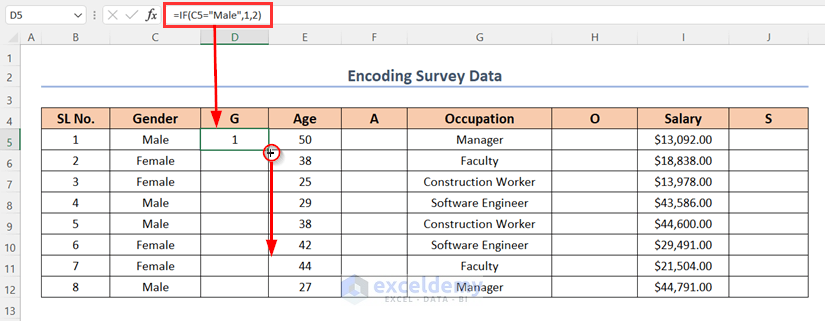
This encodes all of the genders of the survey participants.
- For Age (cell E5):
=IF(AND(E5>=20,E5<=30),1,(IF(AND(E5>=30,E5<=40),2,3)))Formula Breakdown
-
- AND(E5>=20, E5<=30) → The AND function will check both of these conditions, and return TRUE for satisfying both, otherwise FALSE. If we get TRUE here, then IF will return 1, otherwise, we will go to the next IF function.
- IF(AND(E5>=30, E5<=40),2,3) → If both of the conditions are satisfied then AND will return TRUE, as a result, we will get 2 otherwise 3.
- For Occupation (cell G5):
=IF(G5="Faculty",1,(IF(G5="Software Engineer",2,(IF(G5="Manager",3,4)))))Here, we have used 4 IF functions to generate 1 for Faculty, 2 for Software Engineers, 3 for Managers, and 4 for Construction Workers.
- For Salary (cell I5):
=IF(AND(I5>=10000,I5<=20000),1(IF(AND(I5>=20000,I5<=30000),2(IF(AND(I5>=30000,I5<=40000),3,4)))))Here, we have used 3 IF functions and AND functions to generate 1 for the $10,000-$20,000 salary group, 2 for the $20,000-$30,000 salary group, 3 for the $30,000-$40,000 salary group, and 4 for the $40,000-$50,000 salary group.
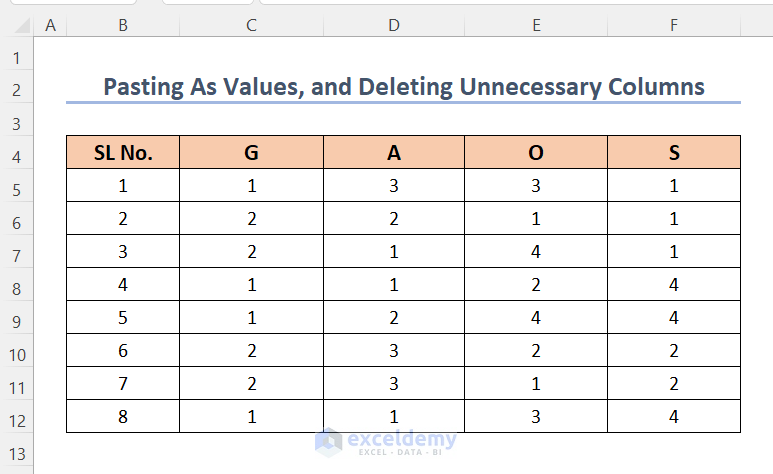
Step 4 – Pasting As Values and Deleting Unnecessary Columns

- Copy the encoded data.
- Paste it as values in a new sheet.
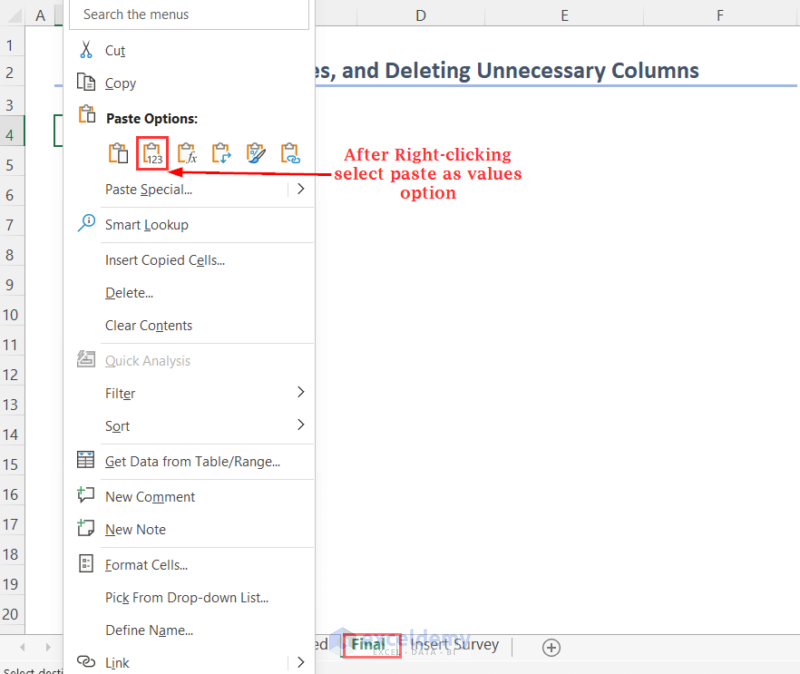
We have pasted the dataset where we don’t have any formulas, only values.
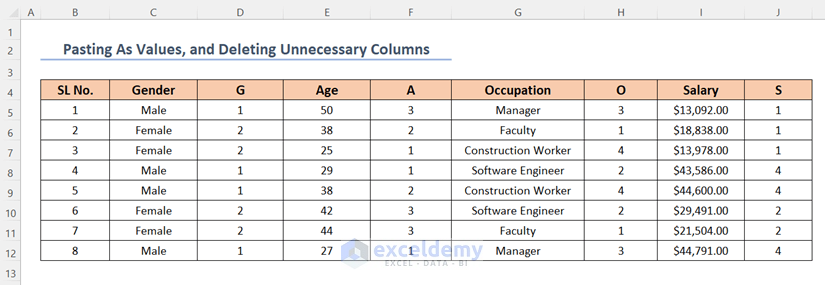
- Delete unnecessary columns to get the final table with encoded survey data.
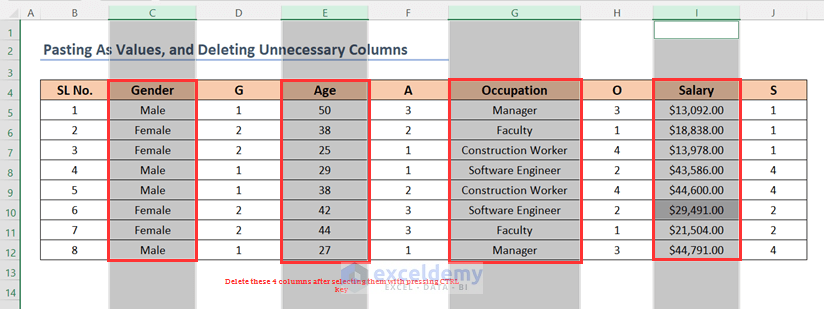
We will get the following table with encoded survey data.
How to Show Survey Results in Excel
To vividly display survey results in Excel, follow these steps:
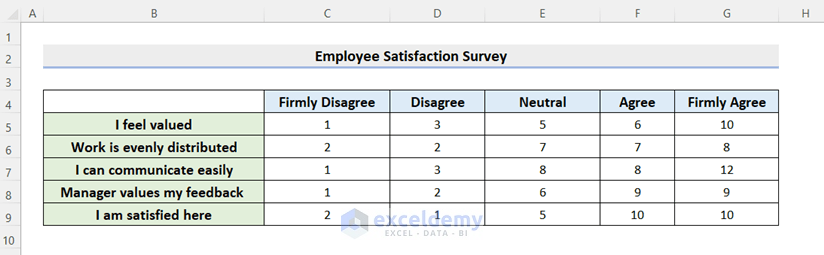
- Enter the Survey Results in Excel:
- Input your survey data into an Excel worksheet. For example, consider a sample dataset from an Employee Satisfaction Survey.
- Create a Data Preparation Table:
- Copy the range B4:G9 (containing survey data) by pressing Ctrl + C.
- Select the range B11:G16 and paste the data there using the Paste Link feature.
- Add a minus sign before the cell references in columns C and D.
- Calculate the neutral values by dividing E5 by 2 (in cells E12 and F12).
- Insert an Excel Stacked Bar Chart:
- Select the range B11:H16.
- Go to the Insert tab and choose a 2-D Bar chart.
- Switch the row and column axes to display survey results effectively.
- Adjust the Data Preparation Table:
- Swap columns C11:C16 with E11:E16 and maintain the original formulas.
- The positions of the “Firmly Disagree” and “Neutral” sections will change.
- Edit the Color Scheme:
- Assign colors to different responses (e.g., Light Orange for Neutral, Orange for Disagree, Deep Orange for Firmly Disagree, Light Green for Agree, and Green for Strongly Agree).
- Update the Legend:
- Remove the initial Disagree reference from the legend.
- Insert a blank column for Disagree and adjust its position.
- The final output will precisely display the survey results in Excel.
If you want to display your survey data vividly in Excel, then you can follow this section.
To make this survey more eye-catching, and easy reading you need to display the survey results.
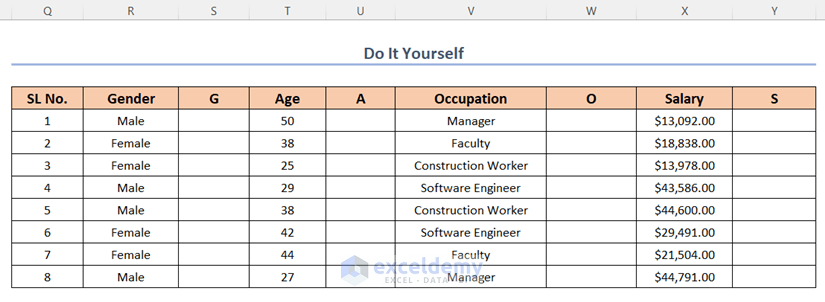
Practice Section
To practice by yourself, we have created a Practice section on the right side of each sheet.
Download Practice Workbook
You can download the practice workbook from here:
Related Articles
- How to Analyze Survey Data in Excel
- How to Tally Survey Results in Excel
- How to Tabulate Data in Excel
- How to Analyze Survey Data with Multiple Responses in Excel
- How to Analyze Satisfaction Survey Data in Excel
- How to Create a Questionnaire in Excel
<< Go Back to Survey in Excel | Excel for Statistics | Learn Excel
Get FREE Advanced Excel Exercises with Solutions!
